Significance
The recently revised stricter US National Ambient Air Quality Standard for ground-level ozone (O3) requires precise methods to screen “exceptional events,” such as naturally occurring deep stratospheric intrusions. However, existing approaches used in detecting stratospheric intrusions and evaluating their contributions to ground-level O3 enhancement are not satisfactory. Here, we introduce the use of cosmogenic 35S to assist in such quantifications. We measured the highest 35S concentration in natural sulfate aerosols ever reported in the literature during deep stratospheric intrusions. The downward transport of stratospheric O3 is confirmed by air quality data and meteorological analysis, showing the high sensitivity of 35S as a stratospheric tracer and its utility to understand atmospheric transport and chemistry processes.
Keywords: stratosphere–troposphere exchange, surface ozone, National Ambient Air Quality Standard, radioactive isotope of sulfur, Santa Ana wind
Abstract
The extent to which stratospheric intrusions on synoptic scales influence the tropospheric ozone (O3) levels remains poorly understood, because quantitative detection of stratospheric air has been challenging. Cosmogenic 35S mainly produced in the stratosphere has the potential to identify stratospheric air masses at ground level, but this approach has not yet been unambiguously shown. Here, we report unusually high 35S concentrations (7,390 atoms m−3; ∼16 times greater than annual average) in fine sulfate aerosols (aerodynamic diameter less than 0.95 µm) collected at a coastal site in southern California on May 3, 2014, when ground-level O3 mixing ratios at air quality monitoring stations across southern California (43 of 85) exceeded the recently revised US National Ambient Air Quality Standard (daily maximum 8-h average: 70 parts per billion by volume). The stratospheric origin of the significantly enhanced 35S level is supported by in situ measurements of air pollutants and meteorological variables, satellite observations, meteorological analysis, and box model calculations. The deep stratospheric intrusion event was driven by the coupling between midlatitude cyclones and Santa Ana winds, and it was responsible for the regional O3 pollution episode. These results provide direct field-based evidence that 35S is an additional sensitive and unambiguous tracer in detecting stratospheric air in the boundary layer and offer the potential for resolving the stratospheric influences on the tropospheric O3 level.
High ground-level ozone (O3) mixing ratios exert adverse impacts on human health, vegetation, and materials (1, 2). In the free troposphere, O3 is an important greenhouse gas contributing to global warming. It also controls the lifetime of other reactive greenhouse gases through oxidation processes (3), serves as the dominant precursor of the hydroxyl radical, and enhances the oxidizing capacity of the troposphere (4). Tropospheric O3 formation involves a series of photochemical reactions related to anthropogenic emissions of O3 precursors [e.g., nitrogen oxides (NOx), carbon monoxide (CO), and volatile organic compounds (VOCs)], biomass burning, and lightning (5). In addition, elevated levels of tropospheric O3 may be caused by the intrusion of O3-rich stratospheric air masses (4, 6–8). Detection of such stratospheric intrusion events by field-based measurements has been a major scientific concern since the 1970s (9). Concurrent measurement of ground-level O3, CO, and humidity is the most common method (10, 11), but it is ambiguous and only useful in extreme events and background sites. Ozonesondes, lidar, and aircraft measurements provide high-resolution information on vertical O3 distributions (12–14), but they are relatively expensive and not widely available. Therefore, it is crucial to find an additional and unambiguous stratospheric tracer at ground level to assist in such investigations.
35S (half-life = 87 d) is a cosmogenic isotope naturally produced by the interaction of high-energy cosmic rays with 40Ar in the atmosphere. The flux of cosmic rays and the production rate of 35S depend on both latitude and altitude, with higher values at the polar region and in the stratosphere (and lower at the equatorial region and in the boundary layer) (15). Cosmogenic 35S oxidizes to 35SO2 in ∼1 s after production and is further oxidized to 35SO42− before wet and dry removal. Therefore, the variation of 35SO42− concentrations at ground level is controlled by the SO2 oxidation and sulfate removal rates as well as air masses originating from the higher atmosphere. Because of the higher production rate of 35S in the stratosphere (one to two orders of magnitude greater than in the troposphere) (15), significant enhancement of 35SO42− concentration at ground level may offer a new tool to quantify the impact of deep stratospheric intrusions on tropospheric O3. A unique advantage of 35S is that it exists in both gas (SO2) and particle (sulfate) phases and has an ideal half-life (87 d) for studying atmospheric processes on synoptic scales, providing additional information on potential impacts of stratospheric intrusions on gas to particle (SO2 to SO42−) conversion rates. The development of the optimized low-level liquid scintillation counting technique (16) gave rise to a growing number of aerosol 35SO42− measurements in recent years. Based on simple and unconstrained 1D box model calculations, slightly elevated 35SO42− concentrations in early studies were linked to the polar vortex activity (17), Santa Ana winds, and shallow stratosphere–troposphere exchange events in southern California (18). Recent studies applied mesoscale meteorology models to investigate the possible downward transport processes of aged stratospheric air (19, 20). However, the reliability of 35S as a stratospheric tracer remains uncertain and debated, because the magnitudes of 35SO42− enhancements were relatively small and other stratospheric signatures (e.g., high O3 level and low humidity) were not observed in suspected aged stratospheric air masses (18, 19). Measurements of 35SO42− during deep stratospheric intrusions, which directly entrain fresh stratospheric air to the boundary layer, have never been made.
Climatological studies showed that the western United States is one of the global hotspots for deep stratospheric intrusions, which is likely because of the east Pacific storm track and the high-altitude orography (4, 21). Such deep stratospheric intrusion events compromise high-altitude regions of the western United States in attaining US National Ambient Air Quality Standard (NAAQS) for O3 (6). Additional field-based observation studies indicated that this O3-rich stratospheric air can even be transported to low-altitude regions, such as Los Angeles at the southern California coast (8, 22, 23). Consequently, this region is a natural laboratory for studying the potential of 35S as a tracer for stratospheric intrusions. In October of 2015, the NAAQS for O3 was revised to 70 ppbv (parts per billion by volume) [daily maximum 8-h average (MDA8)] from the previous standard of 75 ppbv by the US Environmental Protection Agency (EPA). This new standard has been effective since December 28, 2015, and hence, identifying and excluding such naturally occurring “exceptional events” become increasingly important (24). The EPA recommends identifying exceptional events with supporting evidence, emphasizing the urgent need to find a new and sensitive stratospheric tracer, such as 35S, to offer an unambiguous diagnostic for stratospheric intrusions. In this study, we measure 35S concentrations during deep stratospheric intrusions to show the sensitivity of 35S to stratospheric air in the boundary layer.
Field-Based 35S Measurements
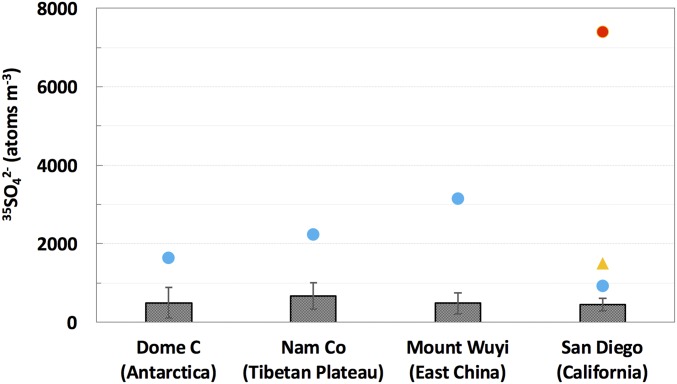
Table 1 summarizes 35S concentrations in size-segregated sulfate aerosol (35SO42−) collected on the rooftop of Pacific Hall on the campus of the University of California, San Diego [32.876° N, 117.242° W; 120 m above sea level (a.s.l.)] in spring of 2014. Most of 35S concentrations agree well with our previous measurements at the Scripps Pier (10 m a.s.l. and 1.7 km from the sampling site in this study) (18), but an unusually high 35SO42− concentration of 7,390 atoms m−3 was found in the fine aerosol sample (with aerodynamic diameter less than 0.95 µm) collected on May 3, 2014, ∼16 times greater than the annual mean of 460 atoms m−3 (18, 25) (Fig. 1). In fact, this value is the highest 35SO42− concentration ever reported for natural aerosol samples in the literature, which may be explained by stratospheric influence. It is noted that comparably high 35S levels were measured in two rainwater samples collected in Korea in spring and winter (200 and 400 mBq L−1, respectively), two seasons with frequent stratospheric intrusions in East Asia (26), which were significantly greater (more than a factor of ∼6) than other rainwater samples (4–60 mBq L−1) (27). Using the 35SO42− scavenging ratio obtained in Japan (28), the atmospheric 35SO42− concentrations in Korea were calculated to be 150–2,200 atoms m−3 in most cases and 7,500 and 15,000 atoms m−3 in two episodes. Although this estimation is subject to large uncertainties (∼60% relative SD) (28), it matches the most recent 35SO42− measurement directly made on aerosol samples collected in East Asia (90–1,130 atoms m−3 in most samples and an increased 35SO42− concentration of 3,150 atoms m−3 in a sample affected by aged stratospheric air from the free troposphere) (20). The aforementioned high rainwater 35S activities (27) were likely affected by stratospheric intrusions but were not considered. In this study, the stratospheric origin of our unusually high 35SO42− concentration directly measured on sulfate aerosol is examined.
Table 1.
35SO42− concentrations in size-segregated aerosol samples collected at the University of California, San Diego in spring of 2014
| Date | Total airflow (m3) | 35SO42− (atoms m−3) | ||
| >7.2 µm | 0.95–7.2 µm | <0.95 µm | ||
| March 27 to April 4 | 11,647 | 12 ± 7 | 33 ± 5 | 90 ± 4 |
| April 6 and 7 | 1,543 | n.d. | n.d. | 170 ± 40 |
| April 12–18 | 9,503 | 15 ± 8 | 77 ± 6 | 230 ± 10 |
| May 3–7 | 7,176 | 4 ± 6 | 75 ± 8 | 7,390 ± 50 |
| May 10–14 | 7,571 | n.d. | 50 ± 10 | 370 ± 20 |
| May 19–23 | 7,727 | 3 ± 7 | 51 ± 7 | 130 ± 10 |
n.d., Not detectable.
Fig. 1.
The 35SO42− concentration in the fine aerosol sample collected on May 3, 2014 (red circle) and the comparison with annual means (gray bars; error bars stand for 1 SD) and the highest values (blue circles) measured at different sampling sites in previous studies (17–20). The orange triangle represents the sample affected by the trans-Pacific transport of 35S produced from the 35Cl[n,p]35S reaction in Fukushima (25).
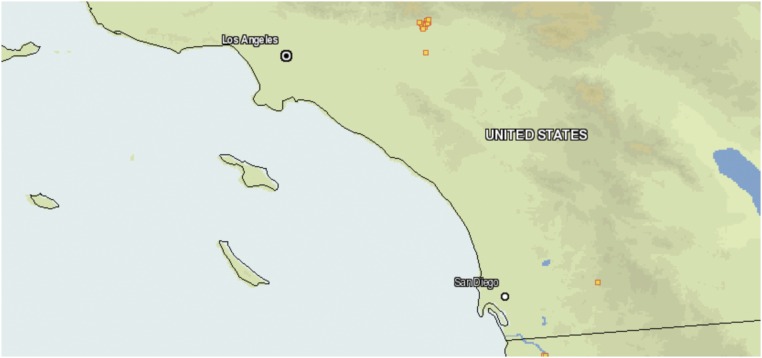
Before discussing the impacts of stratospheric intrusions, other potential factors should be carefully evaluated. Apart from natural cosmogenic production, the 35Cl[n,p]35S reaction between neutrons escaping from Fukushima and 35Cl in the coolant seawater is the only identified anthropogenic source of 35S (25, 28). It is worthwhile to note that core elements reactors do not emit 35S. It is high levels of 35Cl in seawater that react with neutrons and allow 35S productions. Given the highly specific reaction condition, there is no evidence showing that the observed 35SO42− spike in this study is caused by the 35Cl[n,p]35S reaction in the Fukushima or any nuclear plant. In addition, it was proposed that atmospheric 35SO42− removed by precipitation or dry deposition processes might reenter the boundary layer through the atmosphere and land surface interaction (biomass burning or wind-blown terrestrial dust) within ∼66 d and elevate 35SO42− concentrations in the boundary layer (27). Although this hypothesis remains to be proven, we carefully screen out this potential scenario. Large wildfires (>300 acres; defined by the California Department of Forestry and Fire Protection) were not recorded during the sampling period (cdfdata.fire.ca.gov/pub/cdf/images/incidentstatsevents_253.pdf). The absence of large wildfires is also supported by the satellite observations (Fig. S1). Therefore, any significant contribution of 35S from biomass burning is implausible in this study period. The low 35SO42− concentration in coarse particle observed in the same set of aerosol samples (Table 1) also suggests that 35SO42− in resuspended terrestrial soil or dust cannot account for the notable enhancement of 35SO42− in this study. To date, there is no evidence or theory showing that other sources/processes can lead to significant variations or productions of 35S. After considering all potential factors, the impact of air masses from the stratosphere, where the natural cosmogenic production rate of 35S is approximately two orders of magnitude greater than the Earth’s surface (15), is the most likely candidate to explain the elevated 35S concentration.
Fig. S1.
Fire counts observed by the MODIS during the period from April 29 to May 3, 2014 (Santa Ana period), showing the absence of large wildfires.
Exceptional Event of O3 Enrichment
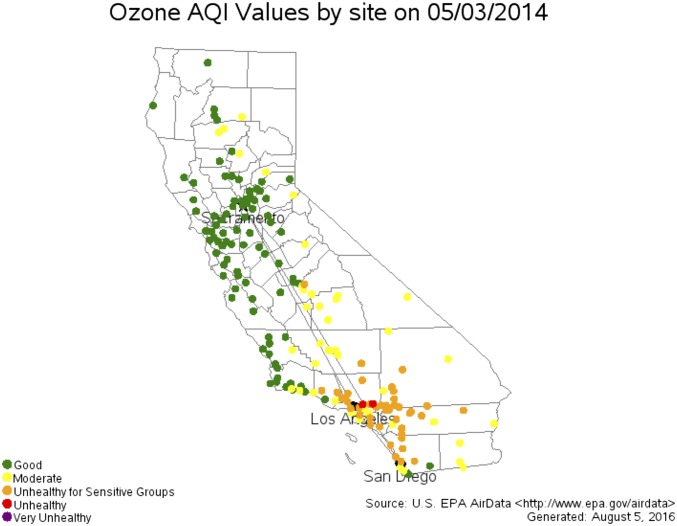
On May 3, 2014, when the 35S-rich aerosol sample was collected, a regional O3 pollution event was observed over southern California (Fig. 2). Two stations in Los Angeles were in the category of “unhealthy” [Air Quality Index (AQI): 151–200 or MDA8: 86–105 ppbv], and 80% of stations in southern California (68 of 85) were in the categories of “unhealthy for sensitive groups” (AQI: 101–150 or MDA8: 71–85 ppbv) or “moderate” (AQI: 51–100 or MDA8: 55–70 ppbv). Although the other 15 stations were in the category of “good” (AQI: 0–50 or MDA8: 0–54 ppbv) on this day, the O3 mixing ratios in 14 stations were still higher than annual means, and five of them were significantly greater (>80th percentile) than normal days. The relatively low O3 mixing ratios (compared with other stations) are because of substantial NO emissions from vehicles in surrounding areas that lower ambient O3 mixing ratios via the “titration effect” (NO + O3 → NO2 + O2) (29). For example, the MDA8 of 54 ppbv in the Otay Mesa station (located at the United States–Mexico border and affected by the busy crossing of heavy-duty trucks) on May 3, 2014 was the annual highest value.
Fig. 2.
Distribution of ozone AQI and levels of health concern in California recorded by the US EPA on May 3, 2014 (www3.epa.gov/airdata).
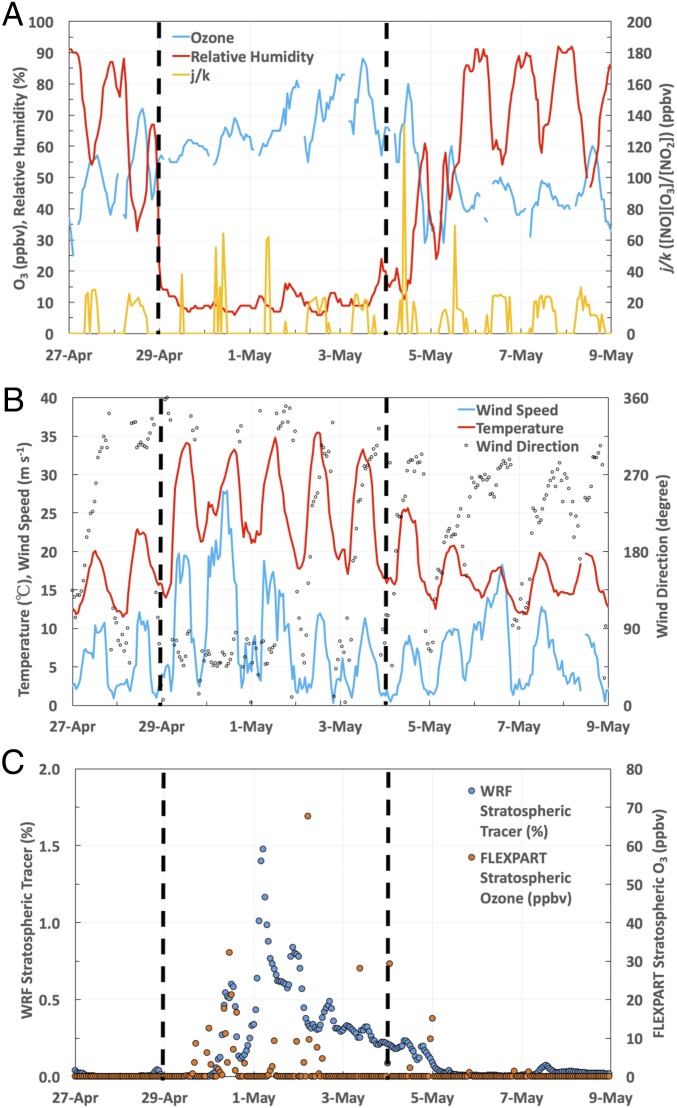
Fig. 3 A and B shows the time series of relative humidity (RH), temperature, and wind speed recorded in San Diego from April 27 to May 8, 2014. RH dramatically dropped down from 67% at 2100 hours Pacific Standard Time (PST) on April 28 to 7% at 1500 hours PST on April 29 accompanied with enhanced temperature (∼30 °C) and wind speed (>15 m/s). The wind speed reached a maximum of 28 m s−1 on April 30, with wind direction shift from variable to northwesterly (Fig. 3B). These abnormal meteorological conditions are typical signatures of Santa Ana winds, which are highly dry, hot, and strong winds that descend from inland desert regions to the Pacific coastal region in southern California (18, 22, 30–32). These foehn-like katabatic winds result from a strong pressure gradient between a high pressure over the Great Basin and an offshore low pressure. The high pressure can compress sinked air, force the air temperature to rise, and reduce its RH. Although the wind speed returned back to normal on May 2, 2014, low RH and high temperature persisted until May 4, suggesting that the Santa Ana wind event lasted for 5 d (April 29 to May 3, 2014).
Fig. 3.
Time series of hourly (A) O3, RH, and j/k measured in San Diego (the Alpine monitoring station); (B) temperature, wind speed, and direction measured in San Diego (the Kearny Mesa station); and (C) the simulated WRF stratospheric tracer and FLEXPART stratospheric O3 at the boundary layer in San Diego. The vertical black dashed lines define the period of the Santa Ana event (April 29 to May 3, 2014) based on abnormal RH and temperature.
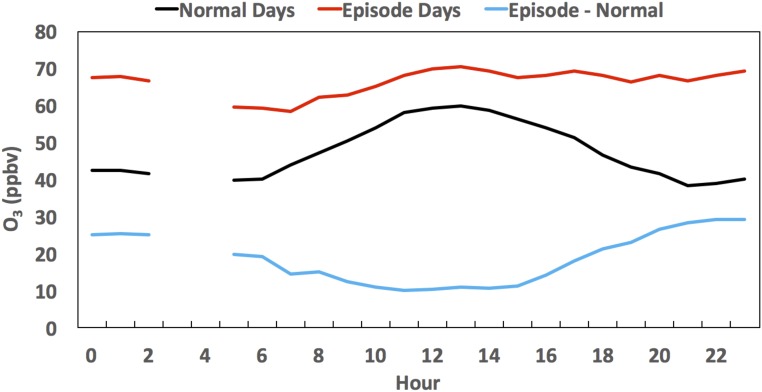
Santa Ana wind events are often behind a cold front associated with an upper-level trough (31), which cannot only exacerbate the katabatic winds but also, can lead to the formation of deep tropopause folds and stratospheric intrusions (22). A recent study suggested that the coupling between Santa Ana winds and stratospheric intrusions might pose serious O3 pollution threats across the coast of southern California (22). In this study, ground-level O3 mixing ratios during the Santa Ana event increased significantly (Fig. 3A). The annual highest MDA8 in the Alpine station in San Diego (81 ppbv) was recorded on May 3, with a maximum 1-h O3 mixing ratio of 88 ppbv at 1200 hours PST. Solar radiation and temperature were stronger during the Santa Ana episodes, but the ratio of NO2 photolysis to NO + O3 reaction rates (j/k = [NO][O3]/[NO2], with the photostationary state assumption) (33) showed only slight enhancement from April 29 to May 1, suggesting that photochemical production of O3 in the O3–NO–NO2 cycle was not a major factor leading to the elevated O3 levels during the entire Santa Ana period. Although wildfires occur commonly during Santa Ana wind events, which can significantly increase ground-level O3 mixing ratios (22, 30), no significant wildfire occurred in our study period (Fig. S1), suggesting that emissions from wildfires were also not a major contributor. A closer look into the O3 diurnal variations reveals significant enhancements of nighttime O3 mixing ratios during the Santa Ana period, which were 20–29 ppbv greater than on normal days (Fig. S2). Because photochemical O3 production ceases at nighttime, this result suggests a larger contribution of long-range transports (including stratospheric intrusions) to the enhanced O3 mixing ratios in the Santa Ana period. A negative correlation between O3 and CO (a tracer of anthropogenic emission) may suggest O3 originating from the stratosphere, where CO is depleted and O3 is rich (34, 35). To rule out the potential impact of nighttime titration effect, which can also lead to negative O3–CO correlation (36, 37), only daytime data (0700–1800 hours) were considered in this study. A significant negative correlation between O3 and CO in the Santa Ana event (r = −0.60, confidence level > 99.9%) compared with normal days (r = −0.04, confidence level = 40.9%) implies that the elevated O3 levels during the Santa Ana event were likely related to the vertical transport of O3 from high altitudes.
Fig. S2.
Diurnal patterns of O3 mixing ratios on normal days (April 27 and 28 and May 4–9, 2014; black), episode days (April 29 to May 3, 2014; red), and their differences (blue).
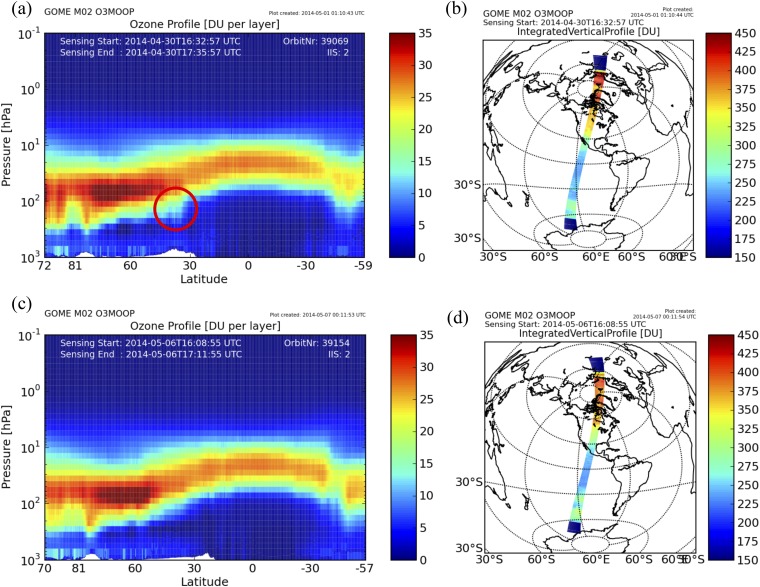
In summary, the concurrently enhanced ground-level 35SO42− and O3 concentrations and negative O3–CO correlation indicate that the O3 episode on May 3, 2014 was likely affected by a deep stratospheric intrusion event, a naturally occurring exceptional event. Because most Santa Ana winds only entrain air masses from the free troposphere to the boundary layer and would not lead to a significant enhancement of ground-level O3 mixing ratios (18, 30), a stratospheric intrusion event that transports O3-rich stratospheric air to the free troposphere before or during the Santa Ana event is required to result in the observed ground-level 35SO42− and O3 concentrations. The vertical ozone profile retrieved from Global Ozone Monitoring Experiment-2 satellite observation on April 30, 2014 revealed significant enhancements of the tropopause O3 levels and total O3 columns at the upstream region of southern California during the Santa Ana event, indicating stratospheric air masses mixing into the troposphere (Fig. S3). Under the influences of Santa Ana winds, such O3-rich stratospheric air may be transported downward to the boundary layer and westerly to coastal southern California.
Fig. S3.
(A) The GOME-2 vertical ozone profiles and (B) the location of the GOME-2 orbit on April 30, 2014. (C and D) The same as in A and B but on May 6, 2014. The red circle in A highlights the enhanced O3 levels induced by stratospheric intrusions. DU, Dobson unit.
Meteorological Model Analysis
To quantitatively estimate the probability that air masses sampled in this Santa Ana wind event partly originate from the stratosphere, an inert stratospheric tracer was simulated by a mesoscale meteorology model [Weather Research and Forecasting Model (WRF)] (20). The time series of the WRF-simulated stratospheric tracer at the boundary layer show a small peak (0.6%) at 1200 hours PST on April 30, 2014, 1 d after the onset of the Santa Ana wind event, and the highest peak (1.5%) at 0500 hours PST on May 1, 2014 (Fig. 3C). The WRF-simulated stratospheric tracer gradually decreased from the highest peak to baseline (∼0%) from May 1 to 5, 2014 (Fig. 3C). Stratospheric O3 mixing ratios at the boundary layer simulated by an independent Lagrangian particle dispersion model [FLEXible PARTicle dispersion model (FLEXPART); driven by the WRF output] (19) show a consistent trend (Fig. 3C), further supporting the stratospheric origins of 35S and O3.
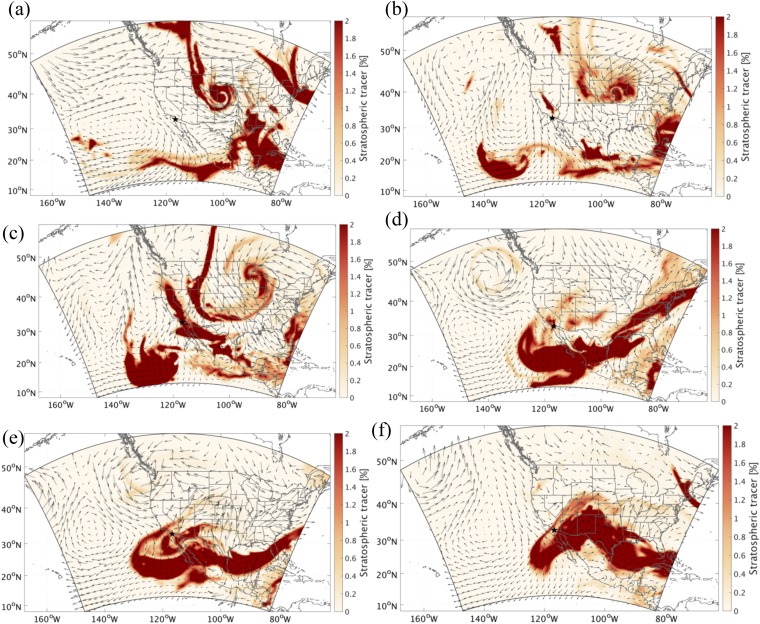
The process of how this plume intruded to the troposphere and reached coastal southern California is investigated by the horizontal distributions of the WRF-simulated stratospheric tracers and weather systems at various altitudes. As clearly shown in Fig. 4A, the stratospheric intrusion episode leading to the elevation of the WRF-simulated stratospheric tracer was directly triggered by a cutoff low-pressure system, which is accompanied by strong convective motions and tropopause folding and a typical synoptic condition resulting in active stratosphere to troposphere exchange over western United States (10, 22). The development of this synoptic situation is shown in Fig. S4. At the beginning, a strong midlevel short-wave trough developed into a closed low-pressure area as the system occluded over the central high plains since April 27, 2014. An associated mid- to low-level cyclone then reached its peak intensity while a trailing cold front move eastward across eastern Kansas, eastern Oklahoma, and northern Texas on April 29, 2014. Meanwhile, the strong northeasterly flow on the southwest flank of the cyclone swept through southwestern United States and caused a significant late season Santa Ana event. Later on, the low-pressure system started to abate, stretched southward from Canada to New Mexico and from northern California to the Gulf of Mexico on April 30, and eventually, dissipated after May 2, 2014.
Fig. 4.
Spatial distribution of the WRF stratospheric tracer at (A) 500 hPa at 0000 hours PST on April 30 and (B) 390 m above ground level at 0500 hours PST on May 1. The black star indicates the location of San Diego.
Fig. S4.
Spatial distribution of the WRF stratospheric tracer at 500 hPa at (A) 1200 hours PST on April 27, (B) 0000 hours PST on April 29, (C) 0000 hours PST on April 30, (D) 1600 hours PST on May 2, (E) 0000 hours PST on May 4, and (F) 1400 hours PST on May 5 (all 2014). The black stars indicate the location of San Diego.
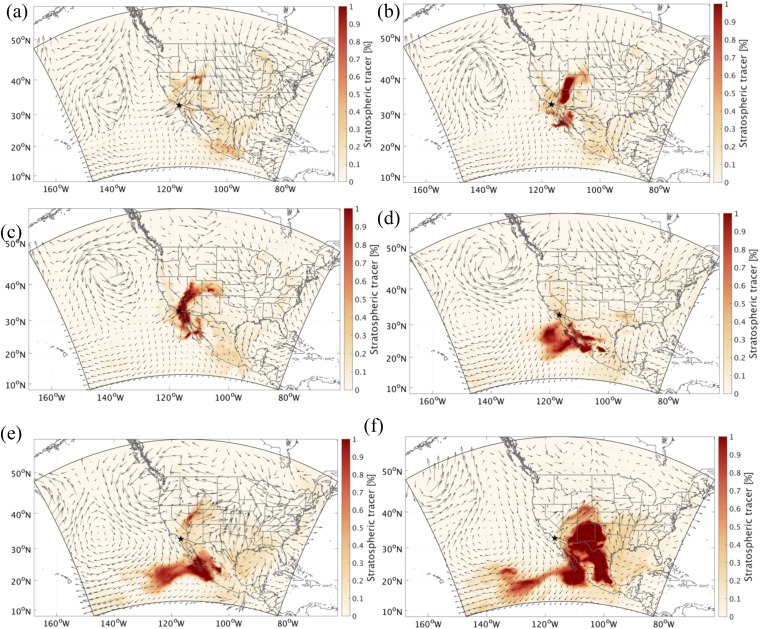
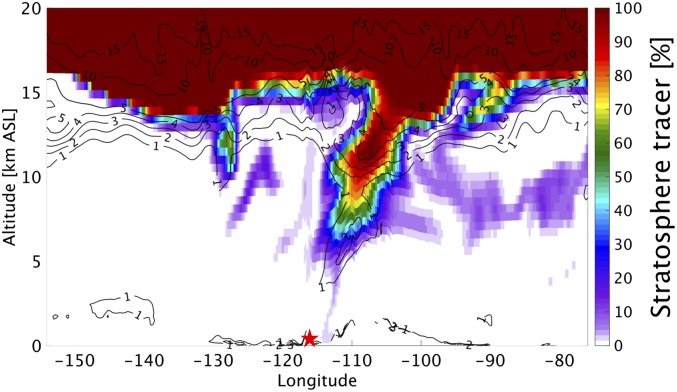
Exchange processes between the free troposphere and the boundary layer are vital to bring 35S- and O3-rich stratospheric air to the sampling site. Fig. 4B shows that the impacts of stratospheric air on the boundary layer were mostly confined in the regions affected by the Santa Ana wind. Stratospheric air masses in the free troposphere started to penetrate into the boundary layer in Utah at 1000 hours PST on April 30, 2014 behind the trough line and were subsequently transported to southern California via the northeast Santa Ana wind on May 1 (Fig. S5). Zonal cross-sections of potential vorticity (PV) and the WRF-simulated stratospheric tracer clearly show the distinctive tropopause folding associated with the cutoff low between ∼105° W and ∼115° W and a tongue of stratospheric air sloping downward at ∼115° W (Fig. 5), highlighting the pathway of the stratospheric air into the boundary layer. The MDA8 O3 mixing ratios recorded in Las Vegas (35.786° N, 115.357° W; 924 m a.s.l.), the upstream region of southern California, were 59, 69, and 56 ppbv on April 30, May 1, and May 2, 2014, respectively (airquality.clarkcountynv.gov/cgi-bin/aqi_map.pl). The increases of MDA8 on May 1 in part support our model results. Because the stratospheric air masses were continuously entrained into the free troposphere by the occluded low-pressure system, these southwestward-transported air masses might slope downward to the boundary layer in southern California as well (SI Text and Fig. S4).
Fig. S5.
Spatial distribution of the WRF stratospheric tracer at 390 m above ground level at (A) 1000 hours PST on April 30, (B) 0000 hours PST on May 1, (C) 0500 hours PST on May 1, (D) 1600 hours PST on May 2, (E) 0000 hours PST on May 4, and (F) 1400 hours PST on May 5 (all 2014). The black stars indicate the location of San Diego.
Fig. 5.
Zonal cross-section of the WRF stratospheric tracer with PV (unit: PV unit) contours superimposed at 0000 hours PST on May 1, 2014. The red star indicates the location of San Diego.
35S Box Model Calculation
Priyadarshi et al. (18) used a 1D four-box model, which was developed to calculate the 35SO42− concentration in fine aerosol collected at the Scripps Pier, to quantify air mixing during the Santa Ana wind events and shallow stratosphere–troposphere exchange events. The model parameters (Table S1) and uncertainties were thoroughly described in refs. 18 and 25. Specifically, it was suggested that, in a shallow stratosphere–troposphere exchange event, ∼7% of the total air masses in the free troposphere were originated in the low stratosphere per day, whereas during the Santa Ana wind event, ∼41% of air mass sampled in the marine boundary layer recently originated from the free troposphere per day (18). Here, we use the same box model and combine the mixing effects of stratospheric intrusions and Santa Ana winds (i.e., 7% × 41% = ∼3% of total air sampled in the boundary layer originated from the stratosphere in 1 d) to simulate the coupling between Santa Ana winds and stratospheric intrusions in this study. The averaged 35SO42− concentration during May 3–7, 2014 calculated by the model was 7,100 atoms m−3, reasonably agreeing with our measurement (7,390 atoms m−3). The model predicts that the averaged 35SO2 and 35SO42− concentrations during the episode period (April 29 to May 3) were 2,100 and 11,000 atoms m−3, respectively, which however, cannot be verified in this stage, because samples were not collected from April 29 to May 2, 2014 because of operational issues. To date, the highest 35SO2 concentration (1,800 atoms m−3) was measured at New Haven by Tanaka and Turekian (38) in April of 1992. The highest atmospheric 35SO42− concentration was estimated to be 15,000 atoms m−3 from rainwater samples as discussed previously (27). These field-based measurements suggest that our model-estimated 35S concentrations during deep stratospheric intrusions are plausible. If only the mixing of stratospheric intrusion (or the Santa Ana wind) was considered, the estimated averaged 35SO42− concentration during May 3–7, 2014 was 3,400 (or 742) atoms m−3, significantly lower than our field-based data and previous calculations, implying that the coupling between stratospheric intrusions and Santa Ana winds is crucial to lead to the observed high 35S and probably, O3 levels.
Table S1.
Parameters of the 35S box model for calculating 35SO42− in San Diego, California
| Parameter | Value |
| Height, km | |
| Planetary boundary layer (box 1) | 0.6 |
| Buffer layer (box 2) | 1.0 |
| Free troposphere (box 3) | 8.0 |
| Lower stratosphere (box 4) | 16.0 |
| Cosmic ray production rate of 35S (atoms cm−3 d−1) | |
| P1 | 2.8 × 10⁻⁶ |
| P2 | 2.8 × 10⁻⁶ |
| P3 | 6.5 × 10⁻⁵ |
| P4 | 1.1 × 10⁻⁴ |
| 35SO2 lifetime (d) | |
| τox−1 = τox−2 | 4 (8)* |
| τox−3 = τox−4 | 8 |
| τd | 1.5 |
| τc1 = τc2 | 5 (∞)* |
| τc3 = τc4 | 143 |
| τλ | 126 |
| 35SO42− removal lifetime (d) | |
| τr1 = τr2 | 12 (3)* |
| τr3 | 24 |
| τr4 | 365 |
| Air mass mixing time (d) | |
| τ12 = τ21 | 1 (τ12 = ∞)* |
| τ23 = τ32 | 14 (τ12 = ∞)* |
| τ34 = τ43 | 290 |
| τH | 30 |
| τHS | 1 |
Previous studies suspected that the mixing between O3-rich stratospheric air masses and polluted plumes might accelerate the oxidation of SO2 (20). In this study, significant enhancements of j/k are observed during the post-Santa Ana period (May 4 and 5) (Fig. 3A), indicating stronger photochemical production of O3. This phenomenon may be because the downward-transported stratospheric O3 actively participated in the O3–NOx–VOCs chemistry (39, 40) when the O3-rich air masses were mixed with polluted low-altitude air masses (41). The decreased O3 mixing ratio (Fig. 3A) suggested that the photochemically produced O3 might rapidly participate in other reactions (e.g., the formation of secondary aerosols, including heterogeneous productions of sulfate) as a sink. If the oxidation lifetime of SO2 in the boundary layer during the post-Santa Ana period (May 4 and 5) is reduced from 4 to 0.5 d, an averaged 35SO42− concentration during May 3–7 of 7,400 atoms m−3 is obtained, perfectly matching the observational data (7,390 atoms m−3). Although this hypothesis has yet to be tested by high-temporal resolution 35SO2/35SO42− measurement and proper chemistry modeling, the suspected enhanced aerosol formation rate is partly supported by higher PM2.5 (particulate matter with an aerodynamic diameter less than 2.5 μm) concentrations (mean ± σ) during the post-Santa Ana period (10.8 ± 3.3 µg m−3) than the Santa Ana period (6.3 ± 2.4 µg m−3; 2014 annual mean: 8.1 ± 3.6 µg m−3). This potential influence is particularly important in the regions heavily impacted by SO2 emissions and stratospheric intrusions, such as East Asia (3, 20, 41, 42).
Conclusions and Implications
In summary, our result is encouraging, because it shows the high sensitivity of 35S to stratospheric intrusions and reveals the crucial role of coupling between Santa Ana wind and stratospheric intrusions in bringing fresh stratospheric air to the southern California coast. The absolute amount of radiation (or activity) in the 35S-rich sample is small (0.68 mBq m−3) and not a concern for human health, but our highly sensitive measurement technique renders 35S a sensitive tracer of stratospheric intrusions, an important process in nature for which there are gaps in understanding.
There is an urgent need to identify and screen the exceptional events for ground-level O3 caused by stratospheric intrusions. Our study reveals that field-based measurement of cosmogenic 35S at ground level can serve as an additional valuable diagnostic for the occurrence of deep stratospheric intrusions. This method has three advantages. (i) The optimized aerosol sample handling procedures and low-level liquid scintillation spectroscopy method enable measuring low 35S activities (0.2 disintegration per minute) in a simple, economical, effective, and highly sensitive way (16). (ii) The half-life of 35S (87 d) is ideal for studying atmospheric processes on synoptic timescales, and it also permits a relatively long storage time of aerosol samples, which are routinely collected by the EPA, until the sampling period is suspected. (iii) Radiogenic 35S has the potential to provide additional information on the impacts of stratospheric intrusions on gas to particle conversion rates and thereafter, possible particulate matter pollution events.
Although this box model shows the ability to reproduce the observed 35SO42− concentration, we should mention that the box model result still possesses uncertainties, because most parameters in the model are not constrained by field-based measurements (18). The low temporal resolution of 35S measurements in this study limits the use of field-based 35S measurement in evaluating the model result and improving the model. In the future, a more strategic and comprehensive study can be designed to fully resolve the impacts of deep stratospheric intrusions on the tropospheric sulfur cycle and ground-level O3 concentrations. The Realtime Air Quality Modeling System (RAQMS) model has been widely used in predicting and analyzing the stratospheric intrusion events (22, 23, 43). Although the RAQMS model underestimated the ground-level O3 concentration in this episode (May 3, 2014), it showed capability to forecast the east Pacific storm track and stratospheric O3 intrusions in the higher atmosphere (raqms-ops.ssec.wisc.edu/previous_products/). The forecast result of the RAQMS can be used to design intensive aerosol and SO2 sampling for 35S measurements ∼2 d before the occurrences of stratospheric intrusion events. With high temporal resolution (0.5–1 d), the evolution of 35S during deep stratospheric intrusions can be resolved.
Aircraft field missions showed that concentrations of cosmogenic beryllium isotopes (7Be and 10Be; half-life = 53 d and 1.38 My, respectively) in the lower stratosphere can be ∼40–110 times greater than in the boundary layer (44, 45). Similar measurements for 35S are crucial to constrain box model results. More efforts on modeling works (e.g., updating 35S production rate and incorporating 35S into a 3D chemistry transport model with O3 and sulfur chemistry) can advance quantifying the impacts of stratospheric intrusions on ground-level 35S and O3 at high temporal and spatial resolutions. The extent to which stratospheric intrusions may affect the gas to particle conversion rate can also be quantified by coupled measurements of 7Be and 35S and proper modeling (38).
Climatological studies revealed that the western United States and the Himalayas are two global hotspots for deep stratospheric intrusions (4). In particular, a global chemistry–climate model showed strong contributions of stratospheric intrusions to MDA8 ground-level O3 in Nevada (6, 7, 10). Our previous measurements showed high 35S concentrations in the San Fernando Valley in California (a sampling site close to Nevada) (16) and at Mount Everest in the Himalayas (19), supporting the model results. These measurements imply that the spatial distribution of 35S may provide invaluable information on regional variabilities of stratospheric intrusion strength and frequency to constrain model results. The high sensitivity of 35S also allows for precise quantification of the contribution of aged stratospheric air to the background troposphere, which is crucial in understanding the O3 budget (3, 7), the carbon cycle (46, 47), and the variations of other cosmogenic radionuclides, such as 10Be, a primary proxy archive of past changes in solar activity, cosmic rays, and geomagnetic field intensity (45).
Materials and Methods
Size-segregated aerosol samples were collected using a high volume air sampler (HVP-4300AFC; Hi-Q) operated at a flow rate of ∼1.13 m3 min−1. Soluble sulfate extracted from glass-fiber filter papers was subject to 35S analysis using an ultralow-level liquid scintillation counting spectrometer (Wallac 1220 Quantulus) technique (16). Data on air pollutants (O3, NO2, NO, CO, and PM2.5) and meteorological variables (temperature, RH, solar radiation, wind speed, and direction) were provided by the Air Pollution Control District County of San Diego (www.sdapcd.org). Field-based measurements were supported by a mesoscale meteorology model (the WRF), which permitted investigations of stratospheric intrusion processes (20). Detailed sampling, chemical processing, quality assurance, and control procedures as well as modeling approach can be found in SI Text and Figs. S6 and S7.
Fig. S6.
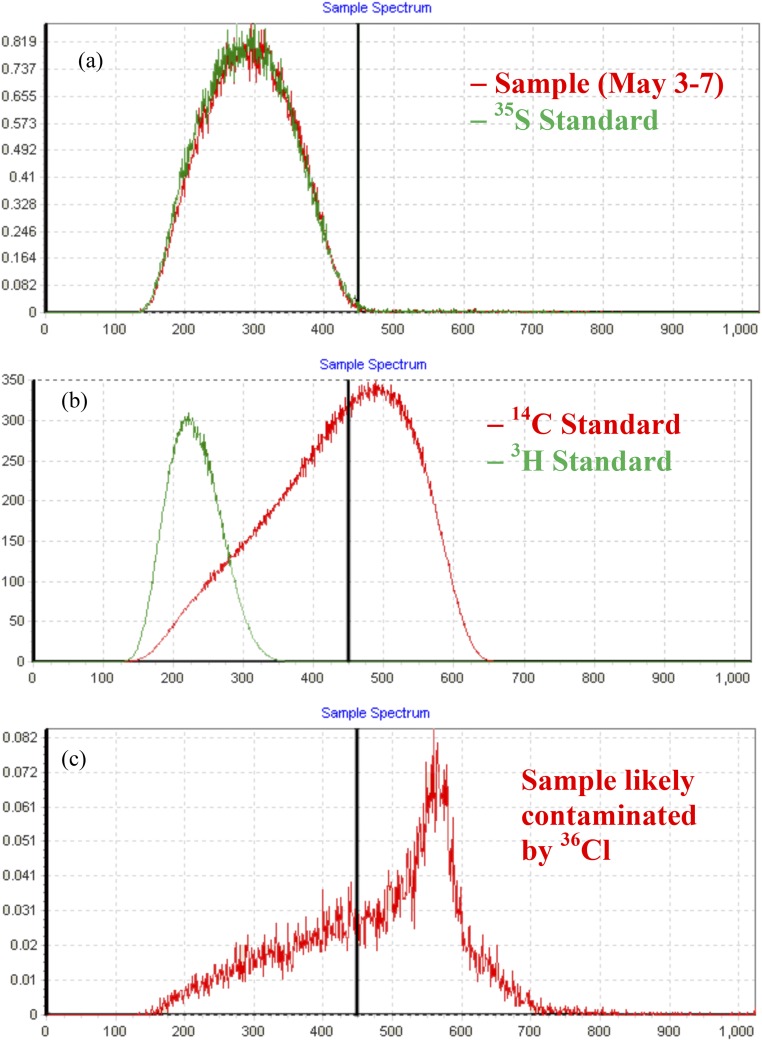
Energy spectrums of (A) the aerosol sample collected during May 3–7, 2014 and 35S standard with comparable activity, (B) 14C and 3H standards, and (C) an aerosol sample (not reported in this study) likely contaminated by 36Cl because of the incomplete removal of chlorine.
Fig. S7.
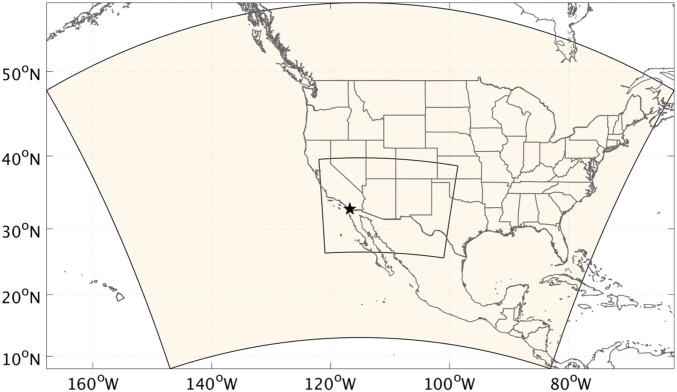
The domain setting for the WRF simulation. The black star indicates the location of San Diego.
SI Text
Aerosol Sampling, 35S Measurements, Quality Assurance, and Control.
The high volume air sampler (HVP-4300AFC; Hi-Q) was equipped with a cascade impactor (TE-234; Tisch), and glass-fiber filters (slotted; Tisch; 8 × 10-in backup; Whatman) were used as filtration substrates to collect airborne particulate matters with aerodynamic diameters larger than 7.2 µm, between 7.2 and 0.95 µm, and less than 0.95 µm. Each set of samples was collected continuously for 23–172 h. The time gap between sets of samples varies from 2 to 15 d because of operational issues. A static field blank was created by loading fresh filters on the sampler for 5–10 min without turning on the pump.
Soluble sulfate extracted from filter papers was converted to aqueous Na2SO4 solution and mixed with Insta Gel Plus mixture in a scintillation vial to determine 35S radionuclide concentrations using an ultralow-level liquid scintillation counting spectrometer (Wallac 1220 Quantulus) technique (16). To improve the ratio of signal to noise, organic contaminants and chlorine salts were removed by a polyvinylpyrrolidone resin and a Dionex Ag Cartridge (OnGuard II), respectively. Each sample was counted six times (2-h counting for each cycle). Averages and SDs are reported. To determine the background activity, the static field blank was subjected to the same chemical analysis procedure. The raw 35S counting data were corrected for the background activity and the decay time. Given the low activity of 35S in natural aerosol samples, the measured 35S activity [unit: disintegration per minute (dpm)] was reported as the 35SO42− concentration (unit: atoms meter−3) following previous studies (16–20, 28). The 35SO42− concentration was determined using the relationship [35SO42−] = (dpm × t1/2/ln(2))/Vair, where dpm, t1/2, and Vair represent the total activity of 35S in the unit of dpm, the radioactive decay half-life of 35S in the unit of minutes, and total airflow in the unit of cubic meters in each sample, respectively.
Given the huge deviation of 35S activity in the sample collected during May 3–7, 2014 from the background activity, additional quality assurance and quality control (QA/QC) were conducted. The energy spectra of the sample were checked and compared with 35SO42− standard, showing that the signal was clean and that the measured high activity was unlikely contaminated by other radionuclides (e.g.,3H, 14C, or 36Cl) (Fig. S6). Standard and blank were counted right after the counting of this sample and compared with previous measured results. The differences were within measurement error, and no significant drift was observed. The sample was recounted 1 mo after the first measurement and recounted again after the naturally present 35S had fully decayed, which further supported that the measured activity was the decay event of 35S rather than the interference from other radionuclides. The database from the Radiation Division of the Environment, Health and Safety Department at the University of California, San Diego showed no 35S use or inventory at the sampling building (Pacific Hall) during this period, suggesting that the sample was not contaminated during collection. Cross-contamination in chemical processing is highly unlikely, because the 35S activity of our laboratory standard, which was stored separately in another room, was only ∼1/4 of measured activity in this sample. In summary, these procedures allowed us to assure that the measured activity was not an experimental artifact, and there was no experimental reason or scientific evidence showing that we should exclude this data point from the dataset.
Air Pollutants and Meteorological Data.
The Air Pollution Control District County of San Diego (SDAPCD) monitoring network follows the guidelines of the US EPA, and all data provided have been subject to the strict QA/QC procedure required by the US EPA (SDAPCD Ambient Air Quality Monitoring Quality Management Plan; available at https://www.arb.ca.gov/aaqm/mldaqsb/amn.htm). The Alpine station (32.836° N, 116.777° W; 516 m a.s.l), the easternmost station in San Diego County, was selected, because it is the O3 design value site. On most days, this station monitors the air downwind of San Diego County’s major metropolitan areas, whereas on the Santa Ana days, it is located at the upwind region, monitoring the air entrained to San Diego County. Compared with other stations in San Diego County, this station is less influenced by the titration effect (NO + O3 → NO2 + O2), which lowers ambient O3 concentrations in an urban environment by means of substantial NO emissions and NOx scavenging (29).
Satellite Observations.
Wildfire events over southern California during the sampling period were detected by the Moderate-Resolution Imaging Spectroradiometer (MODIS) mounted on the National Aeronautics and Space Administration (NASA) Terra and Aqua Satellite. The spatial resolution is 1 × 1 km2, and the dataset was obtained from NASA’s website (earthdata.nasa.gov/data/near-real-time-data/firms). The vertical O3 profiles obtained from the Global Ozone Monitoring Experiment-2 (GOME-2) instrument were used to study the structure of the upper troposphere. The data and imageries are provided by the Royal Netherlands Meteorological Institute in the framework of the European Organization for the Exploitation of Meteorological Satellites’ Satellite Application Facility on Ozone and Atmospheric Chemistry Monitoring and available from the Tropospheric Emission Monitoring Internet Service website (www.temis.nl/profiles/).
Mesoscale Meteorological Simulation and Additional Discussion.
The evolution of stratospheric air masses in the atmosphere during the study period was simulated and quantified by the Weather Research and Forecast Model coupled with Chemistry module (WRF-Chem) (ruc.noaa.gov/wrf/WG11/wrf_tutorial_2011/WRFchem_Users_Guide_v33_18july2011.pdf). The WRF-Chem is an advanced atmospheric modeling system with the capability of simulating complicated dynamical, physical, and chemical processes in the atmosphere. In this study, the chemistry module was activated only to provide the initial condition of a stratospheric tracer, which was treated as an inert gas without reacting with other species. Therefore, only advection, convection, and turbulence diffusion during the tracer transport were considered in the simulation. The Final (FNL) reanalysis data from the National Center of Environmental Prediction were used to provide the initial and boundary meteorological conditions for the simulation, with the fraction of stratospheric air mass above the tropopause being initialized as 100% at the beginning. The domain setting for the simulation is shown in Fig. S7. The horizontal resolutions of the outer and inner domains are 27 and 9 km, respectively, both with 50 vertical layers and the top layer at 50 hPa. The simulation was started on April 19, 2014—8 d ahead of the investigated period—and lasted for 20 d until May 8, 2014. The 8 d ahead of the investigated period were considered as the spin-up time for the simulation to allow the stratospheric tracer to accumulate in the troposphere to a reasonable level comparable with realistic conditions at the beginning of the investigated period. The simulation was conducted for the investigated period continuously without reinitialization, enabling stratospheric air masses to accumulate and transport in the troposphere (20). To prevent the simulations from drifting away from the realistic conditions, 4D data assimilation was conducted every 6 h using temperature, wind, and humidity fields from the FNL reanalysis data.
A relatively simple (compared with chemical transport models) but quantitative Lagrangian particle dispersion model (48) was used to quantify the contribution of stratospheric O3. Specifically, the FLEXPART-WRF, version 3.2 driven by the WRF output data was used, with horizontal resolution of 0.1° and 50 vertical layers from the surface to 9,000 m above ground level. Whether a particle is stratospheric is determined using the dynamical definition of the tropopause based on a threshold value for PV of 2.0 PVU (PV unit). In the calculation, stratospheric particles were assigned a mass according to the equation MO3 = Mair × PV × C × 48/29, where C = 60 × 10−9 PVU−1 is the average ratio between the O3 mixing ratio and PV in the lower stratosphere in spring based on the ozonesonde data, and factor 48/29 converts from a volume to mass mixing ratio (13). A detailed description of the FLEXPART stratospheric O3 tracer modeling is given by Cooper et al. (13).
The process of how the stratospheric air masses intruded to the troposphere and reached coastal southern California during the Santa Ana event is discussed in the text. In addition, it is noted that the stratospheric air masses were piled up in the free troposphere above the Pacific Ocean near Baja California by the convergent wind flow behind the trough line during May 2–4, 2014 (Fig. S4), which descended to the boundary layer slowly. This aged stratospheric air was transported to Arizona and New Mexico by strong southwestern flow and penetrated downward dramatically on May 5, 2014 (Fig. S5). Although in situ ground-level O3 measurement show minimal influences in the San Diego region on May 5, 2014 (Fig. 3A), such synoptic situation may contribute in part to the observed high 35SO42− concentration during May 3–7 2014, because 35SO42− is able to detect aged stratospheric air, whereas the stratospheric signature in O3 is erased rapidly by tropospheric processes (18–20). However, because of the low temporal resolution of 35S measurement in this study, it is difficult to verify this hypothesis.
Acknowledgments
We thank Dr. J. Hill-Falkenthal for helpful discussion on 35S data and T. Jackson and R. Thomas for helping in sampler setups. Two anonymous reviewers are acknowledged for their valuable comments that helped to improve the manuscript. This study was supported, in part, by National Science Foundation Atmospheric Chemistry Division Grant AGS1259305 (to R.S. and M.H.T.). M.L. acknowledges Guangzhou Elite Project Fellowship JY201303.
Footnotes
The authors declare no conflict of interest.
This article is a PNAS Direct Submission.
This article contains supporting information online at www.pnas.org/lookup/suppl/doi:10.1073/pnas.1609919113/-/DCSupplemental.
References
- 1.McGrath JM, et al. An analysis of ozone damage to historical maize and soybean yields in the United States. Proc Natl Acad Sci USA. 2015;112(46):14390–14395. doi: 10.1073/pnas.1509777112. [DOI] [PMC free article] [PubMed] [Google Scholar]
- 2.Arneth A, et al. Terrestrial biogeochemical feedbacks in the climate system. Nat Geosci. 2010;3(8):525–532. [Google Scholar]
- 3.Verstraeten WW, et al. Rapid increases in tropospheric ozone production and export from China. Nat Geosci. 2015;8(9):690–695. [Google Scholar]
- 4.Skerlak B, Sprenger M, Wernli H. A global climatology of stratosphere-troposphere exchange using the ERA-Interim data set from 1979 to 2011. Atmos Chem Phys. 2014;14(2):913–937. [Google Scholar]
- 5.Huang J, et al. Origin of springtime ozone enhancements in the lower troposphere over Beijing: In situ measurements and model analysis. Atmos Chem Phys. 2015;15(9):5161–5179. [Google Scholar]
- 6.Lin MY, et al. Springtime high surface ozone events over the western United States: Quantifying the role of stratospheric intrusions. J Geophys Res Atmos. 2012;117(D21):D00V22. [Google Scholar]
- 7.Lin M, et al. Climate variability modulates western US ozone air quality in spring via deep stratospheric intrusions. Nat Commun. 2015;6:7105. doi: 10.1038/ncomms8105. [DOI] [PMC free article] [PubMed] [Google Scholar]
- 8.Langford AO, et al. Stratospheric influence on surface ozone in the Los Angeles area during late spring and early summer of 2010. J Geophys Res Atmos. 2012;117(D21):D00V06. [Google Scholar]
- 9.Stohl A, et al. Stratosphere-troposphere exchange: A review, and what we have learned from STACCATO. J Geophys Res Atmos. 2003;108(D12):D00V06. [Google Scholar]
- 10.Langford AO, et al. An overview of the 2013 Las Vegas Ozone Study (LVOS): Impact of stratospheric intrusions and long-range transport on surface air quality. Atmos Environ. 2015;109:305–322. [Google Scholar]
- 11.Cristofanelli P, et al. Tropospheric ozone variations at the Nepal Climate Observatory-Pyramid (Himalayas, 5079 m a.s.l.) and influence of deep stratospheric intrusion events. Atmos Chem Phys. 2010;10(14):6537–6549. [Google Scholar]
- 12.Kuang S, et al. Stratosphere-to-troposphere transport revealed by ground-based lidar and ozonesonde at a midlatitude site. J Geophys Res Atmos. 2012;117(D18):D18305. [Google Scholar]
- 13.Cooper OR, et al. Direct transport of midlatitude stratospheric ozone into the lower troposphere and marine boundary layer of the tropical Pacific Ocean. J Geophys Res Atmos. 2005;110(D23):D23310. [Google Scholar]
- 14.Chan CY, et al. Vertical profile and origin of wintertime tropospheric ozone over China during the PEACE-A period. J Geophys Res Atmos. 2004;109(D23):D23S06. [Google Scholar]
- 15.Lal D, Peters B. Cosmic ray produced radioactivity on the earth. In: Sitte K, editor. Kosmische Strahlung II/Cosmic Rays II. Springer; Berlin: 1967. pp. 551–612. [Google Scholar]
- 16.Brothers LA, et al. Optimized low-level liquid scintillation spectroscopy of 35S for atmospheric and biogeochemical chemistry applications. Proc Natl Acad Sci USA. 2010;107(12):5311–5316. doi: 10.1073/pnas.0901168107. [DOI] [PMC free article] [PubMed] [Google Scholar]
- 17.Priyadarshi A, Dominguez G, Savarino J, Thiemens M. Cosmogenic S-35: A unique tracer to Antarctic atmospheric chemistry and the polar vortex. Geophys Res Lett. 2011;38(13):L13808. [Google Scholar]
- 18.Priyadarshi A, Hill-Falkenthal J, Coupal E, Dominguez G, Thiemens MH. Measurements of S-35 in the marine boundary layer at La Jolla, California: A new technique for tracing air mass mixing during Santa Ana events. J Geophys Res Atmos. 2012;117(D8):D08301. [Google Scholar]
- 19.Lin M, et al. Resolving the impact of stratosphere-to-troposphere transport on the sulfur cycle and surface ozone over the Tibetan Plateau using a cosmogenic S-35 tracer. J Geophys Res Atmos. 2016;121(1):439–456. [Google Scholar]
- 20.Lin M, et al. Unexpected high S-35 concentration revealing strong downward transport of stratospheric air during the monsoon transitional period in East Asia. Geophys Res Lett. 2016;43(5):2315–2322. [Google Scholar]
- 21.Sprenger M, Wernli H. A northern hemispheric climatology of cross-tropopause exchange for the ERA15 time period (1979-1993) J Geophys Res Atmos. 2003;108(D12):8521. [Google Scholar]
- 22.Langford AO, Pierce RB, Schultz PJ. Stratospheric intrusions, the Santa Ana winds, and wildland fires in Southern California. Geophys Res Lett. 2015;42(14):6091–6097. [Google Scholar]
- 23.Baylon PM, Jaffe DA, Pierce RB, Gustin MS. Interannual variability in baseline ozone and its relationship to surface ozone in the western U.S. Environ Sci Technol. 2016;50(6):2994–3001. doi: 10.1021/acs.est.6b00219. [DOI] [PubMed] [Google Scholar]
- 24.Cooper OR, Langford AO, Parrish DD, Fahey DW. Atmosphere. Challenges of a lowered U.S. ozone standard. Science. 2015;348(6239):1096–1097. doi: 10.1126/science.aaa5748. [DOI] [PubMed] [Google Scholar]
- 25.Priyadarshi A, Dominguez G, Thiemens MH. Evidence of neutron leakage at the Fukushima nuclear plant from measurements of radioactive 35S in California. Proc Natl Acad Sci USA. 2011;108(35):14422–14425. doi: 10.1073/pnas.1109449108. [DOI] [PMC free article] [PubMed] [Google Scholar]
- 26.Oltmans SJ, et al. Tropospheric ozone over the North Pacific from ozonesonde observations. J Geophys Res Atmos. 2004;109(D15):D15S01. [Google Scholar]
- 27.Cho HM, Hong YL, Kim G. Atmospheric depositional fluxes of cosmogenic S-35 and Be-7: Implications for the turnover rate of sulfur through the biosphere. Atmos Environ. 2011;45(25):4230–4234. [Google Scholar]
- 28.Priyadarshi A, et al. Detection of radioactive S-35 at Fukushima and other Japanese sites. J Geophys Res Atmos. 2013;118(2):1020–1027. [Google Scholar]
- 29.Chan LY, Chan CY, Qin Y. Surface ozone pattern in Hong Kong. J Appl Meteorol. 1998;37(10):1153–1165. [Google Scholar]
- 30.Bytnerowicz A, et al. Analysis of the effects of combustion emissions and Santa Ana winds on ambient ozone during the October 2007 southern California wildfires. Atmos Environ. 2010;44(5):678–687. [Google Scholar]
- 31.Sommers WT. Lfm forecast variables related to Santa-Ana wind occurrences. Mon Weather Rev. 1978;106(9):1307–1316. [Google Scholar]
- 32.Cao Y, Fovell RG. Downslope windstorms of San Diego County. Part I: A case study. Mon Weather Rev. 2016;144(2):529–552. [Google Scholar]
- 33.Clapp LJ, Jenkin ME. Analysis of the relationship between ambient levels Of O3, NO2 and NO as a function of NO chi in the UK. Atmos Environ. 2001;35(36):6391–6405. [Google Scholar]
- 34.Parrish DD, et al. Relationships between ozone and carbon monoxide at surface sites in the North Atlantic region. J Geophys Res Atmos. 1998;103(D11):13357–13376. [Google Scholar]
- 35.Jiang YC, et al. Why does surface ozone peak before a typhoon landing in southeast China? Atmos Chem Phys. 2015;15(23):13331–13338. [Google Scholar]
- 36.Voulgarakis A, et al. Global multi-year O3-CO correlation patterns from models and TES satellite observations. Atmos Chem Phys. 2011;11(12):5819–5838. [Google Scholar]
- 37.Mao HT, Talbot R. O3 and CO in New England: Temporal variations and relationships. J Geophys Res Atmos. 2004;109(D21):D21304. [Google Scholar]
- 38.Tanaka N, Turekian KK. Determination of the Dry Deposition Flux of So2 Using Cosmogenic S-35 and Be-7 Measurements. J Geophys Res Atmos. 1995;100(D2):2841–2848. [Google Scholar]
- 39.Sillman S. The relation between ozone, NOx and hydrocarbons in urban and polluted rural environments. Atmos Environ. 1999;33(12):1821–1845. [Google Scholar]
- 40.Meng Z, Dabdub D, Seinfeld JH. Chemical coupling between atmospheric ozone and particulate matter. Science. 1997;277(5322):116–119. [Google Scholar]
- 41.Shao M, Tang XY, Zhang YH, Li WJ. City clusters in China: Air and surface water pollution. Front Ecol Environ. 2006;4(7):353–361. [Google Scholar]
- 42.Lu Z, et al. Sulfur dioxide emissions in China and sulfur trends in East Asia since 2000. Atmos Chem Phys. 2010;10(13):6311–6331. [Google Scholar]
- 43.Sullivan JT, et al. Characterizing the lifetime and occurrence of stratospheric-tropospheric exchange events in the rockymountain region using high-resolution ozone measurements. J Geophys Res Atmos. 2015;120(24):12410–12424. [Google Scholar]
- 44.Jordan CE, Dibb JE, Finkel RC. 10Be/7Be tracer of atmospheric transport and stratosphere-troposphere exchange. J Geophys Res Atmos. 2003;108(D8):4234. [Google Scholar]
- 45.Aldahan A, et al. Atmospheric impact on beryllium isotopes as solar activity proxy. Geophys Res Lett. 2008;35(21):L21812. [Google Scholar]
- 46.Liang MC, Tang J, Chan CY, Zheng XD, Yung YL. Signature of stratospheric air at the Tibetan Plateau. Geophys Res Lett. 2008;35(20):L20816. [Google Scholar]
- 47.Thiemens MH, Chakraborty S, Jackson TL. Decadal Delta O-17 record of tropospheric CO2: Verification of a stratospheric component in the troposphere. J Geophys Res Atmos. 2014;119(10):6221–6229. [Google Scholar]
- 48.Stohl A, Hittenberger M, Wotawa G. Validation of the Lagrangian particle dispersion model FLEXPART against large-scale tracer experiment data. Atmos Environ. 1998;32(24):4245–4264. [Google Scholar]


