Significance
Cell division occurs by the assembly and constriction of a ring of actin and myosin; however, the organization of proteins within cytokinetic apparatus is still unknown. Without better information about the organization of contractile rings, we cannot understand how they assemble or constrict. In fission yeast, cytokinetic proteins are first recruited around the equator as cortical spots, called nodes, that coalesce into a ring. Here we used high-speed quantitative fluorescence photoactivation localization microscopy to obtain a molecular model of this basic cytokinetic unit. Nodes are discrete structures with distinct distributions of six different proteins. Nodes persist in contractile rings and move around the circumference as the ring constricts.
Keywords: super resolution, cytokinesis, cytokinetic nodes, contractile ring, fission yeast
Abstract
Cytokinesis in animals, fungi, and amoebas depends on the constriction of a contractile ring built from a common set of conserved proteins. Many fundamental questions remain about how these proteins organize to generate the necessary tension for cytokinesis. Using quantitative high-speed fluorescence photoactivation localization microscopy (FPALM), we probed this question in live fission yeast cells at unprecedented resolution. We show that nodes, protein assembly precursors to the contractile ring, are discrete structural units with stoichiometric ratios and distinct distributions of constituent proteins. Anillin Mid1p, Fes/CIP4 homology-Bin/amphiphysin/Rvs (F-BAR) Cdc15p, IQ motif containing GTPase-activating protein (IQGAP) Rng2p, and formin Cdc12p form the base of the node that anchors the ends of myosin II tails to the plasma membrane, with myosin II heads extending into the cytoplasm. This general node organization persists in the contractile ring where nodes move bidirectionally during constriction. We observed the dynamics of the actin network during cytokinesis, starting with the extension of short actin strands from nodes, which sometimes connected neighboring nodes. Later in cytokinesis, a broad network of thick bundles coalesced into a tight ring around the equator of the cell. The actin ring was ∼125 nm wide and ∼125 nm thick. These observations establish the organization of the proteins in the functional units of a cytokinetic contractile ring.
The mechanism of cell division by a contractile ring of actin and myosin II appeared in the common ancestor of amoebas, fungi, and animals (1). Although much is known about the protein composition of contractile rings, relatively little is known about the 3D organization of these proteins. This information is required to formulate computer models and simulations to test ideas regarding the mechanisms of contractile ring function.
Electron microscopy has shown actin filaments in contractile rings of animal cells (2, 3) and yeast cells (4, 5). Myosin II concentrates in cleavage furrow (6) and is the main motor for constricting contractile rings (7, 8). In animal cells, electron microscopy has revealed rods the size of myosin II minifilaments in contractile rings (2, 9), and structured-illumination fluorescence microscopy has shown that this myosin II is organized in bipolar assemblies (10). Contractile rings contain other structural and regulatory proteins, including anillin (11), IQ motif containing GTPase-activating proteins (IQGAP) (12), formins (13), alpha-actinin (14), and Fes/CIP4 homology-Bin/amphiphysin/Rvs (F-BAR) proteins (15), but how these proteins are anchored to the plasma membrane or organized into functional complexes in animal cells is unknown.
Our understanding of the cytokinetic apparatus is most advanced in fission yeast (16). Only in fission yeast do we know the concentrations of the major cytokinesis proteins (17) and the time course of events leading to cellular division (18, 19). Molecularly explicit computer models can account for both the time course of contractile ring formation (20) and the constriction rate and tension produced by the contractile ring (21); however, these models require a number of unproven assumptions about the organization of the proteins.
Quantitative fluorescence microscopy has documented the precise times at which cytokinesis proteins are recruited to the equator of fission yeast cells. During interphase, anillin Mid1p concentrates in spots called nodes on the inside of the plasma membrane around the equator. As the cell enters mitosis, myosin II Myo2, IQGAP Rng2p, F-BAR Cdc15p, and formin Cdc12p accumulate in this order in nodes; actin filaments grow from nodes; and the nodes condense into a ring (19, 20). Several cytokinesis proteins are present in stoichiometric ratios around the equator of dividing cells (17, 22); however, the densely packed nodes appear as diffraction-limited spots with a wide range of intensities in conventional fluorescence micrographs (20). Consequently, the original estimate of ∼65 nodes per cell was likely an underestimate. Because the number of proteins per node was calculated by dividing the total number of node proteins around the equator by the number of nodes, the calculated numbers of molecules per node was likely overestimated.
The most detailed information on the organization of proteins in fission yeast nodes has come from single-molecule high-resolution colocalization (SHREC), a method for obtaining accurate measurements of distances between fluorophores by confocal microscopy. Laporte et al. (22) applied this single-molecule method to measure distances between clusters of node proteins labeled with fluorescent proteins. However, this method does not provide the numbers of molecules per node or their arrangements in three dimensions. The organization of proteins in fission yeast contractile rings is even less clear, because the proteins are packed too densely to allow the substructure to be resolved by conventional confocal fluorescence microscopy.
In this paper, we address the main open questions regarding cytokinesis nodes. Are they heterogeneous protein aggregates or discrete, uniform structural units? How many nodes assemble around the equator of a cell? How are anillins, formins, F-BAR proteins, IQGAPs, myosins, and actins organized in nodes? Do nodes persist after they coalesce into the contractile ring? How do contractile ring proteins behave during constriction? We propose a molecular model of the cytokinetic node for use in computer models to test theories about cytokinesis.
Fluorescence photoactivation localization microscopy (FPALM, also called PALM or STORM) improves spatial resolution by 10-fold over standard fluorescence microscopy by precisely localizing individual fluorescent molecules as they are turned on and off stochastically (Fig. S1) (23–25). Thus, each localized single-molecule emitter contains spatial and temporal information that provides quantitative data that surpass those obtained from other super-resolution techniques. We took advantage of recent developments in instrumentation and data analysis methods (26–32) to perform FPALM super-resolution microscopy at ∼35-nm resolution (localization precision, σloc, ∼14 nm). These methods enabled us to observe that nodes are uniform units with stoichiometric ratios and distinct distributions of constituent proteins, and provided the quantitative data necessary to build a molecular model of the node. We observed that nodes persist within the contractile ring and move bidirectionally during constriction.
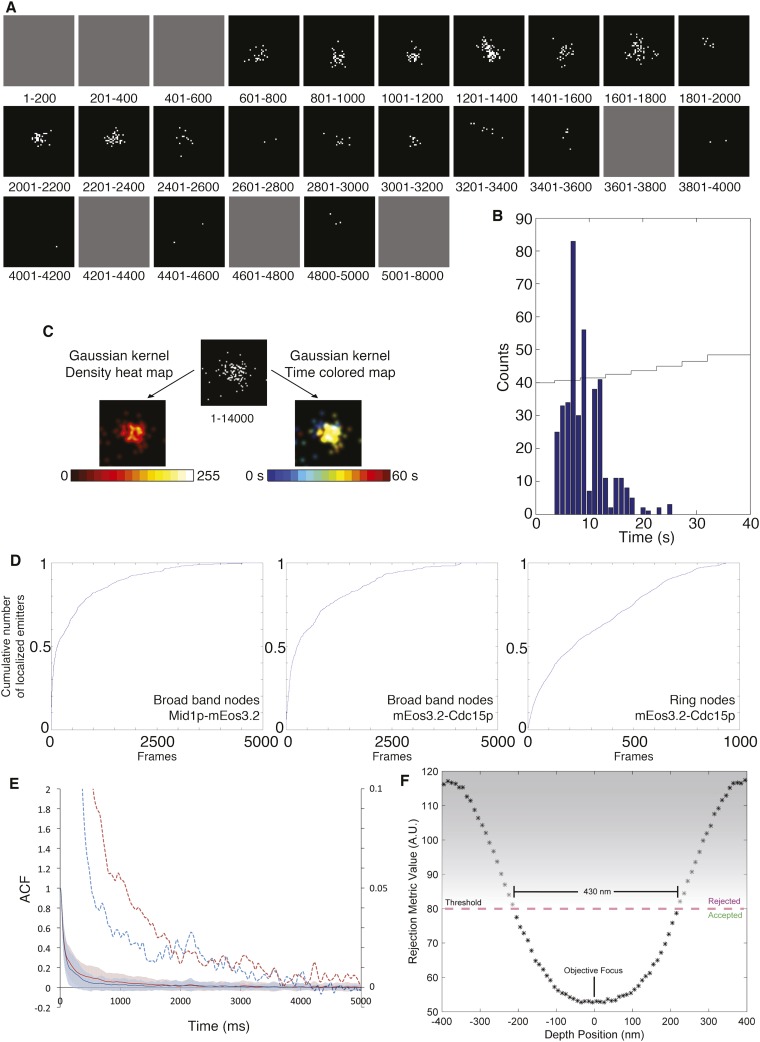
Fig. S1.
Understanding FPALM data. (A) Time course of the localizations of Myo2p-mEos3.2 in a single node collected at 200 frames/s. The panels show events detected during the indicated frames. Photoactivated single molecules were localized and plotted as single points on a 2D histogram (5 nm/pixel). Gray panels are time periods with no localized emitters. (B) Histogram of the number of localized emitters over the course of acquisition of the node shown in A. The photoactivation laser power was increased automatically every 5 s (thin line). (C) Visualization of the localizations in another stationary node marked with Myo2p-mEos3.2. (Top) Raw dataset with the sum of localized emitters. (Left) Image generated by applying a Gaussian kernel of sigma 1.5 pixels to each localized emitters of the raw dataset and color-coded for density with a heat map. (Right) The same image color-coded for time of detection with a rainbow color map. (D) Cumulative number of detections of emitters localized over the time course of data acquisition. (Left) Mid1p-mEos3.2 in broadband nodes. (Middle) mEos3.2-Cdc15p in broadband nodes. (Right) mEos3.2-Cdc15p in contractile ring nodes. Each sample consisted of all of the nodes analyzed for that type. Time in camera frames, 200 frames = 1 s. Each graph begins with the camera frame with the first localized emitter in each dataset. (E) Single mEos3.2 molecules photobleached in a few seconds. Shown are ACFs of the detection of emitters in 80 nodes marked with Mid1p-mEos3.2 (blue curves with SDs) and 118 nodes marked with Rlc1p-mEos3.2 (red curves with SDs). Blinking of individual emitters explains the high ACF on the short time scale. Dashed curves show 20-fold–magnified values of the solid curves in the y-axis only (right y-axis and same x-axis) to show photobleaching of activated emitters within 4 s. (F) Depth of optical focus. The log-likelihood ratio-based rejection algorithm defines the OST thickness in our system.
Results
Imaging Cytokinesis Nodes in Live Yeast Cells.
We tagged fission yeast cytokinesis proteins with mEos3.2 (32) at their endogenous genetic loci, thus ensuring expression of the tagged protein at normal levels. We acquired FPALM images at 200 camera frames per second using wide-field illumination (33). All of the mature mEos3.2 molecules in a field were photoconverted and localized before irreversible photobleaching within 40 s of acquisition (Fig. S1 A, B, and D). We calculated the thickness of the optical section to be ∼400 nm (Fig. 1H, Fig. S1F, and Methods). We imaged the surface and central section of cells to obtain face and side views of the cortical cytokinesis nodes (Fig. 1H and Fig. S2C).
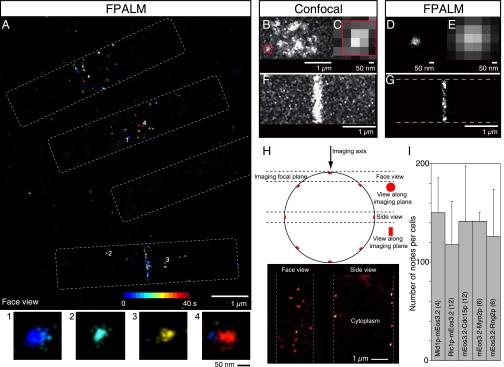
Fig. 1.
FPALM images of the cytokinetic apparatus of fission yeast. (A) Reconstructed image of a field of cells expressing mEos3.2-Rng2p showing four cells (dotted outlines) with three cells at different stages of cytokinesis. This 40-s reconstruction is color-coded for time. (Inset) Four nodes cropped and enlarged. (B, C, and F) Confocal micrographs of cells expressing Rlc1p-mEGFP. (B) Broad band of cytokinesis nodes in a single confocal section of a cell. Boxed node is enlarged in C. (F) Contractile ring. (D, E, and G) FPALM images of cells expressing Rlc1p-mEos3.2. (D) Cytokinesis node from a broad band. (E) The node in D blurred with a Gaussian function similar to the x-y PSF of a confocal microscope, and pixelated. (G) Contractile ring by FPALM. (H, Upper) Diagram of a cross-section of a fission yeast cell with the different views of an object obtained by focusing on the surface or the middle of a cell and (Lower) the FPALM reconstruction images of face and side views. (I) Mean ± 1 SD of nodes per cell in strains expressing different node markers. The numbers of cells analyzed per strain are in brackets.
Fig. S2.
Node movements and localization of the cell edge. (A) Inverted, black and white version of the images of nodes from Figs. 2A and 3A. (B) A moving node marked with Myo2p-mEos3.2. (Left) Raw data showing the localized emissions. (Middle) Heat map illustrating the density of localized emitters. (Right) Temporal color-coding to show movement. (C) Location of the edge of the cytoplasm in images of a longitudinal section of a cell expressing Rlc1p-mEos3.2. (Upper) Original image. (Lower) Enhanced brightness to bring up background fluorescence and identify the edge of the cytoplasm (dashed white line). (D) Line scans to determine the edge of the cell from localizations of Rlc1p-mEos3.2 in the cytoplasm. Regions 200 pixels wide perpendicular to the cell edge were scanned from outside to inside. One region had a node, and the other region did not. The edges are the midpoints of the transitions in the number of localizations. (E–G) Analysis of cytokinesis nodes marked with Rlc1p-mEos3.2. (E) FPALM image. (F) Image in E with each localized emission blurred with a Gaussian function similar to the X-Y PSF of a confocal microscope. The numbers are counts of nodes per spot in this blurred image. (G) Numbers of diffraction-limited spots with 1, 2, 3, or ≥4 FPALM nodes (n = 162).
The improved resolution provided by FPALM showed node proteins concentrated in discrete structures distributed in a broad band around the equator and in contractile rings (Fig. 1 A, D, and G). Some nodes were so close together that they could not be resolved by confocal microscopy (Fig. 1 B–E). This accounts for the range of intensities of nodes in confocal micrographs (20). Most nodes were present at the outset of data acquisition when the photoconversion laser was turned on, but some appeared during data acquisition, as illustrated by temporal color-coding (Fig. 1A). FPALM also revealed structural details within contractile rings, which appeared as dense, seemingly homogenous belts of fluorescence by confocal microscopy (Fig. 1 F and G).
The resolution provided by FPALM allowed us to measure the total number of nodes around the equator. We measured the densities of nodes in segments of the cell surface and extrapolated this density around the circumference of the cell. This approach allowed us to obtain in a single optical section optimal super-resolution node images with high localization density and sufficient resolution for quantitative analysis.
We examined strains expressing five different node markers in the temperature-sensitive cdc25-22 strain, which we synchronized by arresting at the G2–M transition and releasing into mitosis. The density of nodes in surface views of cells extrapolated to ∼140 nodes per cell for all five tagged proteins (Fig. 1I), approximately twice the number resolved by confocal microscopy (n = 4 cells expressing Mid1p-mEos3.2; n = 12 cells expressing Rlc1p-mEos3.2; n = 12 cells expressing mEos3.2-Cdc15p; n = 6 cells expressing mEos3.2-Myo2p and n = 6 cells expressing mEos3.2-Rng2p).
As an alternative method to confirm these measurements, we blurred the super-resolution images with a 2D Gaussian function equivalent to the point-spread function (PSF) of the microscope (SD of the Gaussian function used to fit a PSF to our FPALM system, σPSF, ∼134 nm) (Fig. S2 E–G). In these simulated confocal images, approximately one-half of the nodes marked with Rlc1p-mEos3.2 in cdc25-22 cells were blurred in spots with two or more nodes. Thus, given the original estimate of ∼65 confocal spots per cell (20), WT cells had ∼130 nodes. Multiple nodes were present in 42% of the spots in blurred FPALM images of Myo2p-mEos3.2 (n = 122 nodes) and in 38% of spots in blurred FPALM images of anillin Mid1p-mEos3.2 nodes (n = 154 nodes).
Distinct Distributions of Proteins in Nodes.
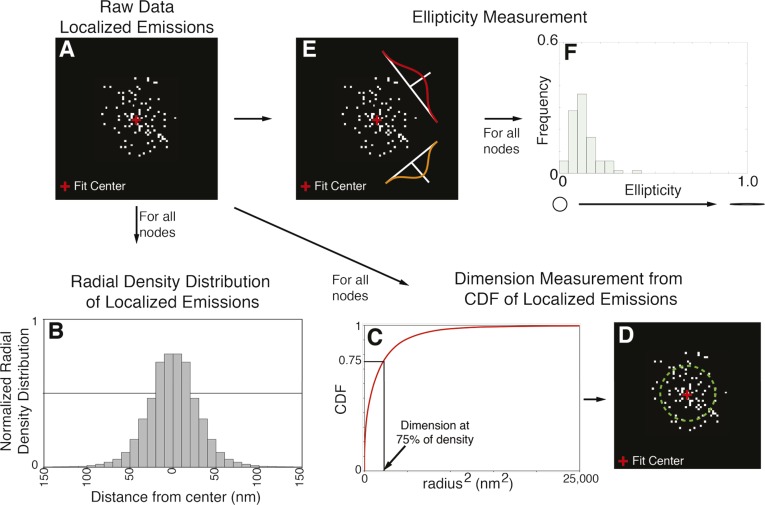
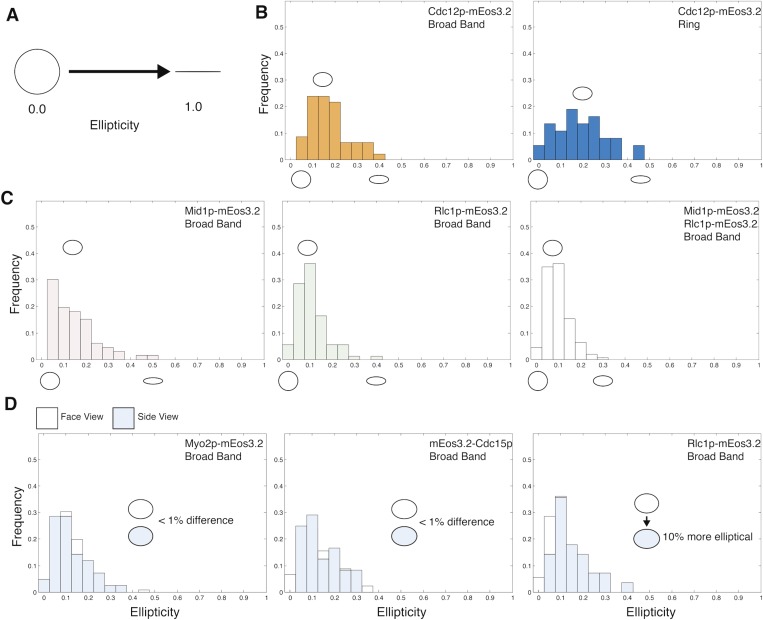
Quantitative analysis of large numbers of localized emissions, each containing precise spatial and temporal information about a single mEos3.2 molecule, revealed unique spatial distributions of each node protein (Fig. 2 A and B and Figs. S3 and S4). Ellipticity measurements (34) showed that the localized emitters were distributed symmetrically within nodes in face views (Fig. S5). This feature justified the measurement of radial density distributions of localized emitters for each node marker to quantify their shapes and dimensions. This approach takes advantage of the vast amount of single-molecule information obtained in a live-cell FPALM experiment and yields more robust measurements of the spatial distribution of the protein of interest over conventional methods such as using line profiles of fluorescence intensity in arbitrary directions across nodes in images reconstructed for visualization (Fig. S3).
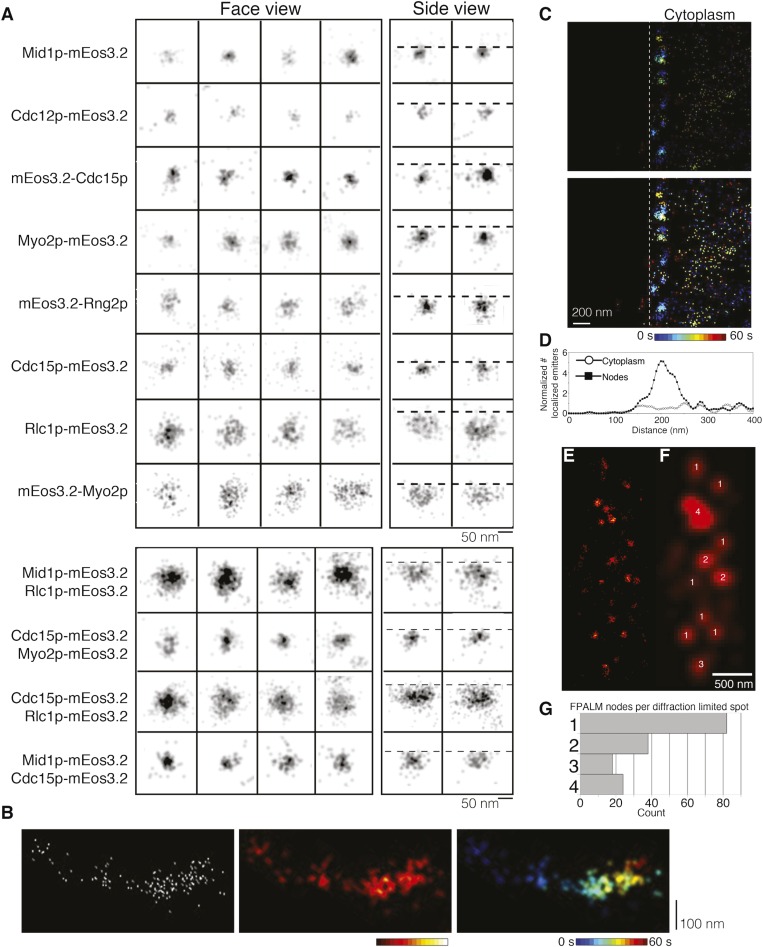
Fig. 2.
Distinct distribution of constituent node proteins. (A) FPALM images of face and side views of nodes marked with eight different mEos3.2 fusion proteins. Horizontal dotted lines indicate the edge of the cytoplasm (Fig. S2). (B) Radial density distributions of localizations in nodes. The data are mirrored at the origin. The numbers in top right corners are the radii (nm) of the zones with 75% of localizations. (C) Means ± 1 SD of localized emissions per node. Numbers of nodes analyzed are in brackets.
Fig. S3.
Quantitative analysis of FPALM raw localized emissions data. (A) A 2D histogram of the raw data of localized emissions for one node labeled with mEos3.2-Rng2p. The fitted center of the node is marked with a red cross. (Center fitting is described in Methods.) (B) Radial density distribution of localized emissions as a function of the distance from the measured center of the node for all nodes analyzed. (C) The CDF of localized emissions as a function of the squared radius from the measured center of the node for all nodes analyzed. The reported dimension of the node represents the radius containing 75% of all of the localized emissions. (D) The node in A with a circle (green dashed circle) containing 75% of the localized emitters for illustration purposes. (E) Ellipticity measurements of localized emissions within a node by fitting multivariate Gaussian (Methods). (F) Graph of the frequency of ellipticity of nodes for all nodes analyzed (related to Fig. S5).
Fig. S4.
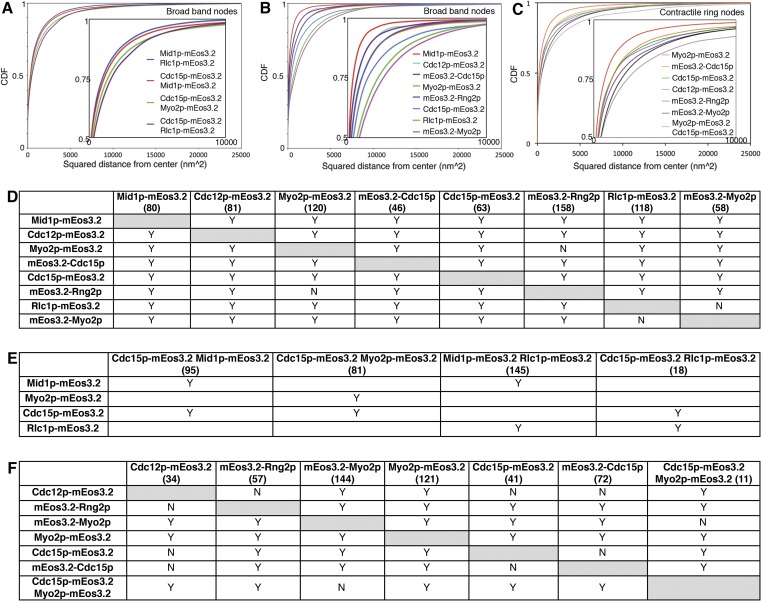
CDFs of nodes labeled with one or two markers. (A–C) The CDF of the radial distribution function for each node marker analyzed. (Inset) Zoom-in of data. The radius of the zone occupied by each node marker is calculated as the distance from the center containing 75% of all localized emitters per node. (D–F) KS tests to determine whether the distributions of pairs of node markers differ significantly from one another. Y indicates P < 0.005. N indicates P ≥ 0.005. (D) KS values for broadband nodes expressing single markers. (E) KS values for broadband nodes expressing pairs of markers. (F) KS values for contractile ring nodes expressing single markers and pairs of markers. Numbers of nodes analyzed per strain are in brackets.
Fig. S5.
Analysis of node shapes by measuring ellipticities of the localizations. (A) An ellipticity value of 0 indicates that all of the localized emitters are clustered within a perfect circle, whereas a value of 1 is a line. (B–D) Frequencies of the ellipticity values of the localizations in nodes labeled with different markers (listed in the upper right corner) in broad bands or in contractile rings (Ring). The distributions of the localizations of all of the markers analyzed for nodes in broad bands were biased toward circular shapes justifying the use of radial density distributions to describe their shapes. (B) The distribution of Cdc12p-mEos3.2 localizations in nodes in the contractile rings was more elliptical, likely owing to their movements during imaging. (C) Mean ellipticities of the distributions of Mid1p-mEos3.2, Rlc1p-mEos3.2, and the double-labeled Rlc1p-mEos3.2/Mid1p-mEos3.2. (D) Bar graphs comparing the distributions of ellipticity values of localizations in nodes labeled with different markers (listed in the upper right corner) in face views (white bars) and side views (blue bars). The distributions of the localizations of myosin II heads (Rlc1p-mEos3.2) were 10% more elliptical in the side view than in face views. There is <1% difference in the ellipticities in the face and side views in the C terminus of the myosin II tails and the N terminus of Cdc15p.
With one exception, noted below, Kolmogorov–Smirnov (KS) tests showed that the distribution of each node component differed significantly from that of all of the others (Fig. S4). We report the dimension for each node component throughout the text and figures as the radius of the zone containing 75% of localized emissions (Fig. 2B and Fig. S3).
Face and side views of stationary nodes showed that the C termini of Myo2p (at the end of the tail), anillin Mid1p, F-BAR protein Cdc15p, IQGAP Rng2p, and formin Cdc12p were all localized in a compact structure near the plasma membrane, whereas the heads of Myo2p (mEos3.2 on the N terminus of the Myo2p heavy chain or regulatory light chain Rlc1p) extended from this core into the cytoplasm (Figs. 2A and 3A). Radial density distributions showed that mEos3.2 on the C terminus of Mid1p was clustered tightly within 21 nm of the center, corresponding approximately to the resolution limit of our method. The other tagged node proteins were distributed at larger radii: the C terminus of formin Cdc12p at 27 nm, N terminus of Cdc15p at 26 nm, the N terminus of IQGAP Rng2p at 32 nm, and the C terminus of Cdc15p at 39 nm. The mEos3.2 tags on all of these molecules were close to the plasma membrane in side views (Fig. 2 A and B).
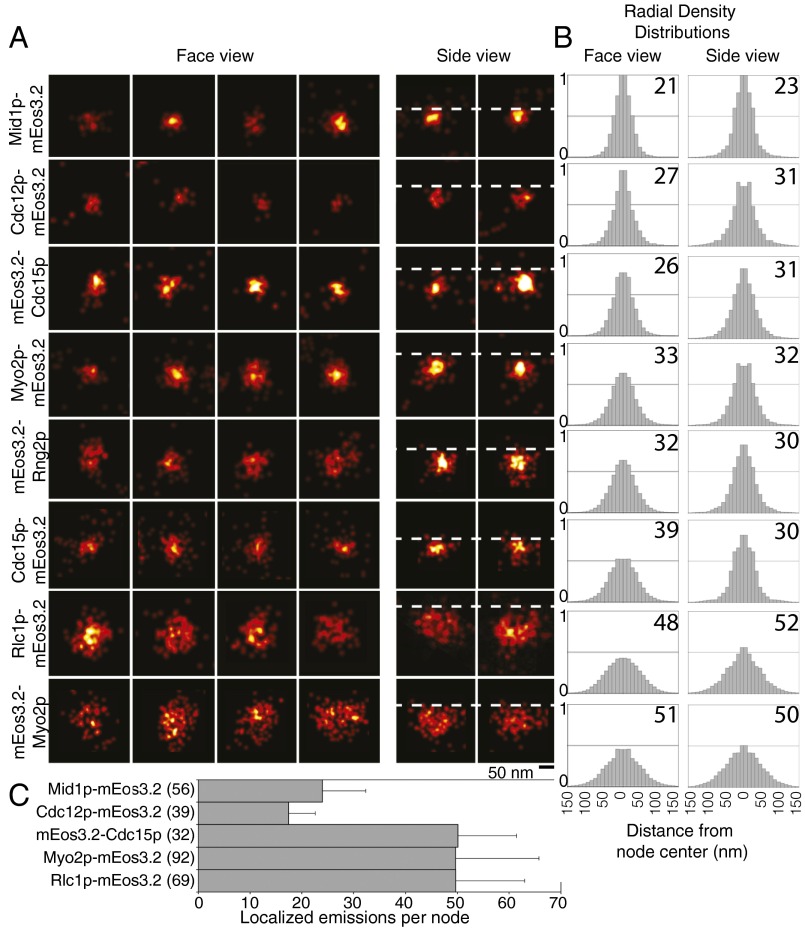
Fig. 3.
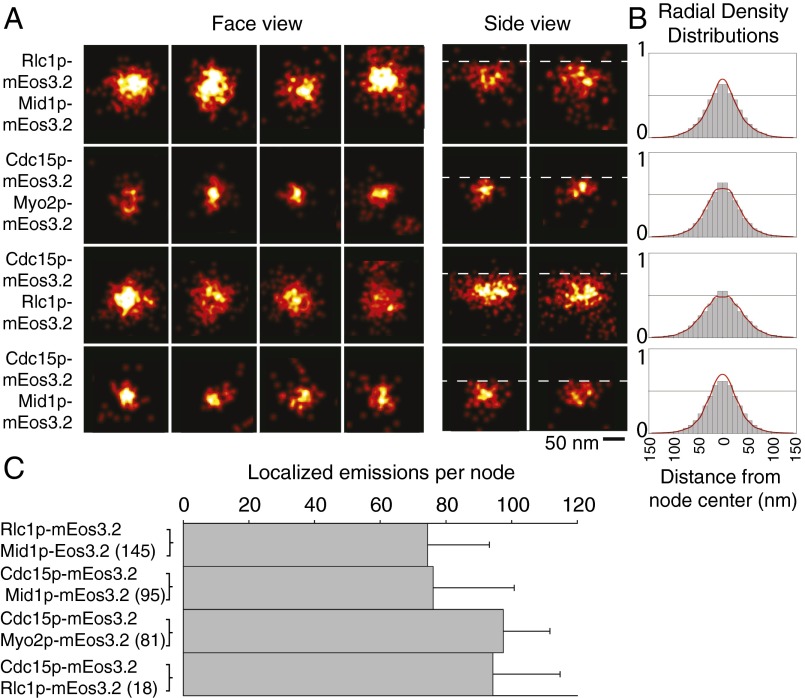
Colocalization of four pairs of node proteins. (A) Face and side views of nodes in strains expressing four pairs of node markers tagged with mEos3.2. Horizontal dotted lines indicate the edge of the cytoplasm (Fig. S2C). (B) Radial density distributions of localized emissions for pairs of tagged proteins in nodes. The data are mirrored at the origin. The red curves are the sums of the distributions in cells expressing single tagged node markers superimposed on the data for cells expressing both proteins. (C) Means ± 1 SD of localized emissions per node. Numbers of nodes analyzed are in brackets.
The motor heads and the tips of the tails of conventional myosin II had different distributions in nodes (Fig. 2 A and B). This myosin consists of two copies each of the Myo2p heavy chain, regulatory light chain Rlc1p, and essential light chain Cdc4p (35–38). The two N-terminal motor heads bind light chains and actin filaments. The remainder of each heavy chain forms a coiled-coil tail ∼65 nm long with a 20-nm tail piece (39). The C-terminal ends of the Myo2p tails concentrated near the plasma membrane within a radius of 33 nm, a distribution indistinguishable from mEos3.2-Rng2p by KS testing (Fig. S4). Face and side views showed the Myo2p heads dispersed in a larger hemisphere adjacent to the plasma membrane, with Rlc1p-mEos3.2 at 48 nm from the center and mEos3.2-Myo2p at 51 nm from the center in face views. The dimensions of nodes in side view images were similar to those in face views (Fig. 2B). Cdc15p-mEos3.2 showed the largest difference, with 9 nm between the face and side views.
The distributions of mEos3.2 on the ends of the tails of myosin II had the same ellipticities in face and side views. However, the distribution of the myosin II heads was 10% more elliptical in side views than face views (Fig. S5), consistent with spreading of myosin II heads into a hemisphere with their tails anchored at the core of the node.
Stoichiometric Ratios of Node Proteins.
Each mEos3.2 molecule can be turned on and off more than once before being irreversibly photobleached (32). This intrinsic blinking behavior of mEos3.2 results in each tagged molecule being localized more than once. Although these events are stochastic, populations of localized emitters nonetheless should scale according to the number of tagged proteins, allowing us to calculate protein ratios from the relative numbers of localized emissions from each tagged protein (Fig. 2C).
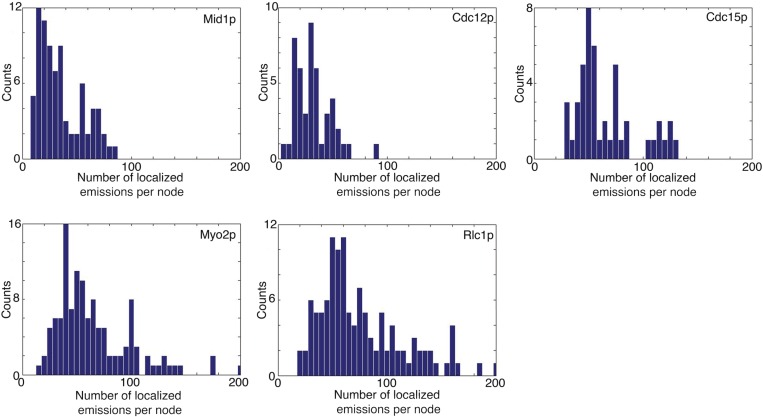
We analyzed the distribution of the number of localized emissions for each marker (Fig. S6). Each distribution exhibited a major peak, followed by a tail. Nodes in the tail were seen only in long reconstructions (25 s), not in short reconstructions (5 s). For our quantitative analyses, we focused on the nodes of the major peak.
Fig. S6.
Distribution of the numbers of localized emitters per node. The bar graphs compare the distributions of number of localized emitters per node for different markers (listed in the upper right corner). Mid1p and Cdc12p have peaks with ∼20 emitters per node. Cdc15p, Myo2p, and Rlc1p have peaks with ∼40 emitters per node. Eighty nodes were analyzed for Mid1p-mEos3.2, 47 nodes were analyzed for Cdc12p-mEos3.2, 46 nodes were analyzed for mEos3.2-Cdc15p, 120 nodes were analyzed for Myo2p-mEos3.2, and 118 nodes were analyzed for Rlc1p-mEos3.2.
The average numbers of localized emissions per node were indistinguishable for three dimeric molecules (Myo2p tagged on either end of the heavy chain Rlc1p, IQGAP Rng2p, and both ends of F-BAR Cdc15p), whereas the counts of Mid1p and Cdc12p were approximately one-half of these values. The numbers of localized emissions of formin Cdc12p in stationary nodes was roughly the same as those of Mid1p; thus, for each Mid1p subunit, nodes had 0.5 Cdc12p dimer, 1 myosin II dimer, 1 Cdc15p dimer, and 1 Rng2p dimer. The counts of localized emitters were the same for mEos3.2 on Myo2p and its regulatory light chain Rlc1p (Fig. 2C) and served as internal control for the method.
Colocalization of Pairs of Node Proteins.
Conventional fluorescence imaging with pairs of contrasting fluorophores provided evidence that several proteins colocalize in nodes (18, 19, 22, 40, 41). We reexamined the colocalization of node proteins at 10-fold–higher resolution by quantitative single-molecule localizations of pairs of proteins with the same fluorescent tag. We did not use pairs of different photoconvertable proteins, because they often have overlapping emission spectra and dividing these overlapping emissions into separate channels reduces photon counts, decreases the robustness of detection, and results in a loss of localizations.
Our quantitative analysis showed that four pairs of tagged node proteins colocalized in the same structures. We compared the numbers of localizations and the radial distributions of four tagged proteins expressed either in separate strains (Fig. 2) or as pairs in the same strains (Fig. 3 and Methods). Mean counts of localized emitters per node and the radial density distributions of the double-labeled nodes were close to the sums in cells expressing each protein separately. Rlc1p-mEos3.2 formed a hemisphere around the core labeled with either Mid1p-mEos3.2 or Cdc15p-mEos3.2, whereas Cdc15p-mEos3.2 was peripheral to both Mid1p and Myo2p-mEos3.2. Thus, all of the proteins considered here are parts of the same structure.
Molecular Model of the Node.
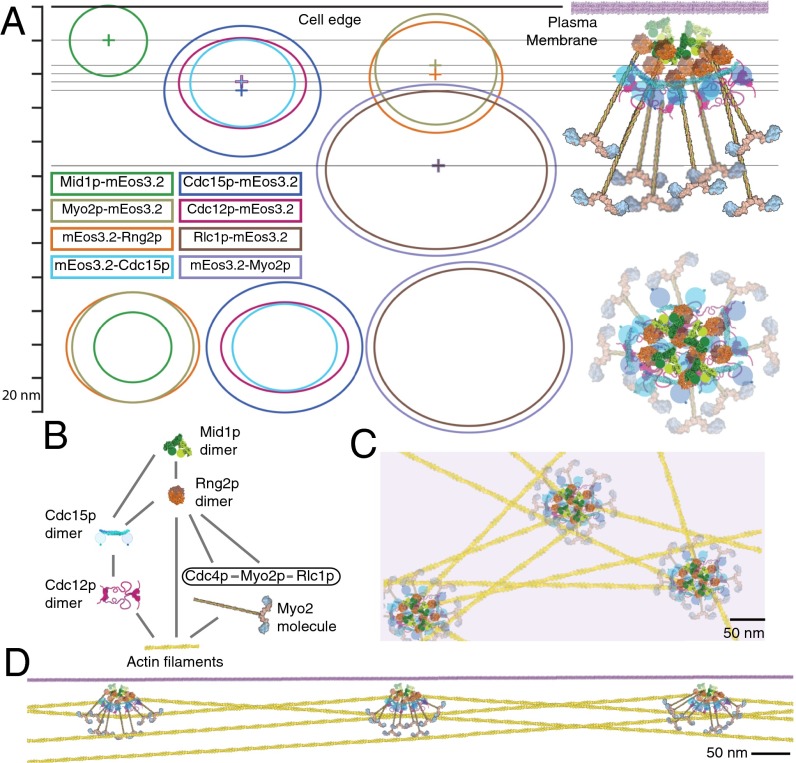
The data in Figs. 1–3 establish that cytokinesis nodes are discrete structures and set limits on the numbers of copies of proteins per node. Given ∼1,500 molecules of Mid1p (17) in ∼140 nodes around the equator, cytokinesis nodes have ∼10 Mid1p molecules and equal numbers of the Cdc15p, Rng2p, and myosin II dimers. These ratios agree with previously reported quantitative confocal microscopy measurements of the total number of Myo2p, Rlc1p, and Mid1p at the division site (17) and estimates of the numbers of Myo2p, Rlc1p, Cdc15p, and Mid1p per node (22, 41, 42).
We propose a molecular model of the cytokinesis node constrained by the stoichiometries, shapes, and relative positions of six node proteins and their positions with respect to the cell edge (Fig. 4A and Methods). Our data and model agree with known biochemical and genetic interactions among these proteins (Fig. 4B and Methods). The central core containing Mid1p, Cdc15p, and Rng2p anchors the Myo2 tails, allowing the myosin heads to fan out in a bouquet in the cytoplasm. This radial arrangement of myosin II is equivalent to a bipolar myosin II filament that can produce force on oppositely oriented actin filaments from neighboring nodes during contractile ring formation and constriction (Fig. 4 C and D).
Fig. 4.
Molecular model of the cytokinesis node. (A) Schematic scale model summarizing the locations of six proteins in cytokinesis nodes in a side view (Upper) and a face view from the top of the cell (Lower). The ellipses illustrate the dimensions and ellipticity of the area containing 75% of localized emitters for each marker. The lines in the side view illustration represent the distance between each node center to the plasma membrane (Fig. S2D). The stoichiometry is based on four Mid1p dimers with eight dimers of Rng2p, myosin II, and Cdc15p and four dimers of Cdc12p. The molecules are drawn to scale with details from crystal structures or electron microscopy. The coiled-coil tail of Myo2p is 65 nm long in the side view model (39). (B) Schematic of known protein interactions (Methods). (C and D) Scale drawings of a face view (C) and side view (D) of nodes connected by actin filaments during node coalescence. Force is produced by myosins acting on actin filaments anchored to neighboring nodes to pull the nodes together into a ring.
Actin Filaments During Formation and Constriction of Contractile Rings.
We localized actin filaments indirectly with mEos3.2-CHD expressed from a repressible promoter (Fig. 5 and Fig. S7), because actin tagged with GFP does not incorporate into contractile rings (18, 43). CHD, the calponin homology domain from fission yeast IQGAP Rng2p (44), binds to actin filaments with a Kd of 20 µM (45), exchanging on and off filaments on a subsecond time scale, much faster than the expected turnover rate of actin (46).
Fig. 5.
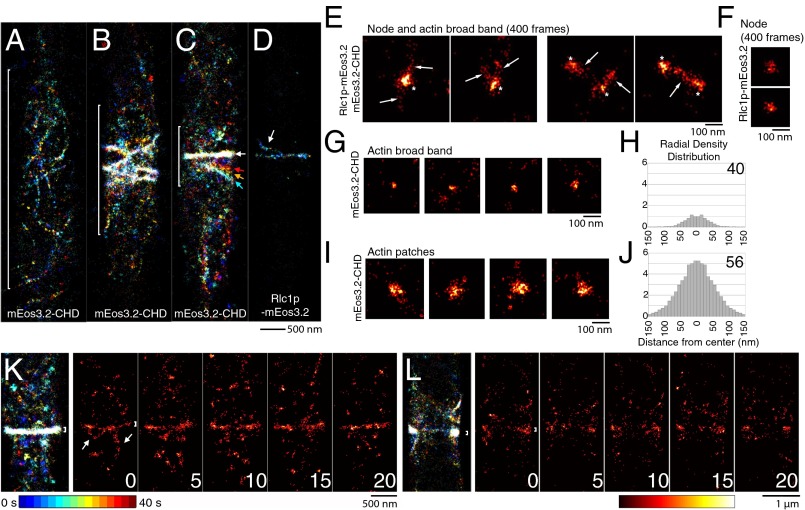
FPALM images of actin filaments in mitotic yeast cells. (A–D) Temporal color-coded map images reconstructed from 8,000 frames (40 s; bar at bottom). (A–C) Stages of contractile ring assembly in images of the equatorial regions (brackets) of three cells expressing mEos3.2-CHD to mark actin filaments. Colored arrows in C mark the movement of a strand toward the ring (white arrow). (D) Cell expressing Rlc1p-mEos3.2 with a nearly complete ring and strand of several nodes. The arrow points to a strand merging into the ring similar to C. (E) Images of nodes (asterisks) and actin filaments (arrows) in cells expressing both mEos3.2-CHD and Rlc1p-mEos3.2 (Movie S1). (F) Node in a cell expressing Rlc1p-mEos3.2. (G and H) mEos3.2-CHD early in ring assembly (n = 15 nodes). (G) Images of broadband clusters of localizations. (H) Radial density distribution with the radius (in nm) including 75% of localizations. (I and J) Actin patches labeled with mEos3.2-CHD. (I) Images of face views. (J) Radial density distribution with the radius (in nm) including 75% of localizations (n = 15 patches). (K and L) Images of cells expressing mEos3.2-CHD reconstructed from 8,000 frames (40 s) displayed with temporal color coding and time series of images reconstructed from 200 frames of acquisition (1 s) at the indicated times, displayed as hot maps. (K) Surface view of a fully assembled ring with transient linear arrays of localizations (arrows) flanking the ring. (L) Longitudinal section of a cell with a ring and dynamic strands extending longitudinally from the ring. White bracket in K and L = 100 nm.
Fig. S7.
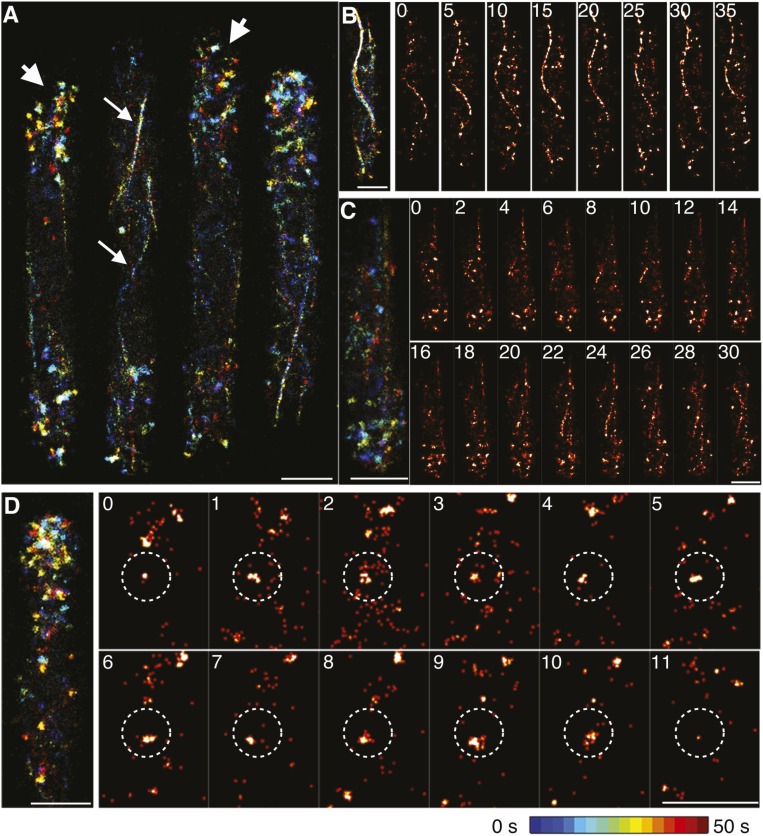
FPALM images of actin filaments in interphase fission yeast cells. Shown are FPALM images of cells expressing mEos3.2-CHD. (A) Image of four interphase cells reconstructed from ∼10,000 frames (∼50 s) showing actin patches (thick arrows) at the cell tips and actin cables (thin arrows) in the middle. (B) Middle of an interphase cell with a cable. Temporal color-coding and heat maps at 5-s intervals show gentle undulations of cable over time (Movie S5). (C) Tip of an interphase cell with patches and fine cables. Cables are dimmer and more dynamic near the tips than in the center of cells. (D) Tip of an interphase cell with actin patches. Temporal color-coding and heat maps at 1-s intervals show that patches appear, move, and disappear. On confocal microscopy, a tiny patch was seen to move within the stationary dashed circle, representing the size of a patch (Movie S6). Time is in seconds. (Scale bars: 1 μm.)
As nodes started to condense into a contractile ring, FPALM first detected mEos3.2-CHD in small clusters (Fig. 5 G and H) and strands (Fig. 5A) in a 2.8 ± 0.7-µm-wide zone around the equator. The radius of the clusters of actin labeled with mEos3.2-CHD was 40 nm (Fig. 5H), slightly larger than the radius of mEos3.2 on the C terminus of formin Cdc12p (Fig. 2B). Cells expressing both Rlc1p-mEos3.2 and mEos3.2-CHD had dense clusters of localizations corresponding to myosin II in the centers of nodes, surrounded by linear arrays of emitters that extended transiently from nodes up to ∼200 nm and sometimes connected to other nodes (Fig. 5E and Movie S1; n = 15 nodes). The strands of tagged CHD likely correspond to individual actin filaments or thin bundles of filaments, because they were absent from nodes labeled with Rlc1p-mEos3.2 alone (Fig. 5F).
Compact contractile rings formed from strands marked with mEos3.2-CHD (Fig. 5 A–C). Temporal color-coding and time-lapse reconstructions of images showed strands marked with mEos3.2-CHD collapsing laterally into rings (Fig. 5C and Movie S2). Nodes also aligned in rows (Fig. 5D) before coalescing into the ring, likely due to associations with actin filaments. These strands initially had a broad distribution of orientations along the length of the cell (34 ± 23° from the long axis of the cell; n = 45) but reoriented around the equator, consistent with previous observations by confocal microscopy (40).
Most mEos3.2-CHD localizations in contractile rings were concentrated in a narrow band ∼125 nm wide and ∼125 nm thick (Fig. 5 K and L), similar to dimensions of the actin filament bundle observed in electron micrographs of thin sections (5). Time series of FPALM images showed mEos3.2-CHD strands extending laterally from compact rings (Fig. 5K, arrows). The average length of these strands was 400 ± 200 nm, and they persisted for a few seconds, consistent with the continuous production (20) and turnover (46) of actin filaments by formin Cdc12p in the ring (Movies S3 and S4).
Interphase cells contained actin cables (Fig. S7 A–C and Movie S5) 34 ± 7 nm thick (much thinner than in confocal micrographs and consistent with the resolution of FPALM) and actin patches at sites of clathrin-mediated endocytosis near the poles (Fig. S7 A and D and Movie S6). Many patches appeared, moved, and disappeared during ∼50 s of acquisition, with an average lifetime of ∼10 s (n = 15 patches). In time-lapse images, mEos3.2-CHD appeared in patches at the cell surface and expanded to a diameter of 56 nm (Fig. 5J), considerably smaller than the diffraction-limited patches in confocal micrographs, and then disappeared. Local diffusive motions blurred the patches during their brief existence (Fig. S7A).
Nodes Persist in the Constricting Contractile Ring.
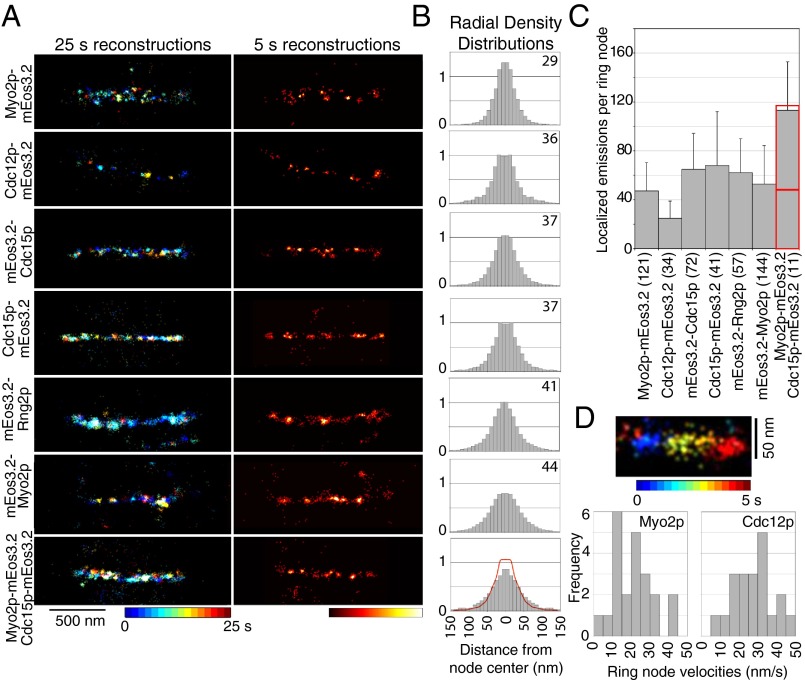
High-speed FPALM revealed that node proteins clustered in discrete structures within fully formed and constricting contractile rings (Fig. 6A). During constriction, these clusters of node proteins moved bidirectionally in a narrow (∼100–150 nm) band (Fig. 6D). Average velocities were 22 ± 10 nm/s for nodes marked with Myo2p and 28 ± 11 nm/s for nodes marked with Cdc12p, slightly slower than the velocities of nodes condensing into rings (20, 47).
Fig. 6.
Four proteins concentrate in nodes in contractile rings. (A) FPALM images of constricting contractile rings in cells expressing proteins tagged with mEos3.2. (Left) Images with temporal color-coding reconstructed from 5,000 frames (25 s). (Right) Heat maps of the same regions showing emitter densities reconstructed from 1,000 frames (5 s). (B and C) Analysis of ring nodes in datasets reconstructed from 1,000 frames (5 s) to avoid blurring due to motion. (B) Radial density distributions of the localized emissions of tagged proteins in ring nodes. Data are mirrored at the origin. The numbers in the top right corners are the radii (nm) of the zones with 75% of localizations. The red curve in the graph from cells expressing both Myo2p-mEos3.2 and Cdc15p-mEos3.2 is the sum of the data from cells expressing each node marker separately, superimposed on the data for cells expressing both proteins. (C) Means ± 1 SD of localized emissions per ring node. In A–C, the numbers of nodes analyzed per strain are in brackets. (D) Dynamics of nodes inside rings. (Upper) Image of a node marked with Myo2p-mEos3.2 displayed with temporal color coding over 5 s. (Lower) Graphs showing distributions of the velocities of ring nodes marked with Myo2p-mEos3.2 or Cdc12p-mEos3.2 (n = 20 nodes for each marker).
The radial density distributions of the six tagged node proteins were similar in these spots in contractile rings and stationary nodes early in mitosis (Fig. 6B), although the motion and close packing of nodes in rings limited the precision of the measurements. The C terminus of Myo2p was located at the smallest radius of 29 nm, and its N-terminal heads were at the largest radius of 44 nm. Cdc12p, Rng2p, and both ends of Cdc15p were at radii of 36–41 nm. KS testing showed that the radial density distribution of Cdc12p was indistinguishable from those of Rng2p and Cdc15p tagged at either end, and that the locations of the N- and C-terminal ends of Cdc15p were indistinguishable as well (Fig. S4). In cells expressing both Myo2p-mEos3.2 and Cdc15p-mEos3.2, the radial density profiles were similar to the sum of the separate density profiles for each marker (Fig. 6B), and the numbers of localized emitters were also additive, consistent with the two markers being located in the same structures (Fig. 6C). Thus, the fluorescence of node proteins in contractile rings is blurred and homogenous in confocal micrographs (Fig. 1F), because the nodes are crowded together and moving continuously.
We did not examine Mid1p and Rlc1p in rings, because Mid1p leaves rings shortly after they assemble (18), and because Rlc1p binds to both Myo2p and Myp2p, a second myosin II heavy chain that joins the ring just before the onset of constriction (47, 48).
Discussion
Our high-speed FPALM of live cells has answered many questions regarding nodes and the organization of the contractile ring in fission yeast. We now know that mitotic cells assemble approximately 140 nodes containing stoichiometric ratios of six different proteins. The distinct distributions of eight different mEos3.2 tags in nodes demonstrate that nodes are discrete structures containing all six proteins rather than each protein localizing in its own node. The higher resolution offered by FPALM revealed that nodes persist in contractile rings, where they move circumferentially in both directions. Observations with mEos3.2-CHD confirmed that actin filaments grow transiently from nodes and form connections with neighboring nodes (20).
We propose a 3D model for the arrangement of proteins in nodes constrained by the localizations from two points of view of mEos3.2 tags on eight sites on six proteins (Fig. 4A). The distributions of these node proteins are consistent with their sizes, shapes, distances from the cell edges, and established interactions among them (Fig. 4B and Methods). The model takes into account the small deviations from radial symmetry of the localizations, which could represent either a slightly elongated structure or biological motion of the sample during image acquisition.
Our model represents a node with the average number of molecules. The mean numbers of localized emitters and their radial density distributions in nodes were highly reproducible and additive, despite variability in the measurements arising from the small numbers of each protein, the time required for mEos3.2 molecules to mature, and stochastic blinking of mEos3.2 molecules. Nevertheless, more work is required to establish whether or not nodes are geometrical structures.
Our model is also consistent with measurements of distances between clusters of node proteins by 2D SHREC (22), a method of measuring distances between fluorophores by confocal microscopy. SHREC was developed to measure distances between single fluorescent dye molecules and was applied to study node proteins tagged with fluorescent proteins. The fluorophores in nodes are not single molecules, so the measurements are between clusters of unknown numbers of molecules. This may account for the wide range of distances measured by SHREC for each pair of tagged proteins. This method does not reveal the sizes of these clusters.
Our model demonstrates how the node proteins are arranged in three dimensions. The C terminus of Mid1p is located at the core of the node close to the plasma membrane. IQGAP Rng2p links Mid1p to the end of the Myo2 tail, and the distributions of the N terminus of IQGAP Rng2p and C terminus of Myo2 at the tip of the tails are indistinguishable. The F-BAR protein Cdc15p links Mid1p to formin Cdc12p, with the N-terminal F-BAR domain closer to the center of the node than its C-terminal SH3 domain, which is located at the end of a flexible region of the protein. It will be interesting to establish these relationships among anillin, IQGAP, myosin II, formins, actin, and F-BAR proteins during cytokinesis in animal cells.
Anchoring the tails of Myo2 to the core of the node allows the heads to fan out into the cytoplasm where they can capture actin filaments for sliding filament interactions during contractile ring formation and constriction (Fig. 4 C and D). The broad distributions of localizations of mEos3.2 attached to the N terminus of Myo2p and Rlc1p are consistent with flexible attachments of the tail to the core. Anchoring Myo2 tails to core proteins creates a motor unit geometrically equivalent to bipolar myosin II filaments of animals and amoebas, but with radial symmetry. Electron micrographs of purified muscle myosins (49) and recombinant human nonmuscle myosin-II (50) show that the heads and proximal tails splay from the backbones of bipolar filaments. This organization, similar to that of the Myo2 bouquets, has been proposed to enhance the amount of actin area accessible by a single array of nonmuscle myosin II.
High-speed FPALM showed that cytokinesis proteins remain organized in clusters similar to nodes in contractile rings and move bidirectionally around the circumference as the ring constricts. This validates the assumption in the computer model of constriction that Myo2 is organized in clusters (21). This finding is somewhat surprising, given that anillin Mid1p is important for organizing Myo2 in nodes but leaves the contractile ring before it constricts (22, 41, 42). Thus, our data indicate that Myo2 and other node proteins remain clustered together without Mid1p after the ring assembles. This is reasonable given the network of interactions among these proteins (Fig. 4B). Fission yeast has a second anillin, Mid2p; however, Mid2p localizes to the septin rings that flank the constricting contractile ring, and its localization depends on septins (51, 52).
Quantitative imaging of live cells by FPALM is a powerful approach for studying dynamic cellular systems at the nanoscale level. Knowing the spatial organization of proteins within multiprotein complexes clarifies the role and biological functions of each constituent protein. This information about molecular structure is essential for proposing and testing models for contractile ring formation and constriction.
The discovery that cytokinetic proteins are organized into discrete functional units in fission yeast provides some clues relevant to the organization of cytokinetic rings in other organisms. Animal cells form contractile rings from clusters of myosin and other evolutionarily conserved proteins, including anillin, IQGAPs, and F-BAR proteins (53–55). It will be important to learn which organizational features revealed in fission yeast apply widely.
Methods
Strain Construction, Growth Conditions, and Cellular Methods.
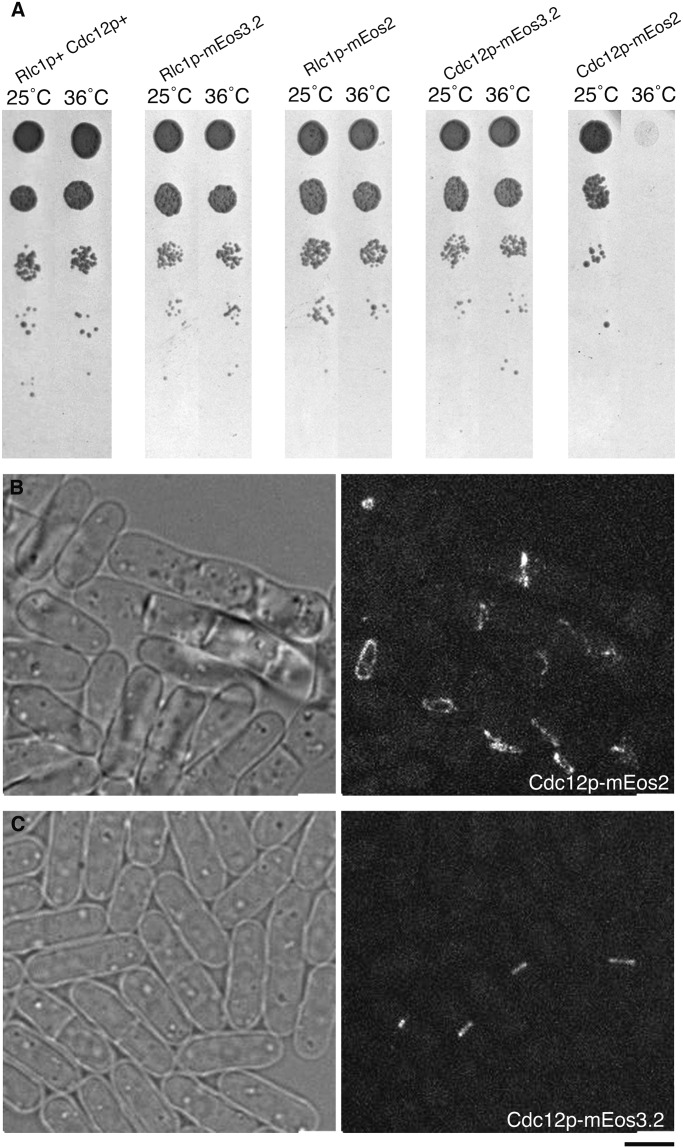
We first generated pFA6a-mEos2-kanMX6 for C-terminal tagging of proteins at their endogenous loci, then generated pFA6a-kanMX6-Pmyo2-mEos2 for N-terminal tagging of Myo2p. We used PCR to amplify the coding sequence of mEos2 (Addgene; plasmid 20341) to replace the mEGFP coding sequence of pFA6a-mEGFP-kanMX6 and pFA6a-kanMX6-P41nmt1-mEGFP using the restriction sites PacI and AscI. We tagged cytokinesis proteins with mEos2 at their endogenous genetic loci; however, these cells exhibited growth or morphology defects potentially linked to the oligomerization of the fluorescent tag (Fig. S8) (32). Thus, we generated pFA6a-mEos3.2-kanMX6 and pFA6a-kanMX6-P(gene of interest)-mEos3.2 for C-terminal and N-terminal tagging of proteins at their endogenous loci. We replaced the mEGFP coding sequence of pFA6a-mEGFP-kanMX6 and the mCherry or mEGFP coding sequence of pFA6a-kanMX6-Pcdc15-mCherry, pFA6a-kanMX6-Pmyo2-mEGFP, and pFA6a-kanMX6-Prng2-mEGFP with the mEos3.2 sequence (32) by cloning into the PacI-AscI sites flanking the mCherry or mEGFP sequence.
Fig. S8.
Phenotypes of cells expressing contractile ring proteins fused to mEos2. (A) Growth of 2-µL samples of a 10-fold dilution series of cells at 25 °C and 36 °C for strains with Cdc12p and Rlc1p tagged with either mEos2 or mEos3.2. Samples were diluted 10-fold at each step. (B) Bright-field and fluorescence images of Cdc12p-mEos2 cells grown and imaged at 25 °C. The cells have septation defects and abnormal contractile rings marked with Cdc12p-mEos2. (C) Bright-field and fluorescence images of Cdc12p-mEos3.2 cells grown and imaged at 25 °C. The cells have normal contractile rings and no septation defects. (Scale bar: 5 µm.)
Table S1 lists the S. pombe strains used in this study. Strains were constructed by PCR-based gene targeting and confirmed by PCR (56). For tagging the C terminus of proteins with monomeric fluorescent proteins, DNA with the desired homologous flanking sequences was amplified from pFA6a-mEos3.2-kanMX6 plasmids. For N-terminal tagging of cdc15, rng2, and myo2, the pFA6a- kanMX6-P(gene of interest)-mEGFP plasmid was constructed as described previously (17, 47). The plasmids were verified by sequencing. Primers with 80 bp of gene-specific sequence (obtained using www.bahlerlab.info/resources/) were used to amplify the integration cassettes. Two repeats of GGA GGT were added to all insertions, creating a linker of four glycines between mEos3.2 (or mEos2) and the protein. The portions specific to the mEos2/mEos3.2 coding sequence were as follows: C-terminal tagging forward primer, ATGAGTGCGATTAAGCCAGAC; C-terminal tagging reverse primer, GAATTCGAGCTCGTTTAAA C; N-terminal tagging forward primer, GAATTCGAGCTCGTTTAAAC; and N-terminal tagging reverse primer, TCGTCTGGCATTGTCAGGCA. A plasmid with mEos3.2-CHD was integrated into the leu+ locus for expression under the control of a 41× nmt1 promoter. To express mEos3.2-CHD, cells were grown in EMM5S for 12–18 h before imaging. All genomic integrations were confirmed by PCR and fluorescence microscopy.
Table S1.
Yeast strains
| Strain | Genotype |
| CL 116 | h+ cdc12-mEos2-KanMX6 ade6-M216 his3-D1 leu1-32 ura4-D18 |
| CL 146 | h+ Rlc1-4Gly-mEos2 ade6-M216 his3-D1 leu1-32 ura4-D18 |
| IRT 195 | h- rlc1-4Gly-mEos3.2-KanMX6 |
| CL 206-1 | h+ rlc1-4Gly-mEos3.2-KanMX6 cdc25-22 |
| IRT 196 | h+ mid1-4Gly-mEos3.2-KanMX6 |
| IRT 197 | h+ cdc12-4Gly-mEos3.2-KanMX6 |
| IRT 198 | h+ KanMX6-Pcdc15-mEos3.2-4Gly-cdc15p |
| IRT 201 | h- KanMX6-Pcdc15-mEosS3.2-4Gly-cdc15 cdc25-22 |
| IRT 202-1 | h- mid1p-4Gly-mEos3.2-KanMX6 cdc25-22 |
| IRT 203-1 | cdc12-4Gly-mEos3.2-KanMX6 cdc25-22 |
| IRT 204 | h- myo2p-4Gly-mEos3.2-KanMX6 |
| IRT 205 | cdc15-4Gly-mEos3.2-KanMX6 |
| IRT 206 | cdc15-4Gly-mEos3.2-KanMX6 cdc25-22 |
| IRT 207 | h+ myo2p-4Gly-mEos3.2-KanMX6 cdc25-22 |
| IRT 208-5 | mid1-4Gly-mEos3.2-KanMX6 rlc1-mEos3.2-KanMX6 cdc25-22 |
| IRT 211 | h- 41xnmt-mEos3.2-CHD-leu+ |
| IRT 212 | h- 41xnmt-mEos3.2-CHD-leu+ cdc25-22 |
| CL242 | h+ KanMX6-Prng2-mEosS3.2-4Gly-rng2 ade6-M216 his3-D1 leu1-32 ura4-D18 |
| CL243 | h+ KanMX6-Pmyo2-mEosS3.2-4Gly-myo2 ade6-M216 his3-D1 leu1-32 ura4-D18 |
| CL248 | 41xnmt-mEos3.2-CHD-leu+ rlc1-4Gly-mEos3.2-KanMX6 cdc25-22 |
| CL 257 | KanMX6-Pmyo2-mEosS3.2-4Gly-myo2 cdc25-22 |
| CL259 | KanMX6-Prng2-mEosS3.2-4Gly-rng2 cdc25-22 |
| CL261 | mid1-4Gly-mEos3.2-KanMX6 cdc15-4Gly-mEos3.2-KanMX6 cdc25-22 |
| CL262 | cdc15-4Gly-mEos3.2-KanMX6 rlc1-4Gly-mEos3.2-KanMX6 cdc25-22 |
| CL263 | cdc15-4Gly-mEos3.2-KanMX myo2p-4Gly-mEos3.2-KanMX6 cdc25-22 |
| CL290 | 41xnmt-mEos3.2-CHD-leu+ KanMX6-Pmyo2-mEosS3.2-4Gly-myo2 cdc25-22 |
We used the temperature-sensitive cdc25-22 mutation to arrest cells at the G2/M transition at the restrictive temperature of 36 °C for 4 h, and then released cells synchronously into mitosis at the permissive temperature of 22 °C. Arrested and released cdc25-22 cells grew longer while arrested but were otherwise normal. To test whether arrested and released cdc25-22 cells contain the same number of nodes as WT cells, we measured the total amount of fluorescence in fully assembled but not constricted rings of cells expressing Rlc1p-3GFP. The total ring fluorescence was not significantly different in 41 WT cells and 35 arrested and released cdc25-22 cells (P = 0.6). Because all of the Rlc1p-3GFP is localized in nodes in this part of the cells, we conclude that WT and cdc25-22 arrested and released cells have the same number of nodes.
Spinning-Disk Confocal Microscopy and Data Analysis.
Cells were grown in exponential phase at 25 °C in YE5S-rich liquid medium in 50-mL flasks in the dark. Fluorescence images of live cells were acquired with an Olympus IX-71 microscope with a 100×/numerical aperture (NA) 1.4 Plan Apo lens (Olympus) and a CSU-X1 (Andor Technology) confocal spinning-disk confocal system equipped with an iXON-EMCCD camera (Andor Technology). Cells were concentrated 10- to 20-fold by centrifugation at 2,350 × g rpm for 30 s and then resuspended in EMM5S with 0.1 mM n-propyl-gallate (Sigma-Aldrich; P-3130) to reduce phototoxicity. The 10 μL of cells were mounted on a thin layer consisting of 30 μL 25% gelatin (Sigma-Aldrich; G-2500) in YE5S and 0.1 mM n-propyl-gallate, sealed under a coverslip with Valap, and observed at room temperature (∼23 °C).
Images were viewed in ImageJ (https://imagej.nih.gov/ij) and cropped in Adobe Photoshop. ImageJ was used to generate maximum intensity sum projection of Z-stacks of fluorescence images.
Super-resolution Data Acquisition and Display.
Super-resolution imaging was performed with a custom-built FPALM system (27, 28, 57) operating in 2D mode at 200 frames per second. We used epi illumination to photoconvert and excite the fluorophores through the entire cell. We imaged single molecules with an sCMOS camera (ORCA-Flash4.0; Hamamatsu) using HCimage software (Hamamatsu). Our localization algorithm eliminated out-of-focus emissions, providing an effective depth of field of ∼400 nm (Fig. S1F). The average laser power density of the 561-nm laser used to excite the photoconverted mEos3.2 for imaging was ∼1.2 kW/cm2 illuminating a ∼350 µm2 area, thus exposing the cells to ∼4.2 mW. The power of the 405-nm laser used for photoconversion was increased manually or with a computer-controlled ramp every 5 s during data acquisition, to maintain an optimal activation density of photoconverted mEos3.2 for single-molecule localization. The total power of the 405-nm laser ranged from 0.4 to 42 µW.
We confirmed that our imaging protocol did not delay the progress of cytokinesis. After exposing cells to our FPALM imaging protocol, we imaged them with differential interference contrast microscopy every 5 min and observed septum assembly and cell separation. We found 12 cells exposed to laser light and 10 control cells not exposed to laser light. All of these cells formed a septum and separated. A septum first appeared at the same time after release from cell cycle arrest in both laser-exposed cells and control cells (120 ± 10 min for laser-exposed cells and 119 ± 20 min for control cells). The interval between the first appearance of a septum and complete separation of the two daughter cells was not significantly different between cells exposed to laser light and cells not exposed to the light (92.5 ± 17 min vs. 98.3 ± 16 min; P = 0.6, Student’s t test).
Acquired frames were analyzed using a custom sCMOS-specific localization algorithm based on a maximum likelihood estimator (MLE) (27). A log-likelihood ratio was used as the rejection algorithm to filter out overlapping emitters, nonconverging fits, out-of-focus single molecules, and artifacts caused by rapid movements during one camera exposure time (27, 28). The accepted estimates were then reconstructed in a 2D histogram image of 5-nm pixels, where the integer value in each pixel represented the number of localization estimates within that pixel. To aid visualization of the 2D histogram images, they were convolved with a 2D Gaussian kernel (σ = 7.5 nm). Images were reconstructed from all or a subset of acquired frames and color-coded for either the temporal information or for localization density. Time-lapse images showing dynamics were generated by combining sequential 200-frame reconstructions. The time-lapse data were convolved with a 3D Gaussian kernel (σx = 1.5 pixels; σy = 1.5 pixels; σt = 1 s) to aid visualization in all three dimensions (Fig. S1C).
Calculation of Optical Field Depth.
The optical section thickness (OST) was defined by a rejection algorithm used in the single-molecule analysis. Emitters at different depths appear differently in the single-molecule image. The log-likehood ratio rejection algorithm (27, 28) detects these deviations from the assumed 2D Gaussian model and controls the effective OST in the reconstructed super-resolution image. To provide an estimate of the OST in our system, we simulated PSFs from our microscope using pixel size and numerical apertures matched to the imaging system. We used a vectorial pupil function method to take the high NA into account (58). We produced 1,000 simulated PSFs every 10 nm over a depth of 800 nm through the objective focus (81,000 simulated PSFs in total). To simulate detection noise, we added a background of four photons per pixel, applied a Poisson noise model, and calculated the average log-likelihood ratio values for each depth using a 2D Gaussian-based PSF model. We estimated our effective OST as 430 nm for a given log-likelihood ratio threshold of 80 (Fig. S1F). We used this threshold value consistently throughout the analysis of our experiments.
Node Identification and Measurements.
The cylindrical-shaped cells lay flat on the slide, and cytokinetic nodes and rings were associated with the inside of the plasma membrane, allowing for two views of the structures: in the plane of the plasma membrane, by focusing on the surface of the cell, and a side view, by focusing in the middle of the cell (Fig. 1H). Clusters of localized emitters distributed around the equator of the cells were manually selected from the reconstructed FPALM images into two different categories, face views and side views. Broad bands of nodes formed during prophase, and nodes remained stationary until node movements began during metaphase. For broadband nodes (prophase/metaphase cells), nodes were cropped from images reconstructed from 5,000 frames (25 s). Nodes in contractile rings were cropped from images reconstructed using 1,000 frames (5 s) to minimize blurring due to crowding and movement.
For analysis of nodes in contractile rings, we used rings that had constricted by 25–50% from a starting circumference of ∼11 µm down to 5.5–8.25 µm. Nodes in rings that were more constricted were packed very densely, and difficult to resolve owing to their crowding and motions. To minimize artifacts arising from curvature of the surface, the “face view” nodes were selected within ±16° of the cell’s midline. This segment corresponds to a band of 113 5-nm pixels or 565 nm of the surface of the cell in the super-resolution images. Selected nodes were cropped in a 309 × 309-nm box using a MATLAB routine.
Each localized emission contained the precise spatial and temporal information of a single mEos3.2 molecule. We exploited these data for quantitative measurements of the dimensions, ellipticity, and density distribution of each node (Fig. S3). The radial density distribution approach treats each single-molecule detection as an independent measurement and takes full advantage of the large amount of single-molecule information obtained in a live-cell FPALM experiment, making it much more robust for measuring dimensions compared with a line profile of fluorescence intensity at an arbitrary direction.
We reconstructed position estimates of the emitters in 2D histogram images from face views of isolated nodes obtained from the cropping step with pixel size of 2 nm to avoid pixelation errors in the subsequent measurement analysis. These images were then fit with a rotationally symmetric 2D Gaussian model with amplitude and sigma and center position in x and y as the fitting parameters. The radial symmetry centers of each node (59) were determined and used as the initial guesses for the x, y center in the fitting. MLE-based regression was performed assuming a Poisson noise model of the 2D histogram image using the Nelder–Mead simplex algorithm implemented in the MATLAB “fminsearch” function. Fitting estimates were filtered by their likelihood values thereafter. Fitting results that did not converge properly and resulted in center positions outside the image boundary or extremely large or small sigma values were also discarded from the final results. For each node accepted through the foregoing filtering process, the distances of individual localizations from the estimated node center were calculated. All distances measured from a specific node type and view were plotted into histograms and then subsequently normalized by their radius to give a radial density distribution. The number of localizations per identified node was recorded as well.
We used a two-sample KS test to compare the localizations of each pair of node proteins (Fig. S4 D–F). The null hypothesis is that the samples are drawn from the same distribution where the sample is the set of squared radial distances from the localized emitters to the estimated center of the corresponding node. The cumulative distribution functions (CDFs) of the squared radial distance were calculated for each of the samples (Fig. S4 A–C). The differences between pairs of CDFs were calculated, and the absolute value of the maximum difference is the two-sample KS statistic. The resulting statistic was compared with the critical value of the KS test at a significance level of 0.05. The null hypothesis was rejected if the KS statistic was larger than this critical value.
We calculated the radius of the zone occupied by each node marker from the CDF data as the distance from the center containing 75% of all localized emitters per node. We applied the bootstrap method, used with 10,000 trials of resampling with replacement from our measured single-molecule data, to provide a measure of confidence for the determined radius values (Fig. 2B): Cdc12p-mEos3.2, 27.1 ± 1.0 nm; Cdc15p-mEos3.2, 39.0 ± 0.6 nm; Myo2p-mEos3.2, 33.4 ± 0.5 nm; mEos3.2-Cdc15p, 27.0 ± 0.6 nm; mEos3.2-Rng2p, 34.2 ± 0.4 nm; mEos3.2-Myo2p, 50.5 ± 0.7 nm; and Rlc1p-mEos3.2, 47.8 ± 0.5 nm.
We measured the ellipticity of cropped nodes by fitting each node (formed by single localized emitters) with a multivariate Gaussian kernel and obtained σx, σy, and ρ values representing the SD of the Gaussian distribution in both axes and the correlation between them (Figs. S3 and S5). We created a covariance matrix from the foregoing three values and then calculated the eigenvalue to get the principal and minor axes of lengths a and b, where a > b. The ellipticity measurement was calculated as (a – b)/(a + b). A perfect circle has an ellipticity value of 0, whereas a linear ellipse has an ellipticity value close to 1.0 (34).
We determined the edge of the cytoplasm in reconstructed FPALM images of longitudinal sections of cells from scans of the numbers of localizations perpendicular to the edges of the cells (Fig. 4A and Fig. S2 C and D), as used by Clark et al. (60) to analyze confocal images.
Quantification of Localized Emitters.
We measured the total number of localized emitters per node for each marker. For broadband stationary nodes (prophase/metaphase cells), nodes were cropped from images reconstructed from 5,000 frames (25 s). Nodes in contractile rings were cropped from images reconstructed using 1,000 frames (5 s) to minimize blurring from crowding and movement. The number of localized emitters per node is influenced by the total number of frames used for the reconstruction, the photophysics (blinking properties) of the fluorescent proteins, and the number of tagged proteins per node. We compared the number of localized emitters obtained for mEos3.2-Cdc15p and Cdc15p-mEos3.2, as well as those obtained for mEos3.2-Myo2p, Myo2p-mEos3.2, and Rlc1p-mEos3.2. For broadband nodes, we found a comparable number of localized emitters for the N- and the C-terminal tagged Cdc15p and for the proteins labeling the myosin-II molecule. We likely found more variability in the measurement of localized emitters in ring nodes because we used only 1,000 frames and thus undersampled the counts per node (Fig. S1D, showing cumulative counts of localized emitters vs. time of reconstruction).
The current photoconvertible proteins designed for FPALM have overlapping emission spectra with maxima around 585 nm for the converted version of the protein. The nonconverted form emits with maxima around 520 nm overlapping with other photoactivatable proteins, such as PAmEGFP (emission maxima ∼510 nm). Therefore, colocalization with distinct color fluorescent proteins is currently unavailable for live-cell FPALM expressing endogenously tagged proteins. We used quantitative colocalization technique to determine the presence of pairs of tagged proteins within the same node structure. We found that the number of localized emitters per node in cells expressing pairs of mEos3.2- tagged node proteins was additive, justifying our approach.
Photobleaching Analysis.
To generate the emission history for a node, we collected localization events within 50 nm of the estimated node center as a binary array in which each element corresponded to one camera frame and contained 0 or 1 to indicate whether or not an emitter had been localized. This array was then smoothed by a Gaussian kernel with σ = 3 frames to reduce noise before calculating the autocorrelation function (ACF). The ACF for each marker was the average of the ACFs of each node in the sample. These ACFs show the blinking of individual emitters on a millisecond time scale and emitter bleaching over a few seconds (Fig. S1E).
The ACF curves show that the half-time for bleaching of individual emitters was just 1–2 s, but the photoconversion, detection, and bleaching of these individual emitters was spread out over ∼25 s (Fig. S1B), because only photoconverted molecules could be detected and photobleached. To compensate for the depletion of the pool of unconverted mEos3.2, we ramped up the photoconversion laser power over the course of imaging to maintain a high density of fluorescent molecules. This higher power of the photoconversion laser over time increased the probability that the declining population of dark molecules was activated until the sample was completely photobleached.
Simulation of Confocal Images from FPALM Images.
We simulated confocal images from FPALM datasets by convolving each localized emitter in the 2D histogram images with a 2D Gaussian kernel equivalent to the point spread function of our spinning-disk confocal microscope (SD of the Gaussian function used to fit a PSF to our FPALM system, σPSF, ∼134 nm) and matching the pixel size to that of images acquired with our EMCCD camera used for spinning-disk confocal microscopy. We counted the number of FPALM nodes in each diffraction-limited spot of the confocal simulated images.
Summary of Biochemical Interactions.
The protein interaction map in Fig. 4B is based on published reports of immunoprecipitation and biochemical binding experiments. Anilin Mid1p interacts directly with IQGAP Rng2p and F-BAR Cdc15p (22, 41, 61–65). Rng2p interacts with Cdc15p (66) and the end of the Myo2p tail (22). The N terminus of Cdc15p interacts with formin Cdc12p (67, 68), its F-BAR domain interacts with membrane lipids, and its C-terminal SH3 domain extends into the cytoplasm. Homodimeric formin Cdc12p polymerizes unbranched actin filaments (69, 70). Our observations validate the main features of a model described by Laporte et al. (22) based on fluorescence distance measurements, and add the important feature that the myosin II heads occupy a hemisphere rather than being oriented rigidly at an average angle of 71° from the inner surface of the plasma membrane.
Supplementary Material
Acknowledgments
We thank Matthew Akamatsu, Julien Berro, Moon Chatterjee, Steven Chou, Edward Lemke, Yu Lin, Shalinin Nag, Ben O’Shaughnessy, Shambaditya Saha, Dimtrios Vavylonis, Jian-Qiu Wu, and Yongdeng Zhang for helpful discussions and advice. This research was supported by NIH National Institute of General Medical Sciences Grant R01 GM026132 (to T.D.P.), Wellcome Trust Grant 095927/A/11/Z (to J.B.), a James Hudson Brown–Alexander Brown Coxe postdoctoral fellowship (to F.H.), and a Human Frontier Science Program long-term fellowship (to C.L.). The content is solely the responsibility of the authors and does not necessarily represent the official views of the National Institutes of Health.
Footnotes
Conflict of interest statement: J.B. has a significant financial interest in Bruker Corporation, and J.B. and F.H. have a significant financial interest in Hamamatsu Photonics.
This article is a PNAS Direct Submission.
This article contains supporting information online at www.pnas.org/lookup/suppl/doi:10.1073/pnas.1608252113/-/DCSupplemental.
References
- 1.Odronitz F, Kollmar M. Drawing the tree of eukaryotic life based on the analysis of 2,269 manually annotated myosins from 328 species. Genome Biol. 2007;8(9):R196. doi: 10.1186/gb-2007-8-9-r196. [DOI] [PMC free article] [PubMed] [Google Scholar]
- 2.Maupin P, Pollard TD. Arrangement of actin filaments and myosin-like filaments in the contractile ring and of actin-like filaments in the mitotic spindle of dividing HeLa cells. J Ultrastruct Mol Struct Res. 1986;94(1):92–103. doi: 10.1016/0889-1605(86)90055-8. [DOI] [PubMed] [Google Scholar]
- 3.Schroeder TE. Actin in dividing cells: Contractile ring filaments bind heavy meromyosin. Proc Natl Acad Sci USA. 1973;70(6):1688–1692. doi: 10.1073/pnas.70.6.1688. [DOI] [PMC free article] [PubMed] [Google Scholar]
- 4.Kamasaki T, Osumi M, Mabuchi I. Three-dimensional arrangement of F-actin in the contractile ring of fission yeast. J Cell Biol. 2007;178(5):765–771. doi: 10.1083/jcb.200612018. [DOI] [PMC free article] [PubMed] [Google Scholar]
- 5.Kanbe T, Kobayashi I, Tanaka K. Dynamics of cytoplasmic organelles in the cell cycle of the fission yeast Schizosaccharomyces pombe: Three-dimensional reconstruction from serial sections. J Cell Sci. 1989;94(Pt 4):647–656. doi: 10.1242/jcs.94.4.647. [DOI] [PubMed] [Google Scholar]
- 6.Fujiwara K, Pollard TD. Fluorescent antibody localization of myosin in the cytoplasm, cleavage furrow, and mitotic spindle of human cells. J Cell Biol. 1976;71(3):848–875. doi: 10.1083/jcb.71.3.848. [DOI] [PMC free article] [PubMed] [Google Scholar]
- 7.De Lozanne A, Spudich JA. Disruption of the Dictyostelium myosin heavy chain gene by homologous recombination. Science. 1987;236(4805):1086–1091. doi: 10.1126/science.3576222. [DOI] [PubMed] [Google Scholar]
- 8.Mabuchi I, Okuno M. The effect of myosin antibody on the division of starfish blastomeres. J Cell Biol. 1977;74(1):251–263. doi: 10.1083/jcb.74.1.251. [DOI] [PMC free article] [PubMed] [Google Scholar]
- 9.Sanger JM, Sanger JW. Banding and polarity of actin filaments in interphase and cleaving cells. J Cell Biol. 1980;86(2):568–575. doi: 10.1083/jcb.86.2.568. [DOI] [PMC free article] [PubMed] [Google Scholar]
- 10.Beach JR, et al. Nonmuscle myosin II isoforms coassemble in living cells. Curr Biol. 2014;24(10):1160–1166. doi: 10.1016/j.cub.2014.03.071. [DOI] [PMC free article] [PubMed] [Google Scholar]
- 11.Field CM, Alberts BM. Anillin, a contractile ring protein that cycles from the nucleus to the cell cortex. J Cell Biol. 1995;131(1):165–178. doi: 10.1083/jcb.131.1.165. [DOI] [PMC free article] [PubMed] [Google Scholar]
- 12.Epp JA, Chant J. An IQGAP-related protein controls actin-ring formation and cytokinesis in yeast. Curr Biol. 1997;7(12):921–929. doi: 10.1016/s0960-9822(06)00411-8. [DOI] [PubMed] [Google Scholar]
- 13.Castrillon DH, Wasserman SA. Diaphanous is required for cytokinesis in Drosophila and shares domains of similarity with the products of the limb deformity gene. Development. 1994;120(12):3367–3377. doi: 10.1242/dev.120.12.3367. [DOI] [PubMed] [Google Scholar]
- 14.Fujiwara K, Porter ME, Pollard TD. Alpha-actinin localization in the cleavage furrow during cytokinesis. J Cell Biol. 1978;79(1):268–275. doi: 10.1083/jcb.79.1.268. [DOI] [PMC free article] [PubMed] [Google Scholar]
- 15.Fankhauser C, et al. The S. pombe cdc15 gene is a key element in the reorganization of F-actin at mitosis. Cell. 1995;82(3):435–444. doi: 10.1016/0092-8674(95)90432-8. [DOI] [PubMed] [Google Scholar]
- 16.Willet AH, McDonald NA, Gould KL. Regulation of contractile ring formation and septation in Schizosaccharomyces pombe. Curr Opin Microbiol. 2015;28:46–52. doi: 10.1016/j.mib.2015.08.001. [DOI] [PMC free article] [PubMed] [Google Scholar]
- 17.Wu JQ, Pollard TD. Counting cytokinesis proteins globally and locally in fission yeast. Science. 2005;310(5746):310–314. doi: 10.1126/science.1113230. [DOI] [PubMed] [Google Scholar]
- 18.Wu JQ, Kuhn JR, Kovar DR, Pollard TD. Spatial and temporal pathway for assembly and constriction of the contractile ring in fission yeast cytokinesis. Dev Cell. 2003;5(5):723–734. doi: 10.1016/s1534-5807(03)00324-1. [DOI] [PubMed] [Google Scholar]
- 19.Wu JQ, et al. Assembly of the cytokinetic contractile ring from a broad band of nodes in fission yeast. J Cell Biol. 2006;174(3):391–402. doi: 10.1083/jcb.200602032. [DOI] [PMC free article] [PubMed] [Google Scholar]
- 20.Vavylonis D, Wu JQ, Hao S, O’Shaughnessy B, Pollard TD. Assembly mechanism of the contractile ring for cytokinesis by fission yeast. Science. 2008;319(5859):97–100. doi: 10.1126/science.1151086. [DOI] [PubMed] [Google Scholar]
- 21.Stachowiak MR, et al. Mechanism of cytokinetic contractile ring constriction in fission yeast. Dev Cell. 2014;29(5):547–561. doi: 10.1016/j.devcel.2014.04.021. [DOI] [PMC free article] [PubMed] [Google Scholar]
- 22.Laporte D, Coffman VC, Lee IJ, Wu JQ. Assembly and architecture of precursor nodes during fission yeast cytokinesis. J Cell Biol. 2011;192(6):1005–1021. doi: 10.1083/jcb.201008171. [DOI] [PMC free article] [PubMed] [Google Scholar]
- 23.Betzig E, et al. Imaging intracellular fluorescent proteins at nanometer resolution. Science. 2006;313(5793):1642–1645. doi: 10.1126/science.1127344. [DOI] [PubMed] [Google Scholar]
- 24.Hess ST, Girirajan TP, Mason MD. Ultra-high resolution imaging by fluorescence photoactivation localization microscopy. Biophys J. 2006;91(11):4258–4272. doi: 10.1529/biophysj.106.091116. [DOI] [PMC free article] [PubMed] [Google Scholar]
- 25.Rust MJ, Bates M, Zhuang X. Sub-diffraction-limit imaging by stochastic optical reconstruction microscopy (STORM) Nat Methods. 2006;3(10):793–795. doi: 10.1038/nmeth929. [DOI] [PMC free article] [PubMed] [Google Scholar]
- 26.Hess ST, et al. Dynamic clustered distribution of hemagglutinin resolved at 40 nm in living cell membranes discriminates between raft theories. Proc Natl Acad Sci USA. 2007;104(44):17370–17375. doi: 10.1073/pnas.0708066104. [DOI] [PMC free article] [PubMed] [Google Scholar]
- 27.Huang F, et al. Video-rate nanoscopy using sCMOS camera-specific single-molecule localization algorithms. Nat Methods. 2013;10(7):653–658. doi: 10.1038/nmeth.2488. [DOI] [PMC free article] [PubMed] [Google Scholar]
- 28.Huang F, Schwartz SL, Byars JM, Lidke KA. Simultaneous multiple-emitter fitting for single molecule super-resolution imaging. Biomed Opt Express. 2011;2(5):1377–1393. doi: 10.1364/BOE.2.001377. [DOI] [PMC free article] [PubMed] [Google Scholar]
- 29.Jones SA, Shim SH, He J, Zhuang X. Fast, three-dimensional super-resolution imaging of live cells. Nat Methods. 2011;8(6):499–508. doi: 10.1038/nmeth.1605. [DOI] [PMC free article] [PubMed] [Google Scholar]
- 30.Manley S, et al. High-density mapping of single-molecule trajectories with photoactivated localization microscopy. Nat Methods. 2008;5(2):155–157. doi: 10.1038/nmeth.1176. [DOI] [PubMed] [Google Scholar]
- 31.Shim SH, et al. Super-resolution fluorescence imaging of organelles in live cells with photoswitchable membrane probes. Proc Natl Acad Sci USA. 2012;109(35):13978–13983. doi: 10.1073/pnas.1201882109. [DOI] [PMC free article] [PubMed] [Google Scholar]
- 32.Zhang M, et al. Rational design of true monomeric and bright photoactivatable fluorescent proteins. Nat Methods. 2012;9(7):727–729. doi: 10.1038/nmeth.2021. [DOI] [PubMed] [Google Scholar]
- 33.Laplante C, Huang F, Bewersdorf J, Pollard TD. High-Speed Super-Resolution Imaging of Live Fission Yeast Cells. Methods Mol Biol. 2016;1369:45–57. doi: 10.1007/978-1-4939-3145-3_4. [DOI] [PMC free article] [PubMed] [Google Scholar]
- 34.Huang B, Wang W, Bates M, Zhuang X. Three-dimensional super-resolution imaging by stochastic optical reconstruction microscopy. Science. 2008;319(5864):810–813. doi: 10.1126/science.1153529. [DOI] [PMC free article] [PubMed] [Google Scholar]
- 35.Le Goff X, Motegi F, Salimova E, Mabuchi I, Simanis V. The S. pombe rlc1 gene encodes a putative myosin regulatory light chain that binds the type II myosins myo3p and myo2p. J Cell Sci. 2000;113(Pt 23):4157–4163. doi: 10.1242/jcs.113.23.4157. [DOI] [PubMed] [Google Scholar]
- 36.Lord M, Pollard TD. UCS protein Rng3p activates actin filament gliding by fission yeast myosin-II. J Cell Biol. 2004;167(2):315–325. doi: 10.1083/jcb.200404045. [DOI] [PMC free article] [PubMed] [Google Scholar]
- 37.McCollum D, Balasubramanian MK, Pelcher LE, Hemmingsen SM, Gould KL. Schizosaccharomyces pombe cdc4+ gene encodes a novel EF-hand protein essential for cytokinesis. J Cell Biol. 1995;130(3):651–660. doi: 10.1083/jcb.130.3.651. [DOI] [PMC free article] [PubMed] [Google Scholar]
- 38.Naqvi NI, Wong KC, Tang X, Balasubramanian MK. Type II myosin regulatory light chain relieves auto-inhibition of myosin-heavy-chain function. Nat Cell Biol. 2000;2(11):855–858. doi: 10.1038/35041107. [DOI] [PubMed] [Google Scholar]
- 39.Bezanilla M, Pollard TD. Myosin-II tails confer unique functions in Schizosaccharomyces pombe: Characterization of a novel myosin-II tail. Mol Biol Cell. 2000;11(1):79–91. doi: 10.1091/mbc.11.1.79. [DOI] [PMC free article] [PubMed] [Google Scholar]
- 40.Coffman VC, Nile AH, Lee IJ, Liu H, Wu JQ. Roles of formin nodes and myosin motor activity in Mid1p-dependent contractile-ring assembly during fission yeast cytokinesis. Mol Biol Cell. 2009;20(24):5195–5210. doi: 10.1091/mbc.E09-05-0428. [DOI] [PMC free article] [PubMed] [Google Scholar]
- 41.Saha S, Pollard TD. Anillin-related protein Mid1p coordinates the assembly of the cytokinetic contractile ring in fission yeast. Mol Biol Cell. 2012;23(20):3982–3992. doi: 10.1091/mbc.E12-07-0535. [DOI] [PMC free article] [PubMed] [Google Scholar]
- 42.Coffman VC, Wu P, Parthun MR, Wu JQ. CENP-A exceeds microtubule attachment sites in centromere clusters of both budding and fission yeast. J Cell Biol. 2011;195(4):563–572. doi: 10.1083/jcb.201106078. [DOI] [PMC free article] [PubMed] [Google Scholar]
- 43.Chen Q, Nag S, Pollard TD. Formins filter modified actin subunits during processive elongation. J Struct Biol. 2012;177(1):32–39. doi: 10.1016/j.jsb.2011.10.005. [DOI] [PMC free article] [PubMed] [Google Scholar]
- 44.Wachtler V, Rajagopalan S, Balasubramanian MK. Sterol-rich plasma membrane domains in the fission yeast Schizosaccharomyces pombe. J Cell Sci. 2003;116(Pt 5):867–874. doi: 10.1242/jcs.00299. [DOI] [PubMed] [Google Scholar]
- 45.Tebbs IR, Pollard TD. Separate roles of IQGAP Rng2p in forming and constricting the Schizosaccharomyces pombe cytokinetic contractile ring. Mol Biol Cell. 2013;24(12):1904–1917. doi: 10.1091/mbc.E12-10-0775. [DOI] [PMC free article] [PubMed] [Google Scholar]
- 46.Pelham RJ, Chang F. Actin dynamics in the contractile ring during cytokinesis in fission yeast. Nature. 2002;419(6902):82–86. doi: 10.1038/nature00999. [DOI] [PubMed] [Google Scholar]
- 47.Laplante C, et al. Three myosins contribute uniquely to the assembly and constriction of the fission yeast cytokinetic contractile ring. Curr Biol. 2015;25(15):1955–1965. doi: 10.1016/j.cub.2015.06.018. [DOI] [PMC free article] [PubMed] [Google Scholar]
- 48.Bezanilla M, Wilson JM, Pollard TD. Fission yeast myosin-II isoforms assemble into contractile rings at distinct times during mitosis. Curr Biol. 2000;10(7):397–400. doi: 10.1016/s0960-9822(00)00420-6. [DOI] [PubMed] [Google Scholar]
- 49.Pollard TD. Electron microscopy of synthetic myosin filaments: Evidence for cross-bridge flexibility and copolymer formation. J Cell Biol. 1975;67(1):93–104. doi: 10.1083/jcb.67.1.93. [DOI] [PMC free article] [PubMed] [Google Scholar]
- 50.Billington N, Wang A, Mao J, Adelstein RS, Sellers JR. Characterization of three full-length human nonmuscle myosin II paralogs. J Biol Chem. 2013;288(46):33398–33410. doi: 10.1074/jbc.M113.499848. [DOI] [PMC free article] [PubMed] [Google Scholar]
- 51.Berlin A, Paoletti A, Chang F. Mid2p stabilizes septin rings during cytokinesis in fission yeast. J Cell Biol. 2003;160(7):1083–1092. doi: 10.1083/jcb.200212016. [DOI] [PMC free article] [PubMed] [Google Scholar]
- 52.Tasto JJ, Morrell JL, Gould KL. An anillin homologue, Mid2p, acts during fission yeast cytokinesis to organize the septin ring and promote cell separation. J Cell Biol. 2003;160(7):1093–1103. doi: 10.1083/jcb.200211126. [DOI] [PMC free article] [PubMed] [Google Scholar]
- 53.Straight AF, Field CM, Mitchison TJ. Anillin binds nonmuscle myosin II and regulates the contractile ring. Mol Biol Cell. 2005;16(1):193–201. doi: 10.1091/mbc.E04-08-0758. [DOI] [PMC free article] [PubMed] [Google Scholar]
- 54.Werner M, Munro E, Glotzer M. Astral signals spatially bias cortical myosin recruitment to break symmetry and promote cytokinesis. Curr Biol. 2007;17(15):1286–1297. doi: 10.1016/j.cub.2007.06.070. [DOI] [PMC free article] [PubMed] [Google Scholar]
- 55.Zhou M, Wang YL. Distinct pathways for the early recruitment of myosin II and actin to the cytokinetic furrow. Mol Biol Cell. 2008;19(1):318–326. doi: 10.1091/mbc.E07-08-0783. [DOI] [PMC free article] [PubMed] [Google Scholar]
- 56.Bähler J, et al. Heterologous modules for efficient and versatile PCR-based gene targeting in Schizosaccharomyces pombe. Yeast. 1998;14(10):943–951. doi: 10.1002/(SICI)1097-0061(199807)14:10<943::AID-YEA292>3.0.CO;2-Y. [DOI] [PubMed] [Google Scholar]
- 57.Juette MF, et al. Three-dimensional sub-100 nm resolution fluorescence microscopy of thick samples. Nat Methods. 2008;5(6):527–529. doi: 10.1038/nmeth.1211. [DOI] [PubMed] [Google Scholar]
- 58.Hanser BM, Gustafsson MG, Agard DA, Sedat JW. Phase-retrieved pupil functions in wide-field fluorescence microscopy. J Microsc. 2004;216(Pt 1):32–48. doi: 10.1111/j.0022-2720.2004.01393.x. [DOI] [PubMed] [Google Scholar]
- 59.Parthasarathy R. Rapid, accurate particle tracking by calculation of radial symmetry centers. Nat Methods. 2012;9(7):724–726. doi: 10.1038/nmeth.2071. [DOI] [PubMed] [Google Scholar]
- 60.Clark AG, Dierkes K, Paluch EK. Monitoring actin cortex thickness in live cells. Biophys J. 2013;105(3):570–580. doi: 10.1016/j.bpj.2013.05.057. [DOI] [PMC free article] [PubMed] [Google Scholar]
- 61.Celton-Morizur S, Bordes N, Fraisier V, Tran PT, Paoletti A. C-terminal anchoring of mid1p to membranes stabilizes cytokinetic ring position in early mitosis in fission yeast. Mol Cell Biol. 2004;24(24):10621–10635. doi: 10.1128/MCB.24.24.10621-10635.2004. [DOI] [PMC free article] [PubMed] [Google Scholar]
- 62.Hachet O, Simanis V. Mid1p/anillin and the septation initiation network orchestrate contractile ring assembly for cytokinesis. Genes Dev. 2008;22(22):3205–3216. doi: 10.1101/gad.1697208. [DOI] [PMC free article] [PubMed] [Google Scholar]
- 63.Huang Y, Yan H, Balasubramanian MK. Assembly of normal actomyosin rings in the absence of Mid1p and cortical nodes in fission yeast. J Cell Biol. 2008;183(6):979–988. doi: 10.1083/jcb.200806151. [DOI] [PMC free article] [PubMed] [Google Scholar]
- 64.Paoletti A, Chang F. Analysis of mid1p, a protein required for placement of the cell division site, reveals a link between the nucleus and the cell surface in fission yeast. Mol Biol Cell. 2000;11(8):2757–2773. doi: 10.1091/mbc.11.8.2757. [DOI] [PMC free article] [PubMed] [Google Scholar]
- 65.Saha S, Pollard TD. Characterization of structural and functional domains of the anillin-related protein Mid1p that contribute to cytokinesis in fission yeast. Mol Biol Cell. 2012;23(20):3993–4007. doi: 10.1091/mbc.E12-07-0536. [DOI] [PMC free article] [PubMed] [Google Scholar]
- 66.Roberts-Galbraith RH, Chen JS, Wang J, Gould KL. The SH3 domains of two PCH family members cooperate in assembly of the Schizosaccharomyces pombe contractile ring. J Cell Biol. 2009;184(1):113–127. doi: 10.1083/jcb.200806044. [DOI] [PMC free article] [PubMed] [Google Scholar]
- 67.Carnahan RH, Gould KL. The PCH family protein, Cdc15p, recruits two F-actin nucleation pathways to coordinate cytokinetic actin ring formation in Schizosaccharomyces pombe. J Cell Biol. 2003;162(5):851–862. doi: 10.1083/jcb.200305012. [DOI] [PMC free article] [PubMed] [Google Scholar]
- 68.Willet AH, et al. The F-BAR Cdc15 promotes contractile ring formation through the direct recruitment of the formin Cdc12. J Cell Biol. 2015;208(4):391–399. doi: 10.1083/jcb.201411097. [DOI] [PMC free article] [PubMed] [Google Scholar]
- 69.Chang F, Woollard A, Nurse P. Isolation and characterization of fission yeast mutants defective in the assembly and placement of the contractile actin ring. J Cell Sci. 1996;109(Pt 1):131–142. doi: 10.1242/jcs.109.1.131. [DOI] [PubMed] [Google Scholar]
- 70.Kovar DR, Kuhn JR, Tichy AL, Pollard TD. The fission yeast cytokinesis formin Cdc12p is a barbed end actin filament capping protein gated by profilin. J Cell Biol. 2003;161(5):875–887. doi: 10.1083/jcb.200211078. [DOI] [PMC free article] [PubMed] [Google Scholar]
Associated Data
This section collects any data citations, data availability statements, or supplementary materials included in this article.


