Significance
Organelles engage in heterotypic interactions crucial for metabolic and signaling cascades. The best-studied case of this heterotypic interaction is that between the mitochondria and endoplasmic reticulum (ER), crucial for transfer of lipids and especially Ca2+ between the two organelles. The original discovery that the mitochondria-shaping protein Mitofusin 2 (Mfn2) physically tethers the ER to mitochondria was recently challenged. Here, electron microscopy and fluorescent probes of organelle proximity provide definitive evidence that constitutive or acute Mfn2 ablation increases the distance between the ER and mitochondria. Functionally, this process reduces mitochondrial Ca2+ uptake without altering the mitochondrial Ca2+ uniporter complex in multiple tissues. Thus, the discoveries of the role of ER–mitochondria juxtaposition in cell biology based on Mfn2 as a tool remain unchallenged.
Keywords: mitochondria, Mfn2, Ca2+, tethering, interorganellar communication
Abstract
The discovery of the multiple roles of mitochondria–endoplasmic reticulum (ER) juxtaposition in cell biology often relied upon the exploitation of Mitofusin (Mfn) 2 as an ER–mitochondria tether. However, this established Mfn2 function was recently questioned, calling for a critical re-evaluation of Mfn2’s role in ER–mitochondria cross-talk. Electron microscopy and fluorescence-based probes of organelle proximity confirmed that ER–mitochondria juxtaposition was reduced by constitutive or acute Mfn2 deletion. Functionally, mitochondrial uptake of Ca2+ released from the ER was reduced following acute Mfn2 ablation, as well as in Mfn2−/− cells overexpressing the mitochondrial calcium uniporter. Mitochondrial Ca2+ uptake rate and extent were normal in isolated Mfn2−/− liver mitochondria, consistent with the finding that acute or chronic Mfn2 ablation or overexpression did not alter mitochondrial calcium uniporter complex component levels. Hence, Mfn2 stands as a bona fide ER–mitochondria tether whose ablation decreases interorganellar juxtaposition and communication.
The endoplasmic reticulum (ER) and mitochondria are physically coupled to control mitochondrial Ca2+ uptake, lipid transfer, autophagosome formation, ER stress, and apoptosis (1–6). Juxtaposition is mediated by protein structures that can be visualized in electron microscopy (EM) and electron tomography (ET) studies. These physical tethers span 6–15 nm when connecting smooth, and 19–30 nm when connecting rough ER to mitochondria (7). Operationally, an ER–mitochondria tether should fulfill at least these minimal criteria: (i) it is retrieved on the outer mitochondrial membrane (OMM); (ii) it is retrieved in mitochondria-associated ER membranes, the ER subdomain involved in interaction with mitochondria; (iii) it interacts in trans with a homo- or heterotypic interactor on the opposing membrane; (iv) its deletion increases the distance between the ER and mitochondria; or (v) its deletion reduces exchange of Ca2+ and lipids between the ER and mitochondria.
The molecular nature of ER–mitochondria tethers remained elusive for many years. The scaffold protein PACS2 (phosphofurin acidic cluster sorting protein 2) modulates their extent (8), and they include the heterotypic association between the inositol triphosphate (IP3) receptor on the ER and the OMM voltage-dependent anion channel (9). Another protein that fulfils the operational criteria to be defined as a tether is Mitofusin 2 (Mfn2). This OMM profusion protein is also retrieved in mitochondria-associated ER membranes and ER Mfn2 interacts in trans with Mfn1 or Mfn2 on the mitochondria to physically tether the organelles. Mfn2 ablation increases the distance between the ER and mitochondria and decreases agonist-evoked Ca2+ transfer from the ER to mitochondria (10) that depends on the generation of high Ca2+ microdomains at their interface (11, 12). The role of Mfn2 as a tether was confirmed independently in the heart (13), in pro-opiomelanocortin neurons (14), and in the liver (15). Mfn2-dependent tethering is regulated by posttranslational modifications: nondegradative Mfn2 ubiquitination by the E3 ligase MITOL reduces ER–mitochondria tethering and Ca2+ transfer without affecting mitochondrial or ER morphology (16). Furthermore, Mfn2 deletion impacts other facets of ER–mitochondria communication, like phosphatidylcholine (6) and cholesterol (17, 18) transfer to the mitochondria. Finally, Mfn2 was found to be specifically enriched by immunoelectron microscopy at the interface between mitochondria and the ER, as well as other organelles heterotypically tethered to the mitochondria, like melanosomes and lipid droplets (19, 20). Structurally, homo- or heterotypic in trans interaction between the ER–Mfn2 and mitochondrial Mfn2 or Mfn1 are supported by Mfn2’s role in mitochondrial tethering and fusion (21). Mfn2 ER–mitochondria tethering function is not conserved among all eukaryotes. In the yeast Saccharomyces cerevisiae, the ER–mitochondria tether complex ER–mitochondria encounter structure (22) and ER membrane protein complex (23) function independently of the ancestral single yeast mitofusin and are formed by proteins located on the ER and on the OMM. Conversely, in higher nonmammalian eukaryotes Mfn2 does mediate ER–mitochondria cross-talk. For example, ER stress is a major causative component of the pathology caused by the deletion of the single Drosophila melanogaster mitofusin (Marf) (24), and Marf ablation is complemented by mammalian Mfn2 (but not Mfn1) (20, 24).
Despite evidence by multiple laboratories, Mfn2 ER–mitochondria tether function was recently challenged in two studies (25, 26). Morphometric EM analyses indicated an increase in the mitochondrial surface closely juxtaposed to the ER when Mfn2 was lost, with a corresponding increase in Ca2+ transfer between the two organelles when Mfn2 was acutely ablated. In cells where Mfn2 was chronically deleted, the decreased mitochondrial Ca2+ uptake upon agonist-mediated ER Ca2+ release was attributed to the reduced mitochondrial Ca2+ uniporter (MCU) levels. Because these studies challenge two criteria fulfilled by Mfn2 to be considered as an ER–mitochondria tether, we decided to critically re-evaluate if chronic or acute Mfn2 ablation impacts on ER–mitochondria proximity and Ca2+ transfer. Morphometric analysis of mitochondrial surface juxtaposition to the ER, unbiased fluorescent probes of ER–mitochondrial proximity, novel cellular models of acute Mfn2 genetic ablation, biochemical and genetic analyses of MCU complex components, and Ca2+ uptake measurement in purified mitochondria corroborate the wealth of evidence indicating that Mfn2 tethers the ER to mitochondria.
Results and Discussion
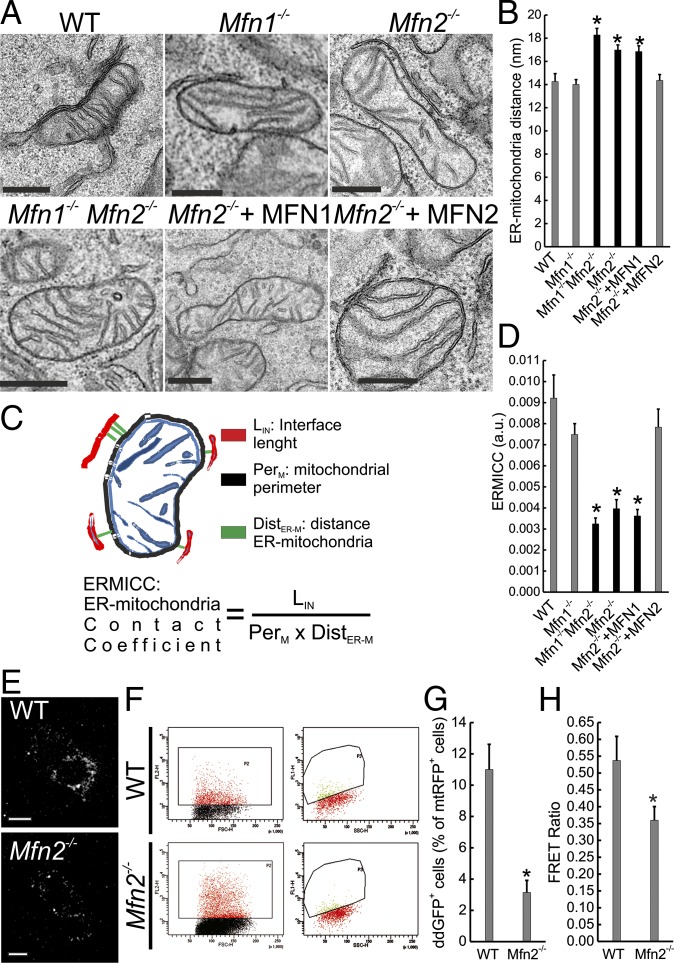
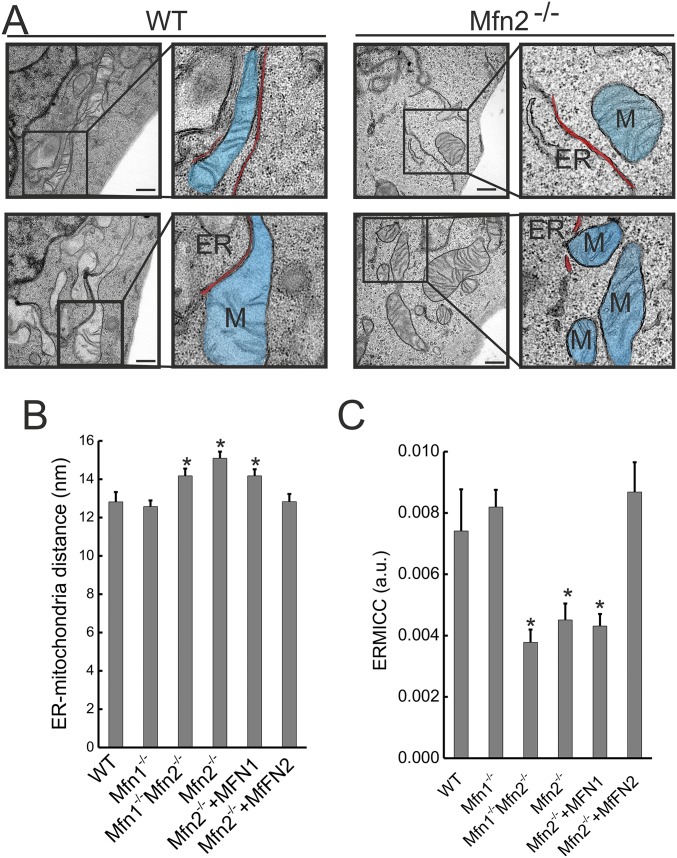
To compare our previous observation that Mfn2 tethers the ER to mitochondria with recent EM data questioning this result, we analyzed by EM the effect of Mfn2 ablation in mouse embryonic fibroblasts (MEFs). Visual inspection of EM images acquired by facility personnel blinded to sample identity revealed that Mfn2 and combined double Mfn1,Mfn2 but not Mfn1 ablation increased the distance between ER cisternae and mitochondria. The defect was specific because reintroduction of MFN2 but not of MFN1 recovered the close juxtaposition between the two organelles (Fig. 1A). Tethers identified in ET span from a minimum of 9 to a maximum of 30 nm (7). We therefore measured the average distance between mitochondria and the ER located within 30 nm from the former (see Fig. S1A for more examples of images and presentation of how the organelles were identified). Morphometric analysis of 200 interactions per condition revealed that Mfn2 and combined double Mfn1,Mfn2 but not Mfn1 ablation resulted in an ∼20% increase in the distance between the organelles, specifically recovered by MFN2 reintroduction in Mfn2−/− MEFs (Fig. 1B). This increase was also confirmed when we analyzed ER membranes located <20 nm from mitochondria (Fig. S1B). Our initial analysis did not correct for changes in mitochondrial surface and perimeter that could be caused by Mfn2 ablation. Mitochondrial surface increases were indeed deemed to artificially decrease Pearson’s and Manders’ indices of colocalization based on individual pixel channel overlap, and therefore to account for the tethering reduction measured in Mfn2−/− cells by confocal microscopy. As a proof of this concept, in a simulation experiment an ∼10% decrease in the Manders’ coefficient was achieved by a computational ∼70% increase in the surface of the mitochondrial object. Conversely, mitochondrial surface–ER juxtaposition measured by confocal microscopy was reduced by ∼10–15% in MEFs upon Mfn2-mediated changes in mitochondrial morphology (26).
Fig. 1.
Mfn2 ablation increases ER–mitochondria distance. (A) Representative EM images of MEFs of the indicated genotype. Where indicated, Mfn2−/− MEFs were cotransfected with GFP and the indicated plasmid, sorted and processed for EM. (Scale bars, 500 nm.) (B) Mean ± SEM of mitochondria–ER distance calculated in five independent experiments as in A. *P < 0.05 vs. WT. (C) A cartoon of the ERMICC contact index. (D) Mean ± SEM of ERMICC calculated from five independent experiments performed as in A. *P < 0.05 vs. WT. (E) Representative confocal images of the ER–mitochondria ddGFP fluorescence in MEFs of the indicated genotype. (Scale bars, 30 μm.) (F) Dot plots of ddGFP fluorescence in cells of the indicated genotype cotransfected with ddGFP monomers and cytosolic dsRED. (Left) Scatterplots of the gated dsRED+ cells. (Right) ddGFP+ dsRED+ population. (G) Mean ± SEM of ddGFP+ events in MEFs of the indicated genotype in three independent experiments as in F. *P < 0.05 vs. WT. (H) Mean ± SEM of five independent experiments of FEMP measurement of ER–mitochondria contacts in MEFs of the indicated genotype. *P < 0.05 vs. WT.
Fig. S1.
Mfn2 ablation increases ER-mitochondria distance. (A) Representative EM images of MEFs of WT MEF and Mfn2 −/− cells. Boxes denotes 2.5× zoomed-in region. M, mitochondria. Organelles are marked using pseudocolored overlay masks. (Scale bars, 500 nm.) (B) Morphometric analysis of ER located at less than 20 nm from mitochondria calculated from 70 images per condition with >5 mitochondria per image. Data represent mean ± SEM of three independent experiments. *P < 0.05 vs. WT. (C) Quantification of ERMICC of ER located at 20-nm maximum distance from mitochondria. Data represent mean ± SEM of three independent experiments (n = 350 mitochondria per experiment). *P < 0.05 vs. WT.
It should be mentioned that this mitochondrial surface increase was (26) or was not found (25) in EMs of Mfn2−/− MEFs, questioning its importance in ER–mitochondria interaction. Indeed, in cells lacking Mfn1, Mfn2, or both Mfns we always retrieved smaller mitochondria whose perimeter was reduced, challenging the concept that Mfn2 ablation increases the perimeter of the organelle (Tables S1 and S2). We nevertheless decided to take this parameter into account and devised an ER–mitochondria contact coefficient (ERMICC) that computes not only the distance between the ER and mitochondria but also the interaction length and the perimeter of the mitochondria involved in the interaction (i.e., the overall surface of the organelle) (Fig. 1C). ERMICC was reduced more than 70% upon Mfn2 ablation, irrespective of whether we considered ER cisternae positioned within a 30- (Fig. 1D) or 20- (Fig. S1C) nm radius from the mitochondria. This extent of ERMICC decrease cannot be explained, even if we consider the 30% increase in mitochondrial perimeter measured in Mfn2−/− cells by confocal microscopy (26) but not by EM (25) (Tables S1 and S2). Indeed, fitting the formula with data from ref. 25 and with the measured increase in ER–mitochondria distance (Fig. 1B), ERMICC decreases by ∼30% in Mfn2−/− cells, indicating that the observed ERMICC reduction is the compounded effect of reduced mitochondrial surface in contact with ER and ER–mitochondria distance increase.
Table S1.
Mitochondria and ER morphometric analysis in indicated genetic backgrounds
| Measurements | 30 nm maximum | |||||
| WT | Mfn1−/− | Mfn2−/− | Mfn1−/−Mfn2−/− | Mfn2−/−+Mfn1 | Mfn2−/−+Mfn2 | |
| Distance ER–mitochondria | 14 ± 0.7 | 14 ± 0.42 | 16 ± 0.4 | 18 ± 0.6 | 17 ± 0.5 | 14 ± 0.6 |
| ER–mitochondria interface length | 269 ± 26 | 191 ± 13 | 180 ± 19 | 174 ± 14 | 194 ± 15 | 201 ± 16 |
| Perimeter of mitochondria | 3,415 ± 262 | 2,270 ± 117 | 3,035 ± 146 | 3,475 ± 127 | 4,610 ± 228 | 2,934 ± 192 |
| ERMICC | 0.009 ± 0.001 | 0.007 ± 5.1 E-4 | 0.004 ± 4.2 E-5 | 0.003 ± 2.8 E-4 | 0.004 ± 3.1 E-4 | 0.008 ± 8.5 E-4 |
Raw data (average, nm ± SEM) relative to Fig. 1 showing mitochondrial morphology and ER–mitochondria interaction analysis. For morphological measurements, analysis of ER located at less than 30 nm from mitochondria was considered as previously described. ERMICC was calculated as described in Fig. 1C.
Table S2.
Mitochondria and ER morphometric analysis in indicated genetic backgrounds
| Measurements | 20 nm maximum | |||||
| WT | Mfn1−/− | Mfn2−/− | Mfn1−/−Mfn2−/− | Mfn2−/−+Mfn1 | Mfn2−/−+Mfn2 | |
| Distance ER–mitochondira | 13 ± 0.5 | 13 ± 0.3 | 15 ± 0.3 | 14 ± 0.4 | 14 ± 0.3 | 13 ± 0.4 |
| ER–mitochondria interface length | 253 ± 33 | 198 ± 15 | 195 ± 23 | 168 ± 19 | 209 ± 19 | 204 ± 48 |
| Perimeter of mitochondria | 3,936 ± 367 | 2,249 ± 132 | 3,141 ± 176 | 3,417 ± 166 | 4,572 ± 265 | 2,768 ± 191 |
| ERMICC | 0.007 ± 0.001 | 0.008 ± 5.6 E-4 | 0.005 ± 5.3 E-5 | 0.004 ± 4.1 E-4 | 0.004 ± 3.9 E-4 | 0.009 ± 9.7 E-5 |
Raw data (average, nm ± SEM) relative to Fig. S1 showing mitochondrial morphology and ER–mitochondria interaction analysis. For morphological measurements, analysis of ER located at less than 20 nm from mitochondria was considered as previously described. ERMICC was calculated as described in Fig. 1C.
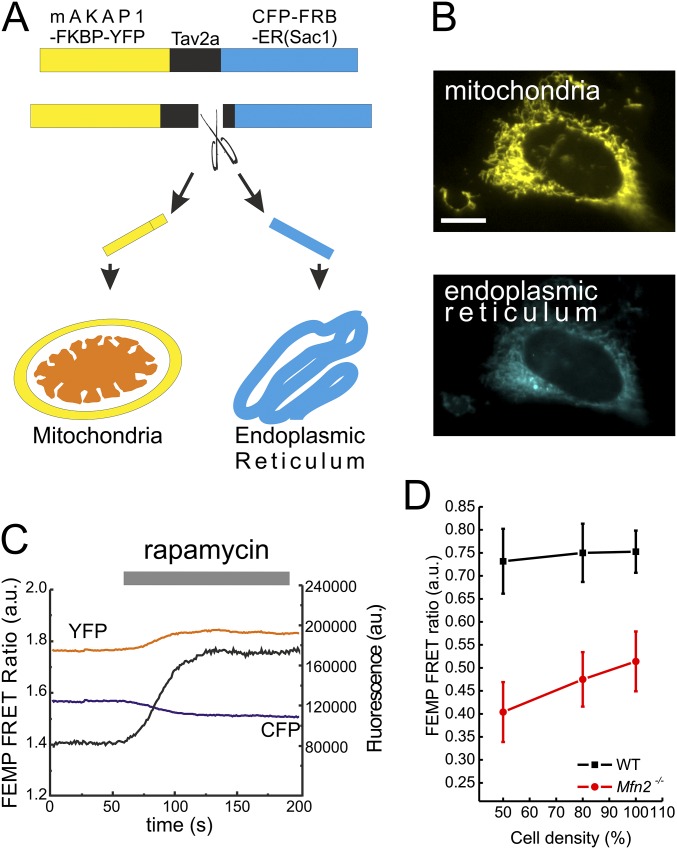
Finally, because tethering measurements based on EM or confocal image analysis can be prone to operator bias, we turned to assays of ER–mitochondria proximity based on GFP fluorescent probes. First, we used a dimerization-dependent (dd) GFP sensor of ER–mitochondria juxtaposition, which is formed by two monomeric nonfluorescent green spectrum-shifted mutants of dsRED, the Kon of which is low enough to avoid spontaneous dimerization: one GFP is targeted to the ER surface, the other to the OMM, and when the two are closer than 20 nm a fluorescent dimer is formed (27). Live confocal imaging indicated that, as expected, ddGFP fluorescence accumulated in puncta in WT MEFs; the extent of the ddGFP puncta was greatly reduced in Mfn2−/− cells (Fig. 1E). To quantitate this reduction, we measured by flow cytometry the percentage of ddGFP+ cells in the mitochondrial dsRED+ [mitochondrial (mt)RFP] cell population, upon contransfection of WT and with ddGFP and mtRFP. Notably, we noted an ∼73% decrease in the population of ddGFP+ Mfn2−/− MEFs compared with their WT counterparts (Fig. 1 F and G). We also measured ER–mitochondria tethering using a modified FRET-based indicator of ER–mitochondria proximity (FEMP). This sensor contains a dimerization domain that allows maximal juxtaposition and FRET by brief rapamycin treatment (12). FRET intensity is inversely proportional to the sixth power of the distance between the two fluorophores and it occurs when the two FEMP fluorophores are closer than 15 nm. The modified sensor is expressed from a single mRNA that allows equimolar levels of the ER and mitochondria-anchored fluorescent proteins, thanks to the introduction of a self-cleavable viral Tav2A sequence between the two mRNAs (Fig. S2A). The two fluorescent proteins are appropriately targeted and measure basal as well as maximal (rapamycin-induced) organelle proximity in MEFs (Fig. S2 B and C). FRET ratios measured using the FEMP probe were significantly reduced in Mfn2−/− MEFs compared with their WT counterparts (Fig. 1G). In conclusion, multiple methods confirm decreased ER–mitochondria juxtaposition upon chronic Mfn2 ablation.
Fig. S2.
FEMP probe measures proximity between the ER and mitochondria. (A) Schematic of the modified FEMP probe targeted to the mitochondrial outer membrane and ER. A self-cleaving Tav2A peptide was inserted following YFP sequence. Following translation, the peptide undergoes autocleavage and releases YFP and CFP, which are targeted to the mitochondria and ER by Akap1 and Sac1 targeting sequences, respectively. (B) Representative confocal images of the FEMP probe localized to mitochondria (Upper, yellow) and ER (Lower, cyan). (Scale bar: 10 μm.) (C) Time-lapse imaging of WT MEFs expressing FEMP probe. Where indicated, cells were treated with 100 nM Rapamycin. Black trace, calculated YFP/CFP FRET intensity. (D) FEMP measurement of ER–mitochondria contacts in WT and Mfn2−/− cells at indicated confluency.
The morphometric, ddGFP and FEMP results complement our previous analyses of ER–mitochondria of ER–mitochondria juxtaposition based on ET, confocal microscopy, and in vitro isolated organelle interaction assays (10), and are in accordance with other EM studies that revealed decreased juxtaposition in Mfn2-deficient neurons (14) and cardiomyocytes (13). These data are difficult to reconcile with the reported tethering increase upon Mfn2 ablation (25, 26), but a potential explanation for the latter resides in the nutritional status of the cells. Stress and starvation tightens ER–mitochondria contacts (7, 28) and cell proliferation increases upon Mfn2 down-regulation (29). Indeed, we measured an increased FEMP FRET ratio (albeit still lower than the one measured in the WT counterparts) when Mfn2−/− cells were plated at higher densities (Fig. S2D), calling for particular care to avoid culture conditions hampering accurate estimations of interorganellar juxtaposition.
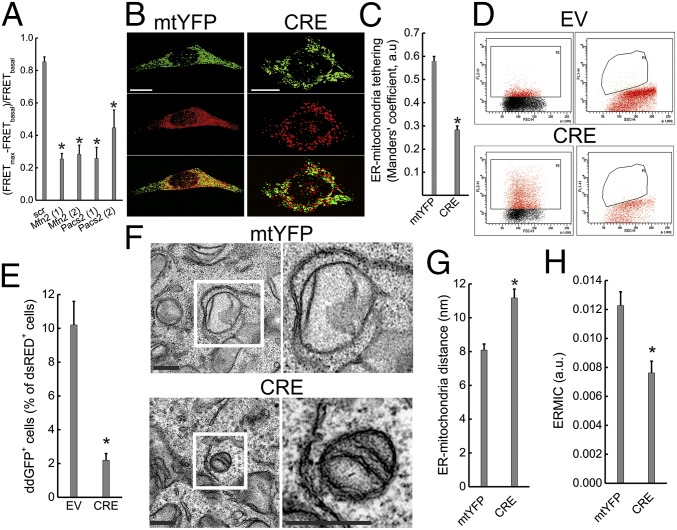
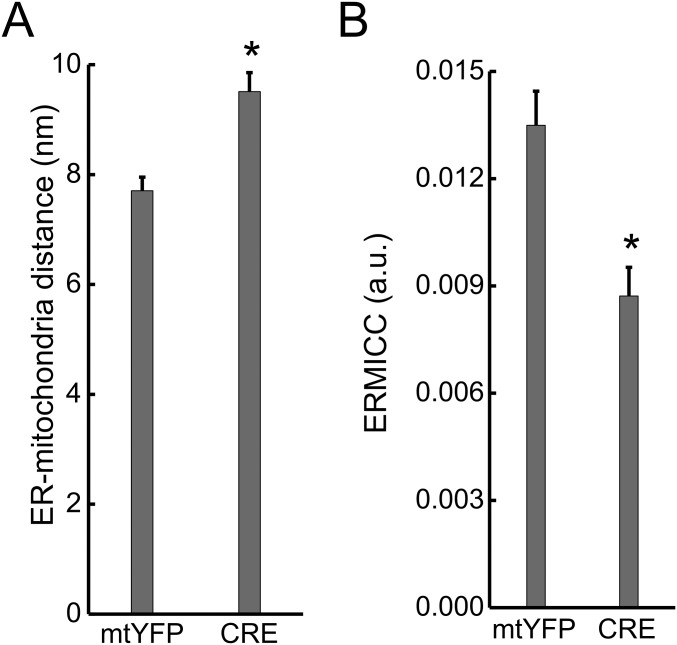
Clonal differences in established Mfn2−/− cell lines might also explain the discrepancies on Mfn2’s role as a tether. We therefore decided to turn to models of Mfn2 acute ablation. Earlier observations indicated that MFN2 gene silencing in human cells increases the distance and reduces the cross-talk between the ER and mitochondria (1, 10, 30); yet, these results required validation by unbiased fluorescent probes of ER–mitochondria proximity located only on the organelle surface and in models of Mfn2 gene ablation rather than silencing (where off-target RNAi effects might confound the interpretation of the results). We therefore measured the effect of two different shRNAs targeting Mfn2 on FRET ratios in FEMP-expressing MEFs. Normalized FRET values were comparably and significantly reduced upon silencing of Mfn2 or of the other known ER–mitochondria tether regulator PACS2 (Fig. 2A), indicating that ER–mitochondria tethering decreases irrespective of whether Mfn2 is acutely or constitutively ablated. To circumvent the issue of potential shRNAs off-target effects, we then generated MEFs from conditional Mfn2 knockout (Mfn2flx/flx) mice (31) and induced acute Mfn2 deletion by means of adenoviral delivery of CRE recombinase. MFN2 was reduced at 24 h postinfection and almost completely lost at 48 h (see, for example, Fig. 4A). In 3D reconstructions of z-confocal stacks of mtYFP and ER-targeted dsRED (ER–RFP), mitochondria and ER appeared grossly fragmented 48 h postinfection (Fig. 2B) and ER–mitochondria pseudocolocalization was reduced as in Mfn2−/− cells (10) (Fig. 2 B and C). Flow cytometry analysis of ddGFP fluorescence confirmed the increased ER–mitochondria distance, revealing a fivefold decrease in ddGFP+ events upon Cre-mediated Mfn2 ablation (Fig. 2 D and E). Finally, EM revealed that acute Mfn2 ablation increased ER–mitochondria distance (Fig. 2 F and G) and decreased the contact coefficient ERMICC (Fig. 2H). As for Mfn2−/− cells, these morphometric parameters were independent from the maximum distance of the tethers considered (i.e., lower than 20 or 30 nm) (Fig. S3 and Table S3). In conclusion, ER–mitochondria tethering measured by fluorescence and EM morphometry is decreased irrespective of the mean used to acutely ablate Mfn2.
Fig. 2.
Acute Mfn2 ablation increases ER–mitochondria distance. (A) Data represent mean ± SEM of FEMP measurement of ER–mitochondria contacts from nine independent experiments where WT MEFs were transduced with the indicated shRNA lentiviral particles for 24 h (two different shRNAs were used for Mfn2 and PACS2), transfected with FEMP, and imaged. *P < 0.05 vs. scramble (scr). (B) Volume-rendered 3D reconstructions of confocal z-stacks of mitochondria (Top, mtYFP, pseudocolored in green), ER (Middle, red), and merged images (Bottom) in Mfn2flx/flx MEFs infected with mtYFP or CRE-2A-mtYFP (CRE) adenoviruses. 24 h after infection cells were transfected ER-dsRED (pseudocolored in red) and, after an additional 24 h, imaged. (Scale bars, 30 µm.) (C) Data represent mean ± SEM of analysis of ER–mitochondria interaction in 10 independent experiments (n = 10 cells per experiment) performed as in B. *P < 0.05 vs. mtYFP. (D) Flow cytometry analysis of ddGFP fluorescence in Mfn2flx/flx MEFs. Cells were infected pLV-CMV (EV) or with pLV-CMV-NLSCRE (CRE) lentiviruses, cotransfected after 48 h with ddGFP monomers and cytosolic dsRED and 24 h later analyzed by flow cytometry. (Left) Scatterplots of the gated dsRED+ cells. (Right) GFP+ dsRED+ population. (E) Data represent mean ± SEM of ddGFP+ events in Mfn2flx/flx MEFs infected as indicated from three independent experiments as in D. *P < 0.05 vs. EV. (F) Representative EM images of Mfn2flx/flx MEFs infected for 48 h with mtYFP or CRE-2A-mtYFP (CRE) adenoviruses. Boxed areas are magnified 3× (Right). (Scale bars, 500 nm.) (G) Mean ± SEM of mitochondria–ER distance calculated in three independent experiments as in F. *P < 0.05 vs. mtYFP. (H) Mean ± SEM. ERMICC calculated from three independent experiments performed as in G. *P < 0.05 vs. mtYFP.
Fig. 4.
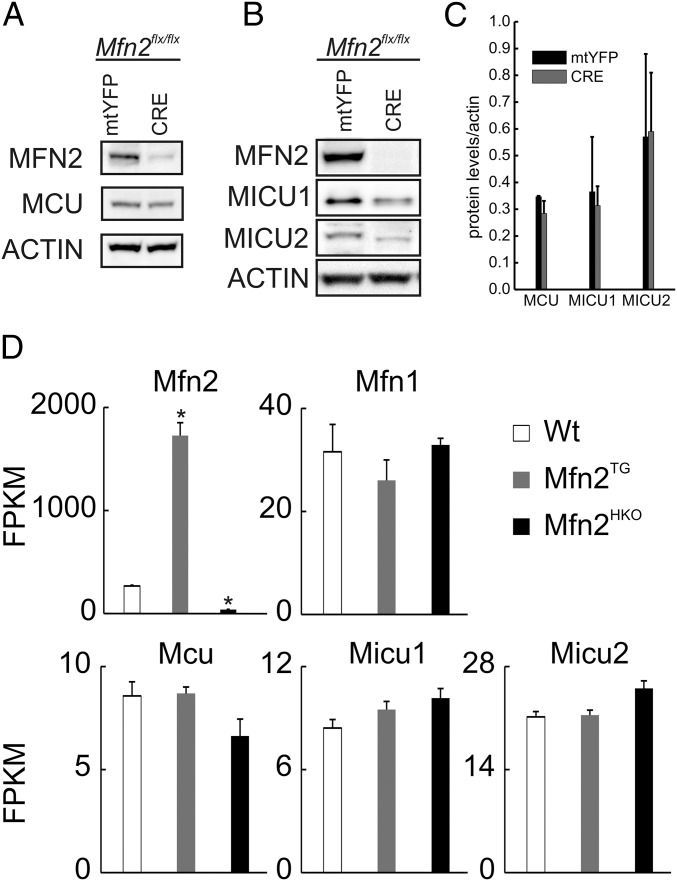
Mfn2 levels do not affect components of the mitochondrial Ca2+ uptake machinery. (A and B) Equal amounts (40 μg) of protein were separated by SDS/PAGE and immunoblotted using the indicated antibodies from Mfn2flx/flx MEFs infected with mtYFP andCRE-2A mtYFP (CRE) adenoviruses for 48 h. (C) Mean ± SEM of densitometric quantification of MCU, MICU1, and MICU2 protein levels in three independent experiments as in A. (D) RNAseq results for WT, cardiomyocyte-specific Mfn2 transgenic (Mfn2tg), and cardiomyocyte-directed Mfn2 knockout (Mfn2HKO) mouse hearts, expressed as read fragments per kilobase of exon per million reads mapped (FPKM). *P < 0.02 vs. WT (one-way ANOVA).
Fig. S3.
Acute Mfn2 ablation increases ER–mitochondria distance and decreases ER–mitochondria contacts. (A) Morphometric analysis of ER located at less than 30 nm from mitochondria calculated from 70 images per condition, with >5 mitochondria per image in Mfn2flx/flx MEFs infected with AAV-CMV-mtYFP (mtYFP) or AAV-CMV-CRE-2A mtYFP (CRE) adenoviruses. Data represent mean ± SEM of three independent experiments performed as in Fig. 2F. *P < 0.05 vs. mtYFP. (B) Data represent mean ± SEM of ERMICC calculated from three independent experiments performed as in A. *P < 0.05 vs. mtYFP.
Table S3.
Mitochondria and ER morphometric analysis in indicated genetic backgrounds
| 30 nm maximum | 20 nm maximum | |||
| Measurements | EV | CRE | EV | CRE |
| Distance ER–mitochondria | 9 ± 0.4 | 11 ± 0.5 | 7.7 ± 0.2 | 9.5 ± 0.3 |
| ER–mitochondria interface length | 269 ± 17 | 201 ± 18 | 279 ± 19 | 210 ± 20 |
| Perimeter of mitochondria | 3,896 ± 149 | 3,554 ± 149 | 3,929 ± 159 | 3,555 ± 162 |
| ERMICC | 0.013 ± 9.0 E-5 | 0.008 ± 7.4 E-5 | 0.013 ± 9.0 E-5 | 0.009 ± 8.0 E-5 |
Raw data (average, nm ± SEM) relative to Fig. 2 and Fig. S3 showing mitochondrial morphology and ER–mitochondria interaction analysis in Mfn2flx/flx MEFs infected with AAV-CMV-mtYFP (mtYFP) or AAV-CMV-CRE-2A mtYFP (CRE) adenoviruses. For morphological measurements, analysis of ER located at less than 30 nm or 20 nm from the mitochondria was considered as previously described. ERMICC was calculated as described in Fig. 1C.
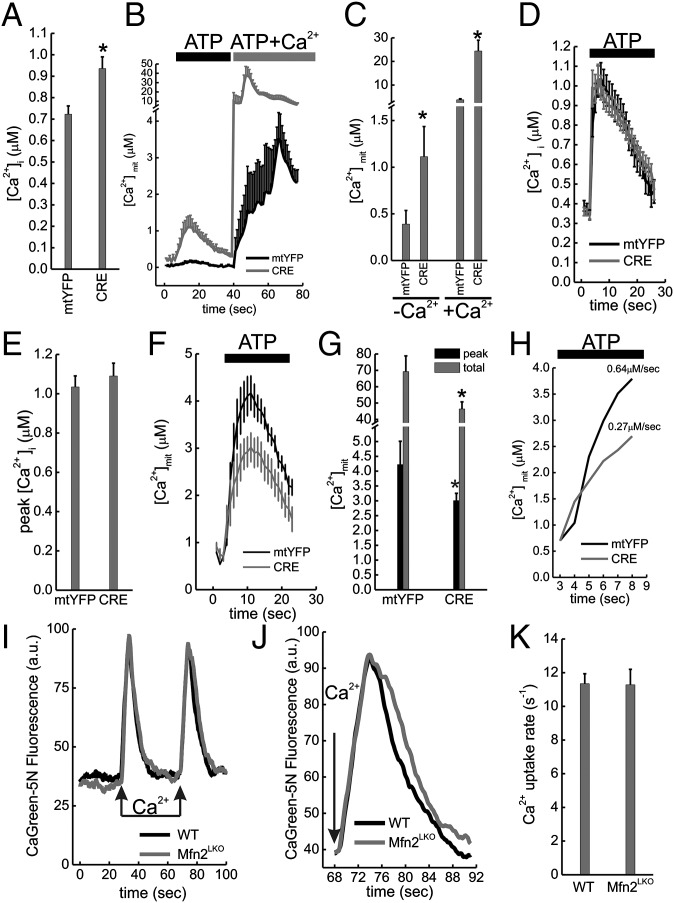
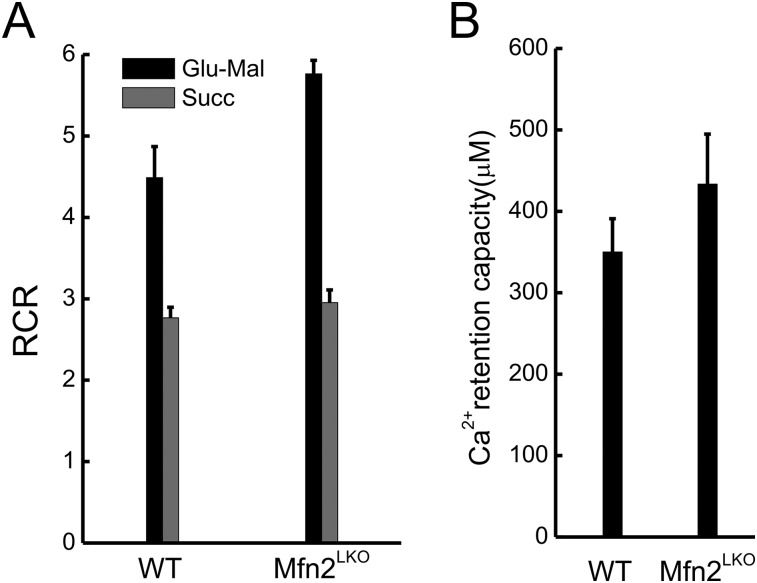
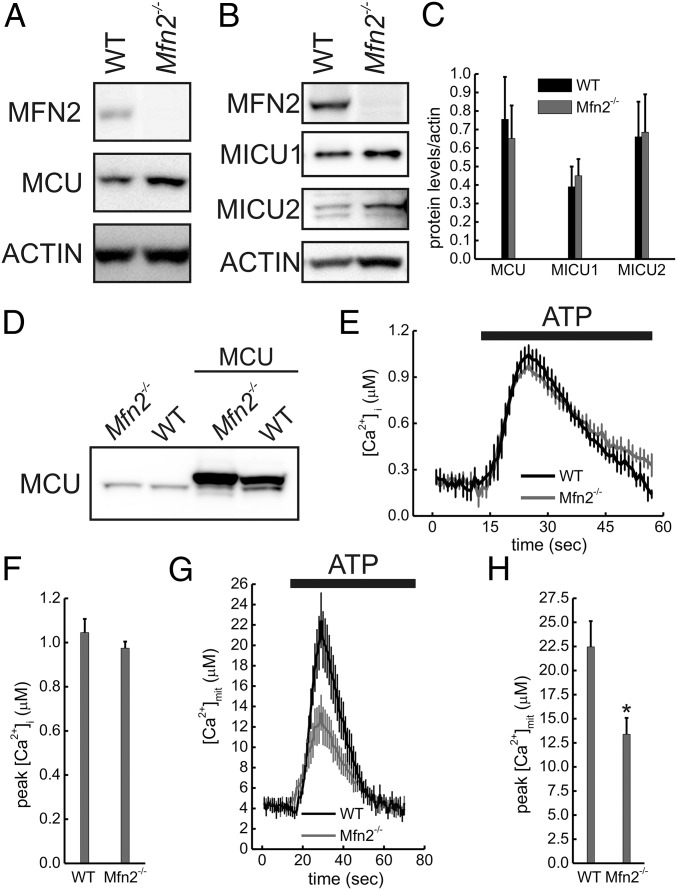
If Mfn2 ablation decreases ER–mitochondria tethering, cross-talk between the two organelles should be altered, as reported by many (10, 13, 14, 16, 28). However, the key feature of reduced mitochondrial Ca2+ uptake following agonist induced ER Ca2+ release in Mfn2−/− MEFs was explained not as a consequence of lower tethering, but of lower MCU levels (26). MCU is the channel-forming subunit of the MCU holocomplex that contains other essential regulatory components, including MICU1, MICU2, and EMRE (32). In cells where Mfn2 was silenced, MCU as well as ER Ca2+ levels appeared normal, but mitochondrial Ca2+ transients were ∼40% higher, a phenotype compatible with increased ER–mitochondria juxtaposition (26). To circumvent potential issues of off-target siRNA effects, we turned to our model of acute Mfn2 deletion. In the absence of extracellular Ca2+, agonist-induced ER Ca2+ release was increased in Mfn2flx/flx infected with Cre adenoviruses (Fig. 3A), indicating an increase in ER Ca2+ stores similar to that recorded in Mfn2−/− MEFs (10). This greater availability of cytosolic Ca2+ resulted in increased mitochondrial Ca2+ uptake, which was maximized upon reintroduction of extracellular Ca2+ (Fig. 3 B and C), when mitochondria are exposed to capacitative Ca2+ entry (CCE). These data are in accordance with previous reports of increased CCE upon Mfn2 reduction (33) and require that mitochondrial Ca2+ uptake is measured (i) excluding CCE by chelating extracellular Ca2+ and (ii) exposing mitochondria to comparable Ca2+ levels, by titrating the IP3-coupled agonist ATP to generate the same [Ca2+]i peak (Fig. 3 D and E). In these conditions, mitochondrial Ca2+ uptake was significantly lower (Fig. 3 F and G) and slower (Fig. 3H) in Mfn2flx/flx infected with Cre adenoviruses. These data are consistent with previous reports of chronic (10) and tissue-specific (13) Mfn2 ablation and can be explained by reduced ER–mitochondria juxtaposition upon acute Mfn2 deletion (see above) or by reduced intrinsic Ca2+ uptake ability of Mfn2-deficient mitochondria, as suggested by ref. 26. We therefore turned to purified liver mitochondria, where Ca2+ uptake measurements can be carried out without the confounding effects of contaminating ER [with its high Ca2+ affinity sarco/ER Ca2+-ATPase (SERCA) pumps], by monitoring extramitochondrial Ca2+ insensitive to the equilibrium between the intramitochondrial stores and the targeted dye, and in the presence of the permeability transition pore-inhibitor cyclosporine A to avoid confusion from simultaneous Ca2+ efflux through this Ca2+-sensitive nonselective inner membrane channel. Recordings of Ca2+ uptake and release upon pulses of Ca2+ were superimposable in control (WT) and Mfn2-deficient (Mfn2LKO) liver mitochondria (Fig. 3 I–K), whose respiratory efficiency (and hence driving force for Ca2+ uptake) and Ca2+ retaining capacity were equivalent (Fig. S4). As expected from these functional results, MCU, MICU1, and MICU2 levels were not affected upon Mfn2 ablation (Fig. 4 A–C). Quantitative transcriptional analysis by RNA-sequencing of mouse hearts with cardiomyocyte-directed Mfn2 ablation (34) or overexpression (35) confirmed that uniporter holoplex component mRNAs do not change when Mfn2 is genetically manipulated (Fig. 4D). Accordingly, MCU, MICU1, and MICU2 levels were indistinguishable in Mfn2−/− and WT MEFs, as judged by immunoblotting (Fig. 5 A–D). Thus, genetic Mfn2 levels modulation does not affect the mitochondrial Ca2+ uptake machinery or process, whereas acute Mfn2 deletion decreases interorganellar tethering and mitochondrial uptake of Ca2+ released from the ER. To definitively test the relationship between Mfn2 ablation, MCU levels and mitochondrial Ca2+ uptake, we went back to WT and Mfn2−/− MEFs, where we adenovirally delivered high and comparable MCU levels (Fig. 5D). When agonist-induced [Ca2+]i peaks were comparable (Fig. 5 E and F), mitochondrial Ca2+ uptake was still lower and slower in MCU overexpressing Mfn2−/− MEFs (Fig. 5 G and H). Given that no differences in mitochondrial membrane potential were measured (26), decreased ER–mitochondria tethering stands as the most probable explanation for the reduced mitochondrial Ca2+ uptake observed in this experiment.
Fig. 3.
Mfn2 ablation decreases mitochondrial Ca2+ uptake in situ but not in vitro. (A) Mean ± SEM of peak cytosolic Ca2+ concentrations ([Ca2+]i) in response to ATP (0.2 mM) in Ca2+-free Krebbs Ringer buffer (KRB) from in three independent experiments (n = 10 recordings per experiment) where Mfn2flx/flx MEFs were infected with mtYFP or CRE-2A-mtYFP (CRE) adenoviruses and after 48 h transfected with cytAEQ. *P < 0.05 vs. mtYFP. (B) Mean ± SEM of mitochondrial Ca2+ ([Ca2+]mit) in Ca2+-free KRB from in three independent experiments (n = 10 recordings per experiment) where Mfn2flx/flx MEFs were infected with the indicated adenoviruses and after 48 h transfected with mtAEQ. Where indicated, cells were perfused with 0.2 mM ATP and with 0.2 mM ATP + 2 mM Ca2+. (C) Average ± SEM of peak [Ca2+]mit from in three independent experiments (n = 10 recordings per experiment) performed as in B. Where indicated, cells were perfused with (+Ca2+) or without (−Ca2+) extracellular Ca2+. *P < 0.05 vs. mtYFP. (D) Mean ± SEM of [Ca2+]i from three independent experiments (n = 10 recordings per experiment) where Mfn2flx/flx MEFs were infected with the indicated adenoviruses and after 48 h transfected with cytAEQ. Cre infected cells were incubated for 30 min in Ca2+ free media. Where indicated, cells were perfused with 0.2 mM ATP. (E) Average ± SEM of peak [Ca2+]i in three independent experiments performed as in D. (F) Experiments were performed as in D except that [Ca2+]mit was recorded in in Mfn2flx/flx MEFs infected with the indicated adenoviruses and after 48 h transfected with mtAEQ. (G) Average ± SEM of three independent peak [Ca2+]mit in experiments performed as in F. *P < 0.05 vs. the corresponding mtYFP bar. (H) Expanded scale of G. The Ca2+ uptake rate is indicated. (I) Control (WT) and liver-specific Mfn2 knockout mice (Mfn2LKO) mitochondria (0.5 mg/mL) were incubated in experimental buffer supplemented with 1 µM CaGreen-5N and 2 µM cyclosporine A. Where indicated, 50 µM Ca2+ pulses were added. (J) Expanded scale of I. (K) Average ± SEM of [Ca2+]mit uptake rate recorded from three couples of littermates as in I.
Fig. S4.
Mfn2 ablation in liver does not alter mitochondrial function and Ca2+ retaining capacity. (A) Respiratory control ratio (RCR) in isolated mitochondria from control (WT) and Mfn2 liver specific knockout (Mfn2LKO) mice energized using glutamate/malate (Glu-Mal) or Succinate (Succ). (B) Ca2+ retention capacity in isolated mitochondria of the indicated genotypes measured using 1 μM CaGreen-5N. Pulses of 50 μM Ca2+ were added until protein-tyrosine phosphatase PTP induction.
Fig. 5.
Mfn2 ablation impairs mitochondrial Ca2+ uptake in an MCU-independent manner. (A and B) Equal amounts (40 μg) of total lysates from cells of the indicated genotypes were separated by SDS/PAGE and immunoblotted using the indicated antibodies. (C) Mean ± SEM of densitometric quantification of levels of the indicated MCU holoplex components from 3 to 10 independent experiments as in A and B. (D) MEFs of the indicated genotype were infected where indicated with MCU expressing adenoviruses and, after 48 h, were lysed and equal amount of proteins (40 µg) separated by SDS/PAGE and immunoblotted with the indicated antibodies. (E) Recordings of [Ca2+]i in Ca2+-free KRB in cells of the indicated genotypes overexpressing MCU. Where indicated, MEFs were perfused with 0.2mM (WT) or 10 µM (Mfn2−/−) ATP. (F) Mean ± SEM of three independent experiments of peak [Ca2+]i from experiments performed as in E. (G) Recordings of [Ca2+]mit in experiments performed as in E. (H) Mean ± SEM of peak of [Ca2+]mit from three independent experiments performed as in G. *P < 0.05 vs. WT.
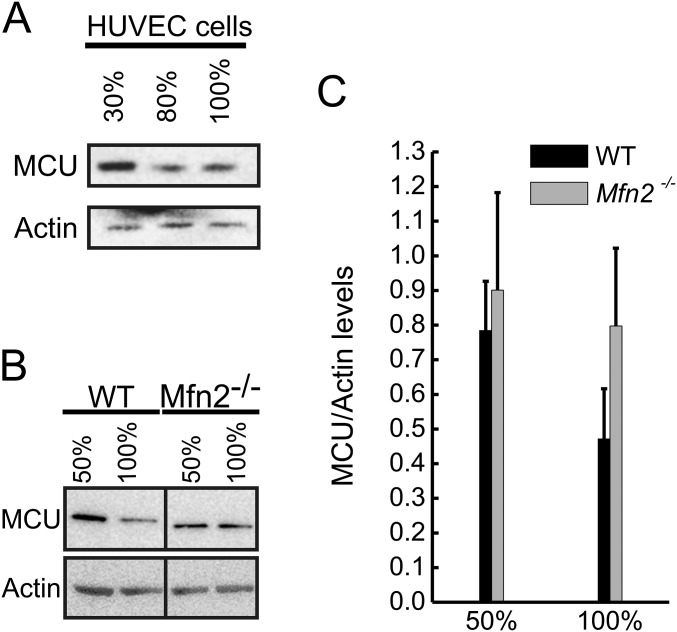
Several potential explanations exist for the differences between our results and those of Filadi et al. (26): first, the cell permeabilization procedure or the concomitant presence of the ER [with active SERCA that is up-regulated in Mfn2−/− cells (10)] in the permeabilized cell preparation used in ref. 26 might affect mitochondrial Ca2+ uptake; second, because acute similarly to chronic Mfn2 deletion increases ER Ca2+ content (and hence release), ER Ca2+ release might not have been comparable; third, the Mfn2 siRNA used might have had potential off target effects, as highlighted by the need to predeplete ER Ca2+ stores in experiments of Mfn2 re-expression to obtain similar ER Ca2+ release (26). Finally, like tethers, levels of MCU might also be affected by cell density. We first tested this possibility in the noncycling human umbilical endothelial cells (HUVECs) where seeding density is not confounded by cell replication. Of note, MCU levels decreased proportionally to the plating density (Fig. S5A). A similar picture was observed in WT cells, where doubling the seeding density resulted in a 40% reduction in MCU levels. A much smaller (11%) reduction was recorded also in Mfn2−/− MEFs (Fig. S5 B and C). The discovery that density not only affects tethering (Fig. S2) but also MCU levels call for extreme caution in setting appropriate experimental conditions to inspect a potential role of a gene as a tether or as a “spacer” of the ER and mitochondria.
Fig. S5.
Tethering is influenced by cell confluency. (A and B) equal amounts (40 μg) of protein from HUVEC cells (A) or WT and Mfn2−/− MEF (B) at indicated confluency were separated by SDS/PAGE and immunoblotted using the indicated antibodies. (C) Densitometric quantification of MCU protein levels in WT and Mfn2−/− MEFs at indicated confluency. Experiments were as in B. Data represent mean ± SEM of three independent experiments.
The critical reappraisal of Mfn2’s role in ER–mitochondria juxtaposition supports previous results identifying this molecule as a physical tether between the two organelles in multiple tissues, and calls for a critical reconsideration of the conclusions of two recent papers, where limited experimental approaches were used to confute Mfn2 ER–mitochondria tethering function (25, 26). Why cells lacking Mfn2 were found to display increased ER–mitochondria juxtaposition is unclear. One possibility is that in these two papers experiments were performed on confluent or quasiconfluent cells, a “gray” zone where the tethering differences between WT and Mfn2−/− exist but are reduced, with the risk of missing them. Moreover, because MCU levels also change when cells are grown at different densities, ER–mitochondria tethering should always be measured structurally and functionally in logarithmically growing cells.
Irrespective of the reasons behind the discrepancy in the results, with previous knowledge on the function of this dynamin-related protein in membrane biology, it is difficult to rationalize the proposed role for Mfn2 as a negative regulator of tethering (26). Mfn2 was originally identified as the mitochondrial fusion factor: its overexpression clusters closely apposed individual mitochondria, indicating that it likely mediates mitochondrial adhesion (21). In a similar scenario, Mfn2 on the ER engages in homo- or heterotypic interactions with mitochondrial Mfn2 or Mfn1 to tether the two organelles. In this framework, it is not surprising that acute or chronic Mfn2 ablation decreases juxtaposition measured by EM, pseudocolocalization, FRET- or GFP-based probes, and by in vitro assays of purified ER–mitochondria cosedimentation. Functionally, transfer of Ca2+ from the ER to mitochondria is blunted in Mfn2-deficient cells, without any intrinsic defect in mitochondrial Ca2+ uptake machinery.
Mfn2 should not be considered the only mammalian tether: multiple other factors juxtapose mitochondria to the ER independently of Mfn2. The existence of Mfn2-independent tethers is confirmed by finding that the two organelles are still (albeit to a lower extent) tethered in cells lacking Mfns, and that ablation of other tethers such as PACS2 reduces FEMP-measured organelle proximity. Finally, cross-linked complexes between Mfn2 on the ER and on the surface of mitochondria weigh more than 1 MDa (10), indicating that additional machinery is likely required on both ER and mitochondrial sides. Like Mfn2 (28), these tethers might be influenced by growth and nutrient availability (Fig. S2), as well as by progression during cell death (36), calling for their characterization and for the analysis of their role in Mfn2-dependent and independent tethering. Irrespective of the complexity of the anatomy of the ER–mitochondria interface, Mfn2 fulfills the basic criteria to stand as a bona fide tether and the discoveries on the biology of this interface based on Mfn2 stand solid.
Materials and Methods
Molecular Biology and Biochemistry.
Details on plasmids and shRNA used, on the generation of MCU-Flag adenoviruses and FEMP, as well as on deep RNA sequencing are in SI Materials and Methods.
Cell Culture and Infection.
Details on generation, immortalization, cultivation, transfection, and infection of MEFs are in SI Materials and Methods.
Confocal and FRET Imaging.
Details on confocal microscopy imaging of live cells and FRET experiments are in SI Materials and Methods.
Flow Cytometry and Cell Sorting.
For evaluation of ddGFP+ cells, MEFs were cotransfected with a cytosolic marker (cyto-dsRED), nonfluorescent GFP monomers targeted to the ER and mitochondria, and after 24 h cells were analyzed by flow cytometric analysis using a FacsCalibur Flow Cytometer (Becton Dickinson Biosciences). For sorting, 1 × 10⁶ MEFs were cotransfected with pEGFP and the indicated plasmids and 16 h later 3 × 10⁵ GFP+ cells were sorted on a FACSAria Cell Sorter (Becton Dickinson Biosciences). Details are in SI Materials and Methods.
Electron Microscopy.
EM was performed as described previously (10). Details are in SI Materials and Methods.
Immunoblotting.
Equal amounts of proteins were separated by 4–12% Bis-Tris SDS/PAGE (NuPAGE; Invitrogen) transferred on PVDF membranes and immunoblotted as indicated. Details are in SI Materials and Methods.
In Vitro Mitochondrial Assays.
Mitochondrial Ca2+ uptake and retaining capacity were measured fluorimetrically using a Perkin-Elmer LS50B fluorimeter (λex 505 nm; λem: 535 nm, slit 2.5 nm) in mitochondria from liver-specific Mfn2 knockout mice (Mfn2loxP/loxP::Alb-Cre+/−) and control littermates (Mfn2loxP/loxP::Alb-Cre−/−) (15). All procedures were approved by the Italian Ministry of Health (authorization 383-2015 to L.S.). Details can be found in SI Materials and Methods.
Aequorin Ca2+ Concentration Measurements.
Details on reconstitution, buffer composition, and aequorin (AEQ) measurements are in SI Materials and Methods.
SI Materials and Methods
Cell Culture and Infection.
MEFs were cultured and transfected as described previously (10). Mfn2flx/flx MEFs were generated from Mfn2loxp/loxp 11.5 d embryos, as described previously (37). MEFs were SV40 immortalized by transfection with pMS-SV-LT and selection by cultivation in DMEM supplemented with 250 µM Neomycin until resistant clones emerged (10).
MEFs were grown in DMEM (Gibco) supplemented with 10% (vol/vol) FBS (Gibco), 1× nonessential amino acids, 2 mM l-glutamine, 100 U/mL penicillin, and 100 μg/mL streptomycin (Gibco). For experiments using different cellular density, confluency was calculated by measuring plate coverage upon staining with 0.1% Crystal violet in 20% (vol/vol) ethanol on the day of the experiments.
Where indicated, cells were infected with AAV-CMV-mtYFP (mtYFP) and AAV-CMV-CRE-2A mtYFP (CRE) adenoviruses at a multiplicity of infection (MOI) of 50 pfu per cell for 16 h or with pLV-CMV-NLSCRE lentiviruses (LVP339, Gentarget) at a MOI of 100 pfu per cell for 96 h.
Molecular Biology.
mtYFP, ER-REF, mtRFP, ER-YFP, and mitofusin plasmids used were previously described (10). MCU adenoviruses were generated as described previously (38). To generate the FEMP probe, we used the pEGFP-N1 AKAP1 (34-63)-FKBP-YFP and pEGFP-C3 CFP-HA-FRB-Helix-ER (Sac1) cDNAs encoding for the two FEMP moieties (kindly provided by G. Hajnoczky, Thomas Jefferson University, Philadelphia). The cDNA coding for AKAP1 (34-63)-FKBP-YFP was subcloned into pcDNA4/TO (Invitrogen) using EcoRV and KpnI before the Tav2a peptide sequence (derived from GFP-2A-CherryFP in pJC3; kindly provided by M. Ryan, St. Andrews University, St. Andrews, Scotland) (39). CFP-HA-FRB-Helix-ER (Sac1) was introduced after the Tav2a sequence between ClaI and XbaI restriction sites. The following shRNA clones from the Mission LentiElite library were used: PACS2_1 (TRCN0000250356); PACS_2 (TRCN0000250359); Mfn2_1 (TRCN0000080612) and Mfn2_2 (TRCN0000080609).
Deep RNA sequencing of mouse hearts was performed and analyzed as described previously (40) on Illumina HiSeq systems.
Imaging.
For confocal imaging of live cells, 2 × 10⁵ cells seeded onto 24-mm round glass coverslips, treated as indicated were placed on the stage of a Nikon Eclipse TE300 inverted microscope equipped with a PerkinElmer Ultraview LCI confocal system, a piezoelectric z axis motorized stage (Pifoc, Physik Instrumente) and an Orca ER 12-bit CCD camera (Hamamatsu Photonics). Acquisition, deconvolution, 3D reconstruction, volume rendering of the stacks, as well as analysis of the mitochondria-to-ER interaction were performed as described previously (10).
The FRET imaging, unless specified differently, consisted of 9,000 cells/mL seeded on a Cell carrier 384-well plate (Perkin-Elmer) and transduced with Mission lentiviral viral particles (∼106 TU; Sigma). After 24 h, cells were transfected with FEMP cDNA using Genjet (SignaGen) according to the manufacturer’s instructions, and after 24 h cells were imaged using an Operetta High Content imaging system (Perkin-Elmer). FEMP imaging using the Operetta System was carried out using the following filters: CFP (excitation 410–430, emission 460–500), YFP (excitation 490–510, emission 520–560), and YFPFRET (excitation 410–430, emission 520–560). To image the maximum FRET intensity (FRETmax), the cells were treated with 100 nM Rapamycin for 15 min and then fixed with 1% formaldehyde for 10 min. Images were analyzed using Perkin-Elmer Harmony 3.5 image analysis software. The YFP channel was chosen to mark the region of interest (ROI) and around each ROI, a second boundary was drawn to measure the background intensity. FRETbasal and FRETmax were calculated as: (FYFPFRETcell-FYFPFRETbg)/(FCFPcell-FCFPbg); FRET Ratio was calculated as (FRETmax – FRETbasal)/FRETbasal.
Flow Cytometric Analyses.
In flow cytometry, acquisition was stopped when 50,000 FL2+ events were reached. Data are shown as dot plot of FL1 versus side scatter derived from FL2+ gated events. Cell size (forward scatter, FSC), cytosolic dsRED level (red signal intensity detected by FL2 channel), and ddGFP fluorescence (GFP signal intensity detected by a 15-mW argon ion laser tuned at 488 nm) analyses were performed on a FacsCalibur Flow Cytometer using CellQuest software (Becton Dickinson Biosciences).
For sorting using FACSAria (Becton Dickinson Biosciences), cells were analyzed through a 530-nm band-pass filter as they traversed the beam of an argon ion laser (488 nm, 100 mW). Sorted GFP+ cells were cultured in DMEM supplemented with 2 mM glutamine, 1 mM penicillin/streptomycin, 20% (vol/vol) FBS at 37 °C in a fully humidified atmosphere of 95% air and 5% CO2. On the following day, medium was replaced to remove dead cells. Growing cells were fixed after 8 h and prepared for EM images.
Electron Microscopy.
MEFs of indicated background were fixed with 1.25% (vol/vol) glutaraldehyde in 0.1 M sodium cacodylate at pH 7.4 for 1 h at room temperature. Thin sections were imaged on a Tecnai-20 electron microscope (Philips-FEI). Morphometric measurements were carried out using ImageJ (National Institutes of Health). For calculations of mitochondria–ER distance, n > 5 mitochondria per image in 70 images per condition were considered, and a minimum distance of ER located in a 30- or 20-nm radius from the considered mitochondria was computed.
Immunoblotting.
Cells (1.8 × 10⁶ or 80% of confluence unless otherwise specified) were harvested 48 or 96 h after transfection and disrupted in 150 mM NaCl, 1% Nonidet P-40/0, 0.25% deoxycholate, 1 mM EDTA, and 50 mM Tris, pH 7.4 in the presence of complete protease inhibitor mixture (Sigma-Aldrich). Forty micrograms of extracted proteins were separated by 4–12% Bis-Tris SDS/PAGE (NuPAGE; Invitrogen), transferred onto polyvinylidene difluoride membranes (Bio-Rad Laboratories), and probed using the following antibodies: antiactin (1:2,000; EMD Millipore), anti-Mfn2 (1:1,000; Abcam: ab 50838 or Abnova: H00009927-M3), anti-Tom20 (1:5,000; Santa Cruz Biotechnology), anti-MCU (1:1,000, Sigma-Aldrich: HPA016480), MICU 1 (1:1,000; Sigma-Aldrich: HPA037480), MICU 2 (1:1,000, Sigma-Aldrich: HPA 045511). Densitometry was performed using ImageJ (National Institutes of Health).
Aequorin Measurements of Ca2+ Concentration.
Cells grown on 13-mm round glass coverslips at 50% confluence were cotransfected with cytosolic (cyt) or mitochondrial (mt) AEQ and the plasmids indicated. Cyt and mtAEQ reconstitution, measurement, and calibration were performed as described previously (10) in KRB (125 mM NaCl, 5 mM KCl, 1 mM Na3PO4, 1 mM MgSO4, 5.5 mM glucose, 20 mM Hepes, pH 7.4) containing 1 mM Ca2+. When AEQ measurements were carried out without Ca2+, measurement KRB was supplemented with 10 mM EGTA.
In Vitro Mitochondrial Assays.
Mitochondria from WT and Mfn2LKO mouse liver were isolated as described previously (41). Mitochondrial oxygen consumption was measured with a Clark-type oxygen electrode (Hansatech Instruments) (41). For mitochondrial Ca2+ uptake, freshly isolated mitochondria were resuspended in experimental buffer (41) supplemented with 5 mM glutamate/2.5 mM malate, and 1 μM Calcium Green-5N (Invitrogen). Pulses of 50 μM Ca2+ were added until protein-tyrosine phosphatase induction. For measurements of Ca2+ uptake, experimental buffer was also supplemented with 2 µM cyclosporine A.
Acknowledgments
We thank Drs. F. Caicci and F. Boldrin (EM Facility, Department of Biology, University of Padova) for electron microscopy. This work was supported in part by Telethon-Italy Grants GGP12162, GGP15198, and TCR02016 (to L.S.); the Associazione Italiana per la Ricerca sul Cancro Italy (to L.S.); European Research Council Grants FP7-282280 and FP7 CIG PCIG13-GA-2013-618697 (to L.S.); Ministero dell’Istruzione, dell’Università e della Ricerca Fondo per gli Investimenti della Ricerca di Base RBAP11Z3YA_005 (to L.S.); National Heart, Lung, and Blood Institute Grants R01 HL59888, R01 108943, and R01 128071 (to G.W.D.); Ministry of Economy and Competitiveness Grant SAF2013-40987R (to A.Z.); Generalitat de Catalunya 2014SGR48 (to A.Z.); Institució Catalana de Recerca i Estudis Avançats Academia (A.Z.); Centro de Investigación Biomédica en Red de Diabetes y Enfermedades Metabólicas Asociadas (A.Z.); and PIE14/00045 Instituto de Salud Carlos III (to A.Z.). L.S. is a Senior Scientist of the Dulbecco-Telethon Institute.
Footnotes
The authors declare no conflict of interest.
This article is a PNAS Direct Submission.
This article contains supporting information online at www.pnas.org/lookup/suppl/doi:10.1073/pnas.1606786113/-/DCSupplemental.
References
- 1.Hamasaki M, et al. Autophagosomes form at ER-mitochondria contact sites. Nature. 2013;495(7441):389–393. doi: 10.1038/nature11910. [DOI] [PubMed] [Google Scholar]
- 2.Muñoz JP, et al. Mfn2 modulates the UPR and mitochondrial function via repression of PERK. EMBO J. 2013;32(17):2348–2361. doi: 10.1038/emboj.2013.168. [DOI] [PMC free article] [PubMed] [Google Scholar]
- 3.Szalai G, Krishnamurthy R, Hajnóczky G. Apoptosis driven by IP(3)-linked mitochondrial calcium signals. EMBO J. 1999;18(22):6349–6361. doi: 10.1093/emboj/18.22.6349. [DOI] [PMC free article] [PubMed] [Google Scholar]
- 4.Rizzuto R, Brini M, Murgia M, Pozzan T. Microdomains with high Ca2+ close to IP3-sensitive channels that are sensed by neighboring mitochondria. Science. 1993;262(5134):744–747. doi: 10.1126/science.8235595. [DOI] [PubMed] [Google Scholar]
- 5.Rizzuto R, et al. Close contacts with the endoplasmic reticulum as determinants of mitochondrial Ca2+ responses. Science. 1998;280(5370):1763–1766. doi: 10.1126/science.280.5370.1763. [DOI] [PubMed] [Google Scholar]
- 6.Hailey DW, et al. Mitochondria supply membranes for autophagosome biogenesis during starvation. Cell. 2010;141(4):656–667. doi: 10.1016/j.cell.2010.04.009. [DOI] [PMC free article] [PubMed] [Google Scholar]
- 7.Csordás G, et al. Structural and functional features and significance of the physical linkage between ER and mitochondria. J Cell Biol. 2006;174(7):915–921. doi: 10.1083/jcb.200604016. [DOI] [PMC free article] [PubMed] [Google Scholar]
- 8.Simmen T, et al. PACS-2 controls endoplasmic reticulum-mitochondria communication and Bid-mediated apoptosis. EMBO J. 2005;24(4):717–729. doi: 10.1038/sj.emboj.7600559. [DOI] [PMC free article] [PubMed] [Google Scholar]
- 9.Szabadkai G, et al. Chaperone-mediated coupling of endoplasmic reticulum and mitochondrial Ca2+ channels. J Cell Biol. 2006;175(6):901–911. doi: 10.1083/jcb.200608073. [DOI] [PMC free article] [PubMed] [Google Scholar]
- 10.de Brito OM, Scorrano L. Mitofusin 2 tethers endoplasmic reticulum to mitochondria. Nature. 2008;456(7222):605–610. doi: 10.1038/nature07534. [DOI] [PubMed] [Google Scholar]
- 11.Giacomello M, et al. Ca2+ hot spots on the mitochondrial surface are generated by Ca2+ mobilization from stores, but not by activation of store-operated Ca2+ channels. Mol Cell. 2010;38(2):280–290. doi: 10.1016/j.molcel.2010.04.003. [DOI] [PubMed] [Google Scholar]
- 12.Csordás G, et al. Imaging interorganelle contacts and local calcium dynamics at the ER-mitochondrial interface. Mol Cell. 2010;39(1):121–132. doi: 10.1016/j.molcel.2010.06.029. [DOI] [PMC free article] [PubMed] [Google Scholar]
- 13.Chen Y, et al. Mitofusin 2-containing mitochondrial-reticular microdomains direct rapid cardiomyocyte bioenergetic responses via interorganelle Ca(2+) crosstalk. Circ Res. 2012;111(7):863–875. doi: 10.1161/CIRCRESAHA.112.266585. [DOI] [PMC free article] [PubMed] [Google Scholar]
- 14.Schneeberger M, et al. Mitofusin 2 in POMC neurons connects ER stress with leptin resistance and energy imbalance. Cell. 2013;155(1):172–187. doi: 10.1016/j.cell.2013.09.003. [DOI] [PMC free article] [PubMed] [Google Scholar]
- 15.Sebastián D, et al. Mitofusin 2 (Mfn2) links mitochondrial and endoplasmic reticulum function with insulin signaling and is essential for normal glucose homeostasis. Proc Natl Acad Sci USA. 2012;109(14):5523–5528. doi: 10.1073/pnas.1108220109. [DOI] [PMC free article] [PubMed] [Google Scholar]
- 16.Sugiura A, et al. MITOL regulates endoplasmic reticulum-mitochondria contacts via Mitofusin2. Mol Cell. 2013;51(1):20–34. doi: 10.1016/j.molcel.2013.04.023. [DOI] [PubMed] [Google Scholar]
- 17.Wasilewski M, et al. Optic atrophy 1-dependent mitochondrial remodeling controls steroidogenesis in trophoblasts. Curr Biol. 2012;22(13):1228–1234. doi: 10.1016/j.cub.2012.04.054. [DOI] [PMC free article] [PubMed] [Google Scholar]
- 18.Area-Gomez E, et al. Upregulated function of mitochondria-associated ER membranes in Alzheimer disease. EMBO J. 2012;31(21):4106–4123. doi: 10.1038/emboj.2012.202. [DOI] [PMC free article] [PubMed] [Google Scholar]
- 19.Daniele T, et al. Mitochondria and melanosomes establish physical contacts modulated by Mfn2 and involved in organelle biogenesis. Curr Biol. 2014;24(4):393–403. doi: 10.1016/j.cub.2014.01.007. [DOI] [PubMed] [Google Scholar]
- 20.Sandoval H, et al. Mitochondrial fusion but not fission regulates larval growth and synaptic development through steroid hormone production. eLife. 2014;3:e03558. doi: 10.7554/eLife.03558. [DOI] [PMC free article] [PubMed] [Google Scholar]
- 21.Rojo M, Legros F, Chateau D, Lombès A. Membrane topology and mitochondrial targeting of mitofusins, ubiquitous mammalian homologs of the transmembrane GTPase Fzo. J Cell Sci. 2002;115(Pt 8):1663–1674. doi: 10.1242/jcs.115.8.1663. [DOI] [PubMed] [Google Scholar]
- 22.Kornmann B, et al. An ER-mitochondria tethering complex revealed by a synthetic biology screen. Science. 2009;325(5939):477–481. doi: 10.1126/science.1175088. [DOI] [PMC free article] [PubMed] [Google Scholar]
- 23.Lahiri S, et al. A conserved endoplasmic reticulum membrane protein complex (EMC) facilitates phospholipid transfer from the ER to mitochondria. PLoS Biol. 2014;12(10):e1001969. doi: 10.1371/journal.pbio.1001969. [DOI] [PMC free article] [PubMed] [Google Scholar]
- 24.Debattisti V, Pendin D, Ziviani E, Daga A, Scorrano L. Reduction of endoplasmic reticulum stress attenuates the defects caused by Drosophila mitofusin depletion. J Cell Biol. 2014;204(3):303–312. doi: 10.1083/jcb.201306121. [DOI] [PMC free article] [PubMed] [Google Scholar]
- 25.Cosson P, Marchetti A, Ravazzola M, Orci L. Mitofusin-2 independent juxtaposition of endoplasmic reticulum and mitochondria: An ultrastructural study. PLoS One. 2012;7(9):e46293. doi: 10.1371/journal.pone.0046293. [DOI] [PMC free article] [PubMed] [Google Scholar]
- 26.Filadi R, et al. Mitofusin 2 ablation increases endoplasmic reticulum-mitochondria coupling. Proc Natl Acad Sci USA. 2015;112(17):E2174–E2181. doi: 10.1073/pnas.1504880112. [DOI] [PMC free article] [PubMed] [Google Scholar]
- 27.Alford SC, Ding Y, Simmen T, Campbell RE. Dimerization-dependent green and yellow fluorescent proteins. ACS Synth Biol. 2012;1(12):569–575. doi: 10.1021/sb300050j. [DOI] [PMC free article] [PubMed] [Google Scholar]
- 28.Sood A, et al. A Mitofusin-2-dependent inactivating cleavage of Opa1 links changes in mitochondria cristae and ER contacts in the postprandial liver. Proc Natl Acad Sci USA. 2014;111(45):16017–16022. doi: 10.1073/pnas.1408061111. [DOI] [PMC free article] [PubMed] [Google Scholar]
- 29.Bucha S, Mukhopadhyay D, Bhattacharyya NP. Regulation of mitochondrial morphology and cell cycle by microRNA-214 targeting Mitofusin2. Biochem Biophys Res Commun. 2015;465(4):797–802. doi: 10.1016/j.bbrc.2015.08.090. [DOI] [PubMed] [Google Scholar]
- 30.Cerqua C, et al. Trichoplein/mitostatin regulates endoplasmic reticulum-mitochondria juxtaposition. EMBO Rep. 2010;11(11):854–860. doi: 10.1038/embor.2010.151. [DOI] [PMC free article] [PubMed] [Google Scholar]
- 31.Chen H, et al. Mitochondrial fusion is required for mtDNA stability in skeletal muscle and tolerance of mtDNA mutations. Cell. 2010;141(2):280–289. doi: 10.1016/j.cell.2010.02.026. [DOI] [PMC free article] [PubMed] [Google Scholar]
- 32.Kamer KJ, Mootha VK. The molecular era of the mitochondrial calcium uniporter. Nat Rev Mol Cell Biol. 2015;16(9):545–553. doi: 10.1038/nrm4039. [DOI] [PubMed] [Google Scholar]
- 33.Kasahara A, Cipolat S, Chen Y, Dorn GW, 2nd, Scorrano L. Mitochondrial fusion directs cardiomyocyte differentiation via calcineurin and Notch signaling. Science. 2013;342(6159):734–737. doi: 10.1126/science.1241359. [DOI] [PubMed] [Google Scholar]
- 34.Chen Y, Dorn GW., 2nd PINK1-phosphorylated mitofusin 2 is a Parkin receptor for culling damaged mitochondria. Science. 2013;340(6131):471–475. doi: 10.1126/science.1231031. [DOI] [PMC free article] [PubMed] [Google Scholar]
- 35.Gong G, et al. Parkin-mediated mitophagy directs perinatal cardiac metabolic maturation in mice. Science. 2015;350(6265):aad2459. doi: 10.1126/science.aad2459. [DOI] [PMC free article] [PubMed] [Google Scholar]
- 36.Prudent J, et al. MAPL SUMOylation of Drp1 stabilizes an ER/mitochondrial platform required for cell death. Mol Cell. 2015;59(6):941–955. doi: 10.1016/j.molcel.2015.08.001. [DOI] [PubMed] [Google Scholar]
- 37.Song M, Mihara K, Chen Y, Scorrano L, Dorn GW., 2nd Mitochondrial fission and fusion factors reciprocally orchestrate mitophagic culling in mouse hearts and cultured fibroblasts. Cell Metab. 2015;21(2):273–285. doi: 10.1016/j.cmet.2014.12.011. [DOI] [PMC free article] [PubMed] [Google Scholar]
- 38.Raffaello A, et al. The mitochondrial calcium uniporter is a multimer that can include a dominant-negative pore-forming subunit. EMBO J. 2013;32(17):2362–2376. doi: 10.1038/emboj.2013.157. [DOI] [PMC free article] [PubMed] [Google Scholar]
- 39.Luke G, Escuin H, De Felipe P, Ryan M. 2A to the fore—Research, technology and applications. Biotechnol Genet Eng Rev. 2010;26:223–260. doi: 10.5661/bger-26-223. [DOI] [PubMed] [Google Scholar]
- 40.Matkovich SJ, Dorn GW., 2nd Deep sequencing of cardiac microRNA-mRNA interactomes in clinical and experimental cardiomyopathy. Methods Mol Biol. 2015;1299:27–49. doi: 10.1007/978-1-4939-2572-8_3. [DOI] [PMC free article] [PubMed] [Google Scholar]
- 41.Frezza C, Cipolat S, Scorrano L. Organelle isolation: Functional mitochondria from mouse liver, muscle and cultured fibroblasts. Nat Protoc. 2007;2(2):287–295. doi: 10.1038/nprot.2006.478. [DOI] [PubMed] [Google Scholar]


