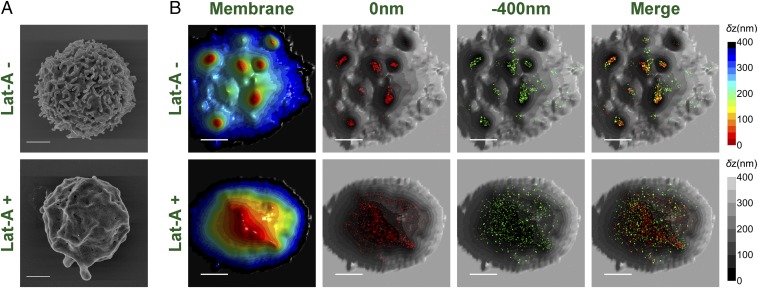
Significance
T lymphocytes play a central role in cell-mediated immunity. Their surfaces are covered by narrow and short protrusions called microvilli. It is not known whether there is a role for microvilli in the immune response. To shed light on this question, we probed the location of T-cell receptors (TCRs), the molecules that initiate the immune response of T cells, with respect to the 3D structure of microvilli. Superresolution optical microscopy showed that TCRs are highly concentrated on microvilli. Previous studies stressed the role of small clusters of TCRs in the immune process; our study provides a natural explanation as to how these clusters form.
Keywords: T-cell receptor, microvilli, superresolution microscopy, membrane protein clusters, total internal reflection microscopy
Abstract
Leukocyte microvilli are flexible projections enriched with adhesion molecules. The role of these cellular projections in the ability of T cells to probe antigen-presenting cells has been elusive. In this study, we probe the spatial relation of microvilli and T-cell receptors (TCRs), the major molecules responsible for antigen recognition on the T-cell membrane. To this end, an effective and robust methodology for mapping membrane protein distribution in relation to the 3D surface structure of cells is introduced, based on two complementary superresolution microscopies. Strikingly, TCRs are found to be highly localized on microvilli, in both peripheral blood human T cells and differentiated effector T cells, and are barely found on the cell body. This is a decisive demonstration that different types of T cells universally localize their TCRs to microvilli, immediately pointing to these surface projections as effective sensors for antigenic moieties. This finding also suggests how previously reported membrane clusters might form, with microvilli serving as anchors for specific T-cell surface molecules.
Circulating leukocytes have a distinctive surface topography dominated by finger-like membranous protrusions, the microvilli (1). Unlike the uniform and regular-sized microvilli found in the intestinal brush border, microvilli on immune cells are highly flexible and dynamic (1–3). Although a role for microvilli in leukocyte capture to blood vessel walls has been demonstrated (4, 5), a physiological role for these projections in the immune response of T cells outside of the vasculature has not yet been established.
Going beyond morphological studies requires probing receptor distribution on microvilli and other compartments on leukocyte membranes. The largest obstacles in performing such studies are the thin and short dimensions of microvilli, which require higher resolution than that offered by standard fluorescence microscopy. Therefore, studies of protein distribution in relation to immune cell microvilli have heavily relied on electron microscopy (EM) methods. Indeed, several EM studies of immunogold-labeled surface molecules proposed that some membrane proteins are preferentially localized on microvilli in T cells and macrophages (6–8), whereas other proteins were found to be enriched on the cell body between microvilli (9, 10). Although these earlier studies promoted the idea that microvilli serve as distinctive membranal regions on which certain membrane proteins are selectively localized, they suffered from problems inherent to EM such as sample distortion during the preparation process, as well as artifacts arising from the relatively bulky gold particles and their tendency to stick together (11–13). A fluorescence-based method should be able to overcome these problems.
T-cell receptors (TCRs) are membrane protein complexes that recognize antigens as part of the primary steps of adaptive immunity. A TCR is composed of a heterodimer of α- and β-subunits and a cluster of differentiation 3 (CD3) complex (14). The antigen–TCR recognition event and its consequences, culminating in the formation of the immunological synapse (IS) (15–17), have been extensively studied. Fluorescence imaging studies using a variety of methods, including superresolution microscopy, have demonstrated that, even before activation by an antigen, TCRs are not randomly distributed on the cell surface, but exist as preformed microclusters of an average size of tens of nanometers (18–20). It was further shown that, upon activation, TCRs assemble into larger clusters while concentrating in the central region of the IS (17, 18, 21, 22). However, the distribution of TCR microclusters in relation to the 3D architecture of the T-cell membrane has not been explored.
In the current study, we aim to amend this deficiency by mapping the spatial arrangement of TCRs with respect to the 3D topography of the membrane in T cells. Our methodology merges together two superresolution fluorescence techniques, variable-angle total internal reflection microscopy (VA-TIRFM) and stochastic localization nanoscopy (SLN). It obtains similar spatial resolution to immunogold EM, yet does not suffer from this method’s problems. The method allows us to observe that the TCRs of both types of T cells are highly enriched on microvilli compared with the cell body. Our results suggest that these dynamic projections serve as sensors for antigenic moieties and that, once T-cell clones generate stable contacts with the correct antigen-presenting cell (APC) that presents their cognate antigen, these microvilli may serve as physical barriers for the diffusion and random mixing of surface proteins.
Results
Resting and Differentiated T Cells in Peripheral Blood, as well as T Cells Migrating Inside Lymph Nodes, Exhibit Numerous Microvilli.
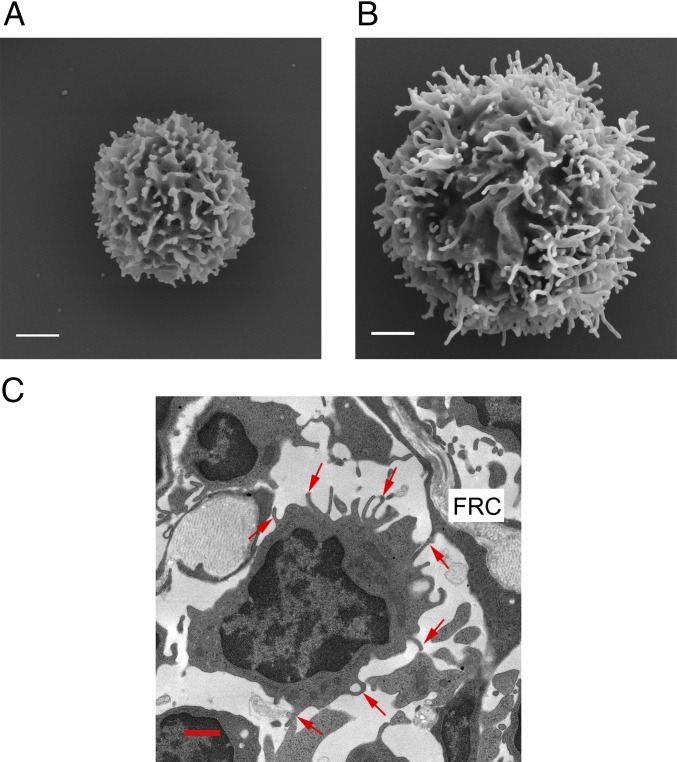
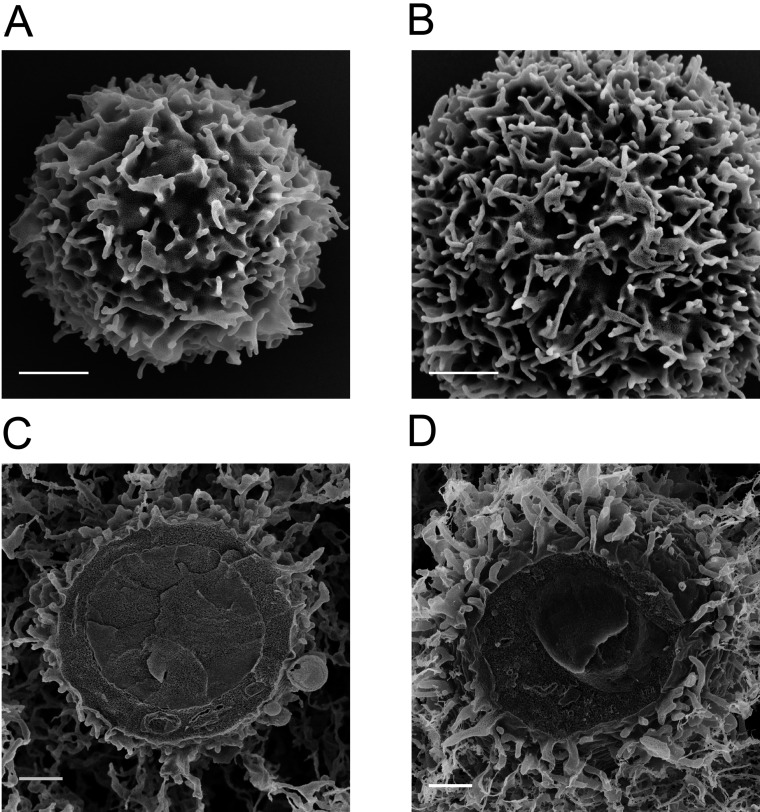
In this work, we studied two types of T cells, human resting T cells, and effector T cells differentiated from the blood-derived pools of naïve and memory resting T cells following TCR activation and expansion by IL-2 (23). The latter serve as models for antigen-activated T cells that have differentiated into Th1 and Tc1 subsets in the presence of IL-2 (24). We first used scanning electron microscopy (SEM) to image microvilli on these cells. Microvilli were found to be of a diameter of 70–100 nm and a length that varied from 0.1 μm to several micrometers (Fig. 1 A and B, and Fig. S1). Consistent with the literature (25), effector T cells were about twice as large in cell diameter as resting T cells. Their microvilli were found to be longer, although their mean diameter was comparable to that of resting T cells.
Fig. 1.
Microvilli on T-cell surfaces. (A and B) SEM images of resting (A) and effector (B) peripheral blood human T cells. (White scale bars: 1 μm.) (C) TEM image of T cells in a mouse lymph node. The T-cell zone is identified by the presence of the collagen fiber-containing fibroblastic reticular cells (FRCs). Red arrows indicate microvilli. (Red scale bar: 1 μm.)
Fig. S1.
Morphologies of resting versus effector human T cells. (A and B) Representative SEM images of resting (A) and effector (B) human CD4+ T cells obtained with a magnification of 50,000×. (Scale bars: 1 μm.) (C and D) Representative cryo-SEM images of resting (C) and effector (D) human CD4+ T cells obtained with a magnification of 25,000×. (Scale bars: 1 μm.)
Interestingly, several EM studies reported well-maintained 3D structures of microvilli at T-cell–APC (26, 27) or T-cell–T-cell interfaces (28) in vitro. Nevertheless, the presence of these structures in T cells migrating inside lymph nodes in search for antigen in vivo has been disputed (29–33). We therefore tested whether microvilli are also maintained by T cells within the T zones of secondary lymphoid organs. Using transmission electron microscopy (TEM), we imaged these T-cell zones in murine peripheral lymph nodes and found that T cells migrating over stromal cells before or during probing of adjacent dendritic cells retain multiple microvilli on their surfaces (Fig. 1C). This finding points to a possible role of the microvilli in the immune response. We therefore turned to study the distribution of TCR molecules in relation to microvilli on both resting and effector T cells.
Mapping Membrane Proteins in Relation to Microvilli.
We developed a strategy for determining at nanometer resolution the location of membrane molecules with respect to surface structures, using a synergistic combination of two types of fluorescence microcopy: VA-TIRFM resolves the 3D topography of the cell, and SLN obtains the position of molecules with respect to this topography.
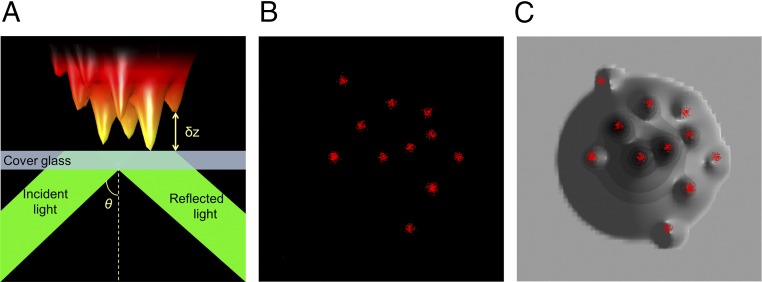
VA-TIRFM (34–36) is based on the physics of the exponentially decaying TIRF illumination as a function of the distance from the glass coverslip (Fig. 2A). The penetration depth of the TIRF evanescent field [d(θ)] is tunable by changing the angle of incidence, θ (Table S1). With a known d(θ), the relative intensity of fluorescence at each point in the image can be used to calculate its distance (δz) from the glass surface. The set of δz values can then be used to construct a 3D image of the fluorescently labeled cell membrane. It is possible to increase the statistical precision of the resulting image by combining measurements at several values of θ (Fig. S2).
Fig. 2.
Combining VA-TIRFM and SLN for locating molecules with respect to microvilli. (A) A schematic TIRFM configuration. θ is the incident angle of light on the surface. A model membrane surface with microvilli is shown as placed on the glass surface. The distance from the glass to the surface of the object is defined as δz (Materials and Methods) and is obtained from analysis of measured images. (B) A hypothetical SLN image. (C) The image in B is overlaid on a reconstructed image of the model membrane surface of A, showing that the molecules are localized to the microvilli.
Table S1.
Optical parameters corresponding to the eight images (Fig. S2G) collected in a VA-TIRFM series
| Optical parameter | Image 1 | Image 2 | Image 3 | Image 4 | Image 5 | Image 6 | Image 7 | Image 8 |
| Distance, mm | 2.44 | 2.46 | 2.49 | 2.51 | 2.54 | 2.57 | 2.59 | 2.62 |
| Angle of incidence, ° | 63.0 | 64.2 | 65.5 | 66.8 | 68.2 | 69.7 | 71.2 | 73.0 |
| Penetration depth, nm | 377 | 187 | 141 | 118 | 103 | 93 | 85 | 79 |
The angle of incidence (θ) is calculated as follows: . We used an objective lens (UAPON 100×OTIRF; Olympus) whose focal length (FL) is 1.8 mm and numerical aperture (N.A.) is 1.49, and the refractive index of glass and oil n1 is 1.52. In the setup, the distance is measured by reading the scale of a linear travel translation stage. The penetration depth of the evanescent wave at the different θ is calculated by the following: , where λ is wavelength (532 nm), n1 is refractive index of glass coverslip and oil (1.52), and n2 is refractive index of blinking buffer (1.35), as measured by a refractometer at 23 °C.
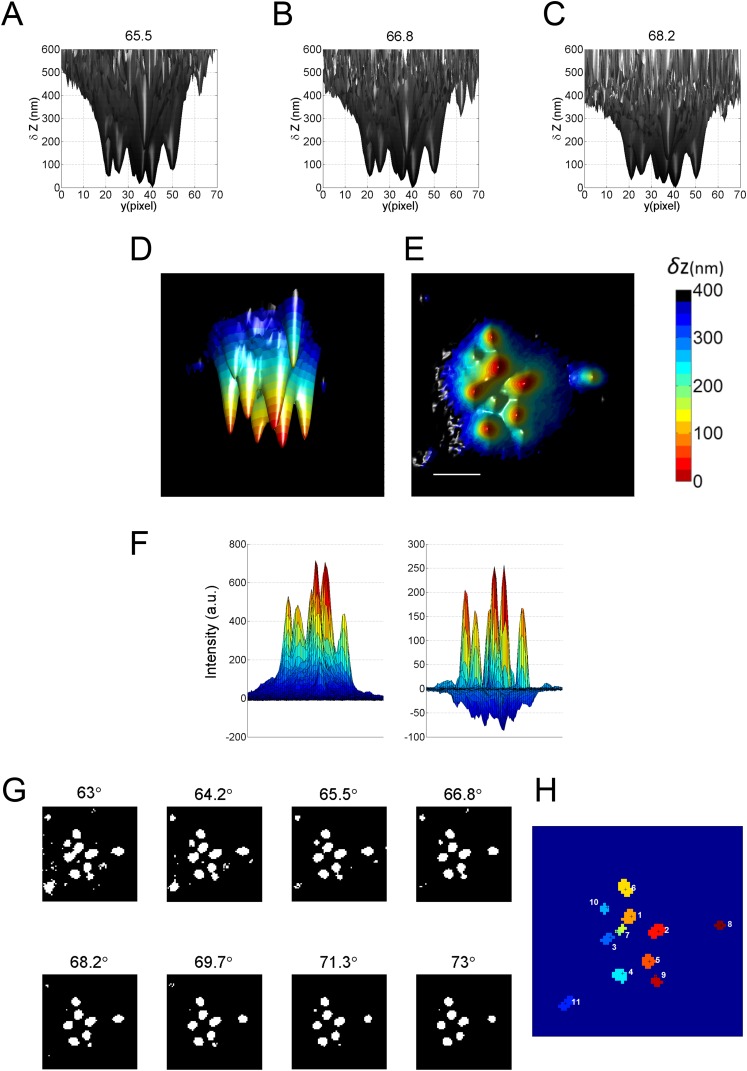
Fig. S2.
Reconstruction of 3D surface of a T cell from VA-TIRFM and determination of microvilli regions (the LocTips map). (A–C) A series of 3D surface reconstruction maps of a T cell from TIRFM images, based on calculated δz values from TIRFM measurements at angles of incidence 65.5° (A), 66.8° (B), and 68.2° (C) under weak illumination of a 532-nm laser. The δz map is shown from a direction perpendicular to the x–z plane. (D) A representative 3D surface reconstruction map of a T cell, calculated as the mean of δz values of A–C. The δz values are represented by different hues with a step size of 25 nm. (E) A bottom-to-top 2D projection of D. (Scale bar: 1 μm.) (F) An example of a TIRFM image (Left) and its Laplacian of Gaussian (LoG) filter image (Right). (G) The regions above a threshold value of 5 in LoG filter images (white) from a series of images acquired at variable angles of incidence (indicated above each image). (H) A LocTips map. The segmentation map of distinguishable protruding areas is determined by combining a series of segmentation analyses of VA-TIRFM measurements at incident angles from 63° to 73°. Each individual microvillus is numbered according to its proximity to the surface (1 is the most proximate). The coordinates of the pixel of minimum δz in each individual microvillus are marked (black cross). Using the segmentation maps of multiple cells, we can estimate that the density of microvilli on the T-cell surface is 3 ± 0.5 per μm2. This density compares well with the density obtained from SEM images, which is 4.5 ± 0.5 per μm2, and with literature values (2–4 per μm2; see ref. 1).
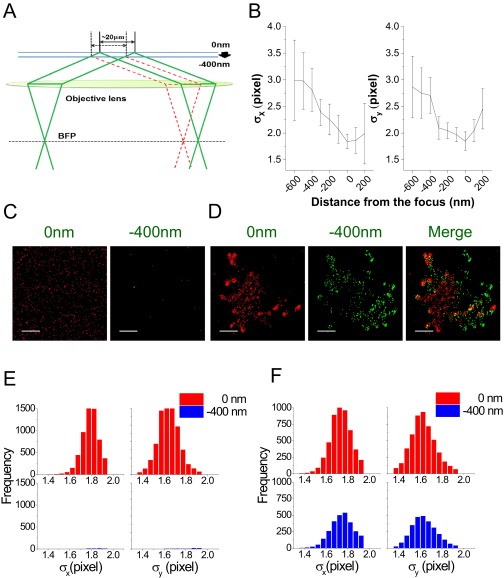
SLN is a form of superresolution fluorescence microscopy in which bursts of photons from blinking labeled molecules are used to localize them with accuracy well below the diffraction limit (37, 38) (Fig. 2B). We implemented a simple technique that enables measuring molecules located on two different planes in the z direction, which we term dual-plane SLN (Fig. S3). In this technique, a piezo stage is used to move the sample up or down (Fig. S3A), and data recording is repeated, leading effectively to the collection of signals from molecules at different planes in the sample. Sectioning is achieved by rejecting out-of-focus images of single molecules during the localization procedure. By combining the images obtained from VA-TIRFM and SLN, we obtained a map of the positions of membrane molecules of interest in relation to the 3D topographical distribution of T-cell microvilli (Fig. 2C).
Fig. S3.
Dual-plane SLN. (A) Schematic TIRFM configurations at the original position of piezo stage for the optimum focus (0-nm focal plane; green solid line) and at a stage position moved down to −400 nm (−400-nm focal plane; red dashed line). The size of the TIRFM illumination area is ∼20 µm, and the overlap between illuminated regions at the two focal planes is large enough for capturing a single cell. The z motion of the stage does not affect the angle of incidence. (B) Defocusing effect on a size of the image of a single molecule projected on the image plane, measured by the change of the width (σx and σy) values calculated from 2D Gaussian fits. Images of sparsely distributed fluorescent beads adsorbed on a cover glass (∼110-nm Tetraspec; Invitrogen; ∼10 beads per field of view) were acquired at different focal planes by moving down the piezo stage with a step size of 100 nm. The distance from the focus is the relative z position of the sample stage away from the best focus (0 nm) on the image plane of the EMCCD camera. (C and D) Dual-plane SLN images of Alexa 647-labeled anti-IgG antibodies bound on a PLL-coated surface (C) and of a T cell labeled with Alexa 647-labeled anti–L-selectin antibodies (D). Representative SLN images acquired at the 0-nm focal plane (red dots) and at the −400-nm focal plane (green dots) are presented. (Scale bars: 1 μm.) (E and F) Histograms of σx and σy values corresponding to molecules detected in C and D are shown in the upper (0 nm) and lower (−400 nm) panels of E and F, respectively.
Specific membrane proteins of studied T cells, either resting or effectors, were labeled using fluorescent antibodies, and the cells were fixed and stained with a membrane dye. Using VA-TIRFM, we resolved the finger-like structure of T-cell microvilli. Based on measurements with three different angles of incidence, 65.5°, 66.8°, and 68.6°, we reconstructed an average 3D topographical map of the T-cell surface (Fig. S2 A–E). We then analyzed the images and prepared maps of regions of individual microvilli and their tip positions, which we termed LocTips maps (Fig. S2 F–H). Using SLN, we localized labeled membrane proteins with a ∼10-nm accuracy at two focal planes, 0 and −400 nm. The measurement at two different planes ensured that proteins localized on membrane regions situated somewhat further from the surface due to the length of microvillar protrusions of resting T cells [∼300–400 nm (1)] would not be overlooked. In fact, given the significant depth of focus, and given the high laser power used in the superresolution measurements, focusing on the −400-nm plane guaranteed that even molecules a couple of hundreds of nanometers above this plane will be imaged.
We first tested our methodology by applying it to three familiar cell membrane molecules. We show that, although two of these, L-selectin and CD44, have distinct locations with respect to microvilli, CD45 is spread randomly over the whole membranes. A similar approach is then applied to study the 3D organization of the TCR. These studies are discussed in the next two sections.
Three Control Cases Demonstrate the Power of the 3D Localization Methodology.
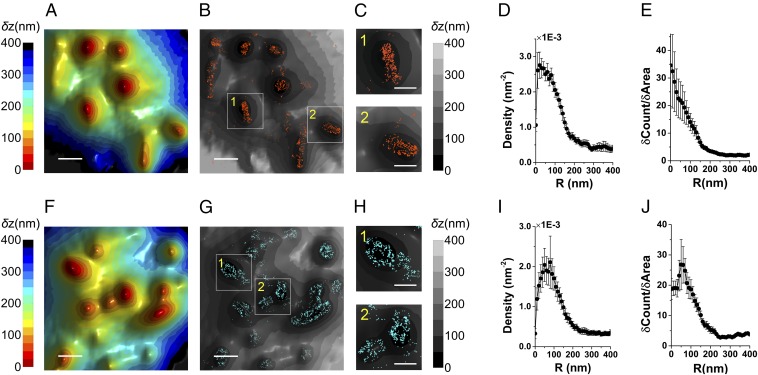
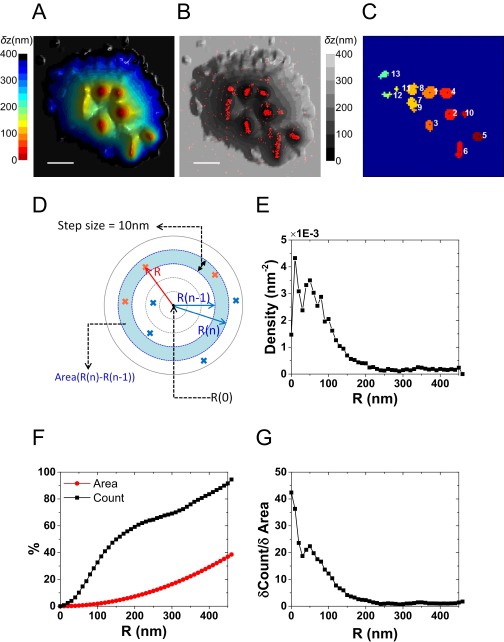
Immunogold studies pointed to the localization of L-selectin on microvilli and CD44 on the cell body (6, 10, 39). We used our VA-TIRFM/SLN methodology to test these results. Both resting and effector T cells were labeled with Alexa 647-conjugated anti–L-selectin, anti-CD44, or anti-CD45, whereas the plasma membrane of these cells was stained with FM1-43FX. We performed VA-TIRFM experiments together with dual-plane SLN. Our experiments indicated that the locations of L-selectin molecules overlap with the protruding areas of the 3D membrane reconstruction map (Fig. 3 and Fig. S4). To determine quantitatively the distribution of L-selectin molecules, we developed two analogous analytical methods by which we compared the SLN coordinates of molecules to the positions of microvilli tips, defined as the centers of the pixels of minimum δz in LocTips maps (Fig. S5). In the first method, the molecules found within 10-nm-wide rings centered at an increasing distance from the tips of microvilli (Fig. S5D) were counted, and the numbers were normalized by the ring areas (Fig. 3D and Fig. S5E). In the second method, the cumulative fractional increase of the number of molecules on a cell was calculated as a function of the distance from the tips, as was the cumulative fractional increase in the area (Fig. S5F). The ratio of the slopes of these two curves was then calculated and presented (Fig. S5G). This method is based on the notion that, if molecules are densely localized on the microvilli, the increase of the fraction of their counts near the tips would be steeper than the increase of fraction of area. Both analyses showed that L-selectin molecules are located close to the microvilli tips (Fig. 3E and Fig. S4H).
Fig. 3.
Localization of L-selectin and CD44 on the 3D surface topography of T cells. (A) Three-dimensional surface reconstruction of a resting human T-cell membrane using VA-TIRFM. (Scale bar: 0.5 μm.) (B) Localization map (0 nm) of L-selectin molecules (orange dots) overlaid on the 3D surface reconstruction map from A (gray scale). (C) Magnified images of the regions marked 1 and 2 in B. (Scale bar: 0.25 μm.) (D) Density plots of L-selectin as a function of distance from microvilli tips. (E) Cumulative increase of the fraction of total molecules of L-selectin on each cell as a function of the distance from the tips, normalized by the cumulative increase in the fraction of area. (F) Three-dimensional surface reconstructions of an effector human T-cell membrane. (Scale bar: 0.5 μm.) (G) Localization map (0 nm) of CD44 molecules (cyan dots) overlaid on the 3D surface reconstruction map from F (gray scale). (H) Magnified images of the regions marked 1 and 2 in G. (Scale bar: 0.25 μm.) (I) Density plots of CD44 as a function of distance from microvilli tips. (J) Cumulative increase of the fraction of total molecules of CD44 on each cell as a function of the distance from the tips, normalized by the cumulative increase in the fraction of area. In D, E, I, and J, the plots are averages over all cells measured. Error bars represent standard errors of the mean.
Fig. S4.
Mapping the distribution of L-selectin molecules in relation to the 3D surface topography. (A–D) A full-size image of the 3D surface reconstruction map of the cell and overlaid SLN images of L-selectin (red dots, 0 nm; green dots, −400 nm) shown in Fig. 3 A–C. (Scale bar: 1 μm.) (E and F) The densities of the L-selectin localizations within the area of cell body (CB) (blue), microvilli (MV) (wine), and background (BG) (green) calculated based on the area segmentation maps of 10 resting T cells and 3 effector T cells measured at a focal plane of 0 nm (E) and −400 nm (F). (G) Density plot of L-selectin molecules as a function of distance from microvilli tips. (H) Cumulative increase of the fraction of total molecules on each cell as a function of the distance from the tips, normalized by the cumulative increase in the fraction of area. In G and H, the plots are averages over all cells measured. Error bars represent standard errors of the mean.
Fig. S5.
Construction of density plots from superresolution data. (A) A full-size image of the 3D surface reconstruction map of the cell shown in Fig. 3A. The δz values are represented by different hues with a step size of 25 nm. (Scale bar: 1 μm.) (B) Localization map (0 nm) of L-selectin molecules (red dots) overlaid on the 3D surface reconstruction map from A (gray scale). (C) The LocTips map. The coordinates of the minimum δz pixel for each microvillus are marked. (D) A schematic cross-section of a single microvillus in x–y plane. R(0) depicts the center of the microvillus and R(n) is the distance of the nth 10-nm-wide ring from the center. Molecules found within this ring are marked (red crosses). (E) Density plot of L-selectin molecules as a function of distance from microvilli tips. (F) Cumulative increase of the fraction of total L-selectin molecules (black) and cumulative increase of the fraction of area (red) on the cell from A as a function of the distance from the tips. (G) The values in black in F are normalized by the values in red.
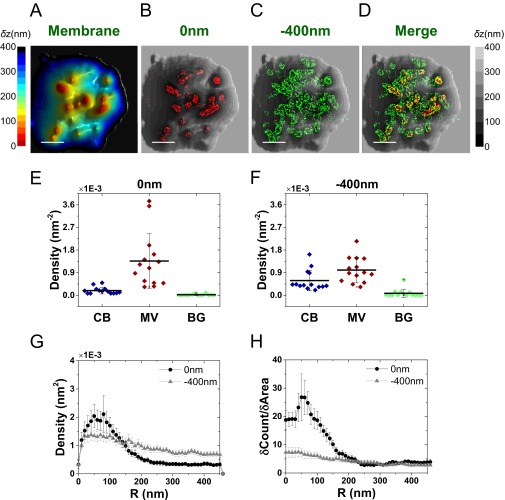
The same type of experiment and analysis indicated that CD44 is excluded from T-cell microvilli. However, rather than being homogenously distributed on the cell body, CD44 molecules appeared as annular shapes around individual microvilli (Fig. 3 F–H and Fig. S6 A–D). Moreover, unlike with L-selectin, density plots for CD44 molecules in Fig. 3 I and J (Fig. S6 G and H) showed a distinct and very clear peak at a radius of ∼50 nm, indicating the depletion of CD44 molecules from the microvilli. Because the typical diameter of microvilli is about 70–100 nm, these results suggest that CD44 molecules, although not localized on microvilli, are not randomly distributed on the cell body, but are rather clustered in rings around the bottom of individual microvillar projections. It is possible that this distribution is dictated by the steep curvature at the base of microvilli, as it is known that membrane curvature may aid in sorting and positioning proteins (40, 41). Further studies of this phenomenon are deferred to future work.
Fig. S6.
Mapping the distribution of CD44 molecules in relation to the 3D surface topography. (A–D) A full-size image of the 3D surface reconstruction map of the cell and overlaid SLN images of CD44 (red dots, 0 nm; green dots, −400 nm) shown in Fig. 3 F–H. (Scale bar: 1 μm.) (E and F) The densities of the CD44 localizations within the area of cell body (CB) (blue), microvilli (MV) (wine), and background (BG) (green) calculated based on the area segmentation maps of eight resting T cells and six effector T cells measured at a focal plane of 0 nm (E) and −400 nm (F). (G) Density plot of CD44 molecules as a function of distance from microvilli tips. (H) Cumulative increase of the fraction of total molecules on each cell as a function of the distance from the tips, normalized by the cumulative increase in the fraction of area. In G and H, the plots are averages over all cells measured. Error bars represent standard errors of the mean.
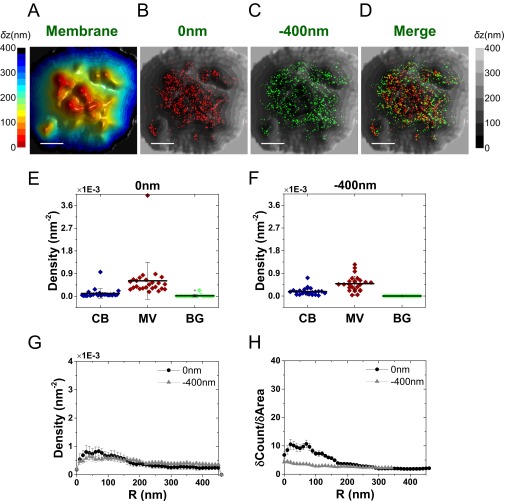
Finally, we tested the localization of CD45, a protein tyrosine phosphatase that is one of most universally expressed surface receptors on leukocytes (42, 43). In clear distinction to L-selectin and CD44, this protein was found to be randomly distributed on both microvilli and cell body areas (Fig. S7). The three different localization patterns obtained for L-selectin, CD44, and CD45 demonstrate the capability of our method in mapping the positions of receptor proteins with respect to surface topography.
Fig. S7.
Mapping the distribution of CD45 molecules in relation to the 3D surface topography. (A–D) Representative 3D topographical surface maps and overlaid SLN images of CD45 (red dots, 0 nm; green dots, −400 nm). (Scale bar: 1 μm.) (E and F) The densities of the CD45 localizations within the area of cell body (CB) (blue), microvilli (MV) (wine), and background (BG) (green) calculated based on the area segmentation maps of 25 resting T cells measured at a focal plane of 0 nm (E) and −400 nm (F). (G) Density plot of CD45 molecules as a function of distance from microvilli tips. (H) Cumulative increase of the fraction of total molecules on each cell as a function of the distance from the tips, normalized by the cumulative increase in the fraction of area. In G and H, the plots are averages over all cells measured. Error bars represent standard errors of the mean.
Distribution of TCRs in Relation to the 3D Topography of the T-Cell Membrane.
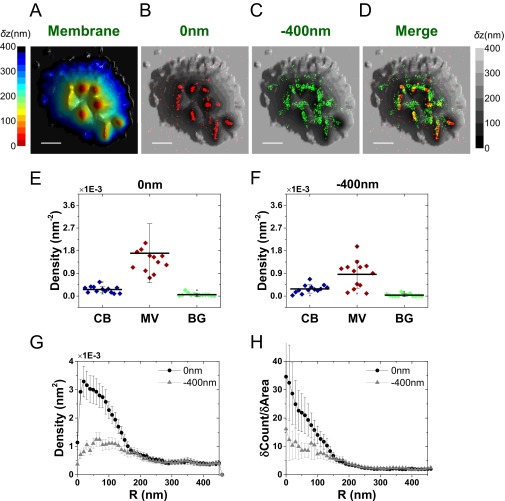
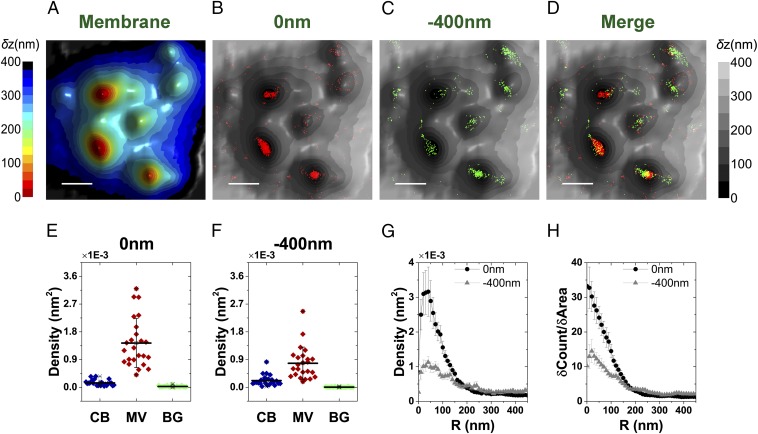
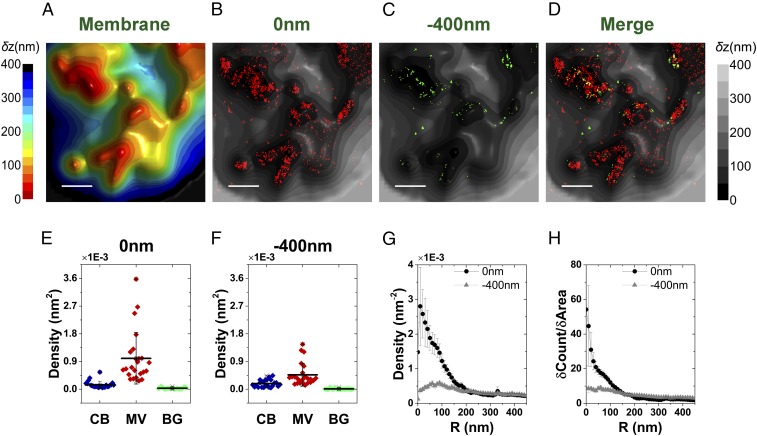
Once showing the power of the combined VA-TIRFM/SLN experiment in determining the location of membrane proteins with respect to microvilli, we turned to the primary goal of this work, which was to find the spatial relation of TCRs and the microvilli of T cells. We first performed experiments on resting T cells labeled with Alexa 647-conjugated antibodies that recognize the extracellular domain of the αβTCR joining segment. As shown in Fig. 4 and Fig. S8, regions of high molecular density of αβTCR molecules overlapped with regions of microvilli on the 3D surface reconstruction map.
Fig. 4.
Mapping the distribution of αβTCR molecules in relation to the 3D surface topography of resting T cells. (A) Representative 3D surface reconstruction map of a human resting T-cell membrane, obtained from VA-TIRFM measurements. The δz values are represented by different hues with a step size of 25 nm. (Scale bar: 0.5 μm.) (B–D) Localization maps (red dots: 0 nm; green dots: −400 nm) of αβTCR molecules on the cell from A, overlaid with the 3D surface reconstruction map (gray scale). (E and F) The densities of the αβTCR localizations within the area of cell body (CB) (blue), microvilli (MV) (wine), and background (BG) (green) calculated based on the area segmentation maps of 24 resting T cells measured at a focal plane of 0 nm (E) and −400 nm (F). (G) Density plot of αβTCR molecules as a function of distance from microvilli tips. (H) Cumulative increase of the fraction of total molecules on each cell as a function of the distance from the tips, normalized by the cumulative increase in the fraction of area. In G and H, the plots are averages over all cells measured. Error bars represent standard errors of the mean.
Fig. S8.
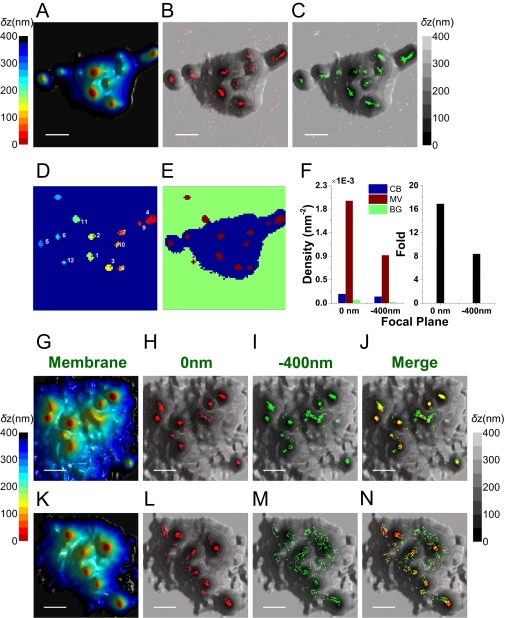
Mapping the distribution of αβTCR molecules in relation to the 3D surface topography of a resting T cell. (A) A full-size image of the 3D surface reconstruction map of the cell shown in Fig. 4A. The δz values are represented by different hues with a step size of 25 nm. (Scale bar: 1 μm.) (B and C) Localization maps of αβTCR molecules [red dots, 0 nm (B); green dots, −400 nm (C)] overlaid on the 3D surface reconstruction map from A (gray scale). (D) The LocTips map. The minimum δz pixel coordinates for each microvillus are marked. TCR molecules that were localized on microvilli situated closer to the glass surface (areas numbered 1–6) were mostly detected in the 0-nm focal plane SLN image in B, whereas TCR molecules on microvilli that appeared further from the glass surface (numbered 7–10) were detected in the −400-nm focal plane image in C. (E) A segmentation map for defining the cell body (CB) (blue), microvilli (MV) (wine), and background (BG) (green) areas. The LocTips map was used for defining the MV area. The rest of the area was divided into CB (δz < 400 nm) and BG (δz > 400 nm). (F, Left) The densities of the αβTCR localizations within CB (blue), MV (wine), and BG (green) areas calculated based on the area segmentation maps of E. (Right) The fold increase values of the density in MV over CB were calculated after subtracting the density of BG from each. (G–N) Representative 3D topographical surface maps and overlaid SLN images of αβTCRs (red dots, 0 nm; green dots, −400 nm) from two different resting T cells. (Scale bars: 1 μm.)
To quantify the density of TCR molecules in relation to the topography of the T cells, we partitioned the images into three regions: microvilli, cell body, and background (see Fig. S8 A–F for a description of the partition method). The number of molecules in each of these regions was counted and normalized by the corresponding area. The distribution of values obtained for each region based on the two imaged planes (0 and −400 nm) is shown in Fig. 4 E and F. These figures demonstrate a dramatic increase (fourfold to sixfold on the average) in the density of TCR molecules on microvilli compared with the cell body. A similar conclusion was reached based on the application of the two quantitative analysis methods introduced in the previous section (Fig. 4 G and H).
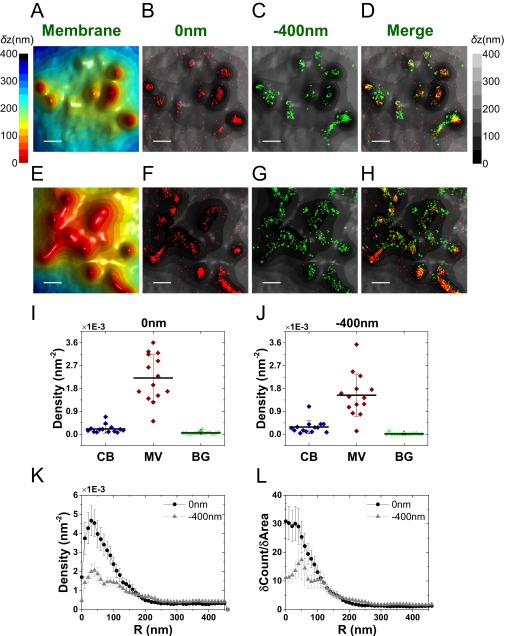
We further examined cells labeled with an additional component of the TCR complex using anti-CD3ε antibodies. As in the case of αβTCR, CD3ε was also highly enriched on the microvilli of resting T cells (Fig. S9). Taken together, these results support our conclusion that the TCR complexes of resting T cells are preclustered on microvilli and are essentially excluded from cell body regions.
Fig. S9.
Mapping the distribution of CD3ε molecules in relation to the 3D surface topography of resting T cells. (A–H) Representative 3D topographical surface maps and overlaid SLN images of CD3ε (red dots, 0 nm; green dots, −400 nm) from two representative resting T cells. (Scale bar: 0.5 μm.) (I and J) The densities of the CD3ε localizations within the area of cell body (CB) (blue), microvilli (MV) (wine), and background (BG) (green) calculated based on the area segmentation maps of 14 resting T cells measured at a focal plane of 0 nm (I) and −400 nm (J). (K) Density plot of CD3ε molecules as a function of distance from microvilli tips. (L) Cumulative increase of the fraction of total molecules on each cell as a function of the distance from the tips, normalized by the cumulative increase in the fraction of area. In K and L, the plots are averages over all cells measured. Error bars represent standard errors of the mean.
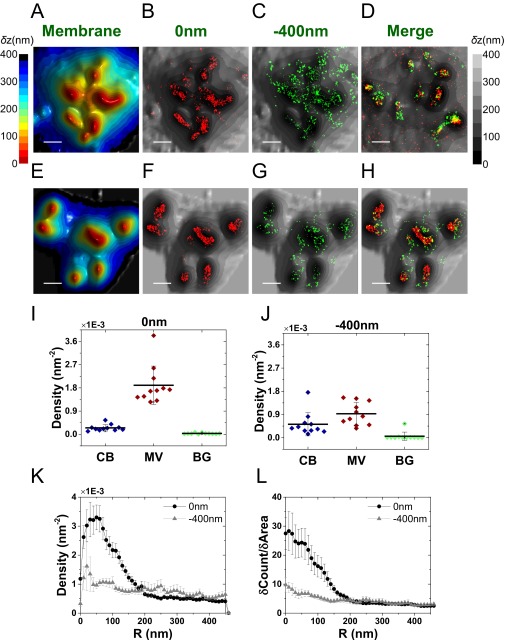
We next asked whether this striking TCR distribution is conserved among effector cells differentiated from the resting T cells. Using a similar labeling strategy and identical analytical approaches to the above, it was found that effector T cells, although larger than resting cells, retain the localization of both αβTCR subunits (Fig. 5 A–D) and their associated CD3ε subunits (Fig. S10) to microvilli. The measured molecular densities of both TCR components on microvilli regions were somewhat lower compared with resting T cells (Fig. 5 E and F), likely due to the more complex structures of these microvilli (Fig. 1B and Fig. S1 B and D).
Fig. 5.
Mapping the distribution of αβTCR molecules in relation to the 3D surface topography of effector T cells. (A) Representative 3D surface reconstruction map of a human T-cell membrane, calculated as the mean of δz values obtained from VA-TIRFM measurements. The δz values are represented by different hues with a step size of 25 nm. (Scale bar: 0.5 μm.) (B–D) Localization maps (red dots: 0 nm; green dots: −400 nm) of αβTCR molecules on the cell from A, overlaid with the 3D surface reconstruction map (gray scale). Cells were labeled with Alexa 647-conjugated anti-αβTCR antibodies, and membranes were stained with FM1-43FX. (Scale bars: 0.5 μm.) (E and F) The densities of the αβTCR localizations within the area of cell body (CB) (blue), microvilli (MV) (wine), and background (BG) (green) calculated based on the area segmentation maps of 24 effector T cells measured at a focal plane of 0 nm (E) and −400 nm (F). (G) Density plot of αβTCR positions as a function of distance from microvilli tips. (H) Cumulative increase of the fraction of total molecules on each cell as a function of the distance from the tips, normalized by the cumulative increase in the fraction of area. In G and H, the plots are averages over all cells measured. Error bars are standard errors of the mean.
Fig. S10.
Mapping the distribution of CD3ε molecules in relation to the 3D surface topography of effector T cells. (A–H) Representative 3D topographical surface maps and overlaid SLN images of CD3ε (red dots, 0 nm; green dots, −400 nm) from two representative effector T cells. (Scale bar: 0.5 μm.) (I and J) The densities of the CD3ε localizations within the area of cell body (CB) (blue), microvilli (MV) (wine), and background (BG) (green) calculated based on the area segmentation maps of 11 effector T cells measured at a focal plane of 0 nm (I) and −400 nm (J). (K) Density plot of CD3ε molecules as a function of distance from microvilli tips. (L) Cumulative increase of the fraction of total molecules on each cell as a function of the distance from the tips, normalized by the cumulative increase in the fraction of area. In K and L, the plots are averages over all cells measured. Error bars represent standard errors of the mean.
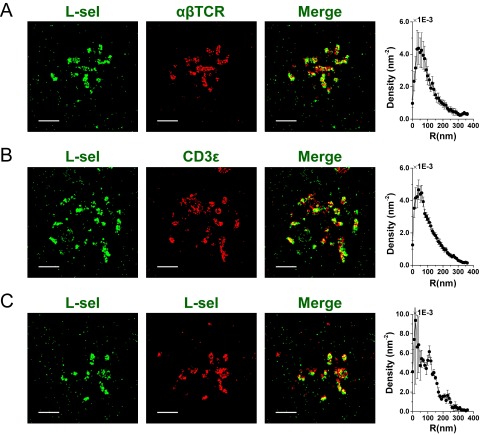
Finally, to validate the above results, we also performed a dual-color SLN experiment in which we localized both L-selectin and TCR molecules, using antibodies to either αβTCR or CD3ε subunits. Because we could not obtain a map of the cell surface in tandem with the localization of two membrane proteins, we took the L-selectin molecular positions as markers for microvilli positions and calculated the distribution of TCR localizations with respect to these. The results are shown in Fig. S11 and provide another confirmation for the localization of TCR molecules on microvilli.
Fig. S11.
Mapping the distribution of αβTCR and CD3ε molecules in relation to L-selectin. (A) Dual-color SLN experiment in which L-selectin (L-sel) and αβTCR molecules were labeled with antibodies conjugated with Alexa 568 (green) and Alexa 647 (red), respectively. Sample results from a single cell are shown. Left image, L-selectin; middle image, αβTCR (red); right image, merge of two channels. Graph on the Right, density of “red” molecules as a function of distance from the center of mass of each cluster of “green” molecules. (B) Same as top row, but in this case L-selectin molecules were labeled with Alexa 568, whereas Alexa 647 labeled CD3ε molecules. (C) Same as top row, but in this case a control experiment was conducted, in which L-selectin molecules were labeled with antibodies conjugated with the two different colors. (Scale bars: 1 μm.)
Perturbation of Microvilli Structure Disrupts TCR Clustering.
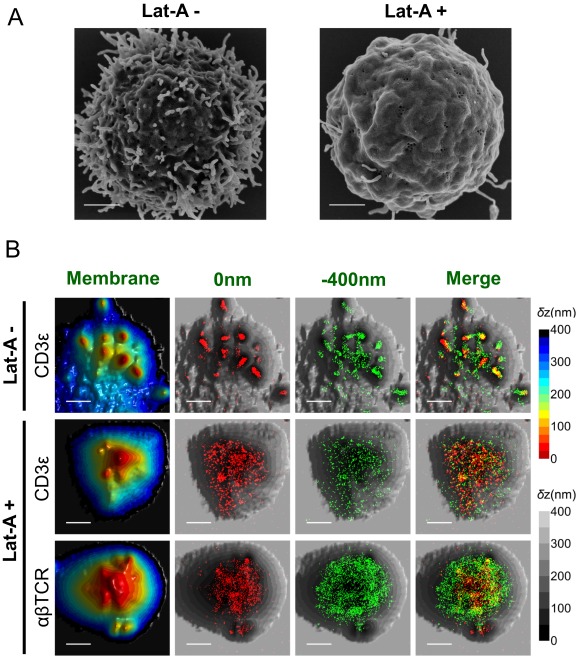
To critically examine the relation of TCR molecules and microvilli, we looked for a method to perturb the structure of the latter. Microvilli are enriched with bundled actin and their stability depends on actin polymerization (1). We therefore treated T cells with the actin-disrupting toxin latrunculin-A (Lat-A), which stabilizes G-actin monomers and prevents actin polymerization (44). SEM images confirmed that most of the microvilli of these lymphocytes disappeared within a 30-min exposure to the Lat-A toxin, both in the case of resting T cells (Fig. 6A) and of effector T cells (Fig. S12A). SLN experiments on Lat-A–treated cells revealed that both the αβTCR and the CD3ε subunits were dispersed over the entire T-cell area, in stark contrast to the picture observed on untreated cells (Fig. 6B and Fig. S12B). These results provide compelling evidence for the selective localization of TCRs on microvilli in intact cells and suggest that intact actin polymerization machineries are required for the clustering of TCR–CD3 complexes on microvilli.
Fig. 6.
Effect of Lat-A on the distribution of TCRs on the surface of T cells. (A) SEM images of Lat-A untreated (Left) and treated (Right) human resting T cells obtained with a magnification of 25,000×. (Scale bars: 1 μm.) (B) Representative 3D topography maps of Lat-A–untreated (LatA −) and –treated (LatA +) resting T cells (gray scale) and overlaid SLN images of CD3ε or αβTCRs (0 nm, red; −400 nm, green). (Scale bars: 1 μm.)
Fig. S12.
Effect of Lat-A on the distribution of TCRs on the surface of effector T cells. (A) Representative SEM images of Lat-A–untreated (Left) and –treated (Right) human effector T cells obtained with a magnification of 25,000×. (Scale bars: 1 μm.) (B) Representative 3D topography maps of Lat-A–untreated (LatA −) and –treated (LatA +) effector T cells and overlaid SLN images of CD3ε or αβTCR molecules (red dots, 0 nm; green dots, −400 nm). (Scale bars: 1 μm.)
Discussion
The surfaces of T cells are not flat; rather, they contain finger-like protruding structures, microvilli, whose potential role in the immune response remains unknown. In this study, we mapped the location of the major T-cell immune response signaling molecule, the TCR, as well as two prototypical adhesion receptors, L-selectin and CD44, and a protein tyrosine phosphatase, CD45, in relation to the 3D surface architecture of T cells. The key finding of this work is that TCR assemblies are highly clustered on microvilli, both in resting lymphocytes and in recently activated effector T cells; disruption of microvilli structures results in disruption of TCR microclusters on the cell surface. This discovery immediately points to a potential role for microvilli in the recognition process inherent in the immune response, a role that has not been suggested before in the literature.
A synergistic combination of two high-resolution optical microscopy methods facilitated this finding. First, VA-TIRFM allowed us to map the 3D architecture of the T-cell surface and identify the positions of microvilli. Second, SLN enabled the localization of TCRs and other molecules with an accuracy of ∼10 nm. Comparison of images obtained by the two methods permitted us to determine the distribution of these molecules on T-cell microvilli and on the cell body. Our methodology carries a significant advantage over immunogold EM. First, it is performed under wet conditions so that the artifacts introduced by dehydration, such as shrinkage or distortion of specimens, can be avoided. Second, the fluorescent dyes used here are much less bulky than gold particles, reducing aggregation and nonspecific binding that are common to the latter.
Several studies reported the existence of preclustered TCRs on either resting or effector T cells before antigenic stimulation (18, 19, 45, 46). However, no information on the 3D distribution of these key signaling molecules on the surface of T cells was provided by these works. Furthermore, in several of these studies, T cells were allowed to spread on the surface before imaging, which likely changed the TCR distribution on their surface. Interestingly, a study conducted using interference reflection microscopy showed that, on cells of the T lymphoblastic line Jurkat, fixed 1 min after being plated on coverslips, TCRs were enriched within regions of tight contacts with the glass surface (47). Here, we resolved the distribution of TCRs on T cells before their activation and spreading. Our observation of preferential localization of TCRs to microvilli not only provides a plausible explanation for early observations of preexisting TCR clusters on various T cells, but links these preformed TCR assemblies to lymphocyte microvilli. Furthermore, our findings raise the intriguing possibility that, similar to L-selectin, whose localization on microvilli is critical for leukocyte capture by L-selectin ligands (6), enrichment of TCRs on these cellular projections may increase the probability of their encounter of antigens presented on counterprojections on APCs, primarily dendritic cells. Indeed, most APCs contain microvilli (26, 48, 49), and experiments suggested that MHC molecules, on which TCR antigenic ligands are presented, are enriched on these projections (49). Thus, molecules enriched on T-cell and APC microvilli may serve as firsthand participants in the T-cell activation process.
We suggest several major physiological roles for TCR enrichment on T-cell microvilli. Microvilli can facilitate interaction of TCRs with antigen molecules by their dynamic motions. Indeed, there is evidence for fast motion of microvilli following interaction with model surfaces (50). Furthermore, the concentration of TCRs on a relatively small area of highly exposed cell projections might significantly increase the avidity of these receptors to peptide–MHC complexes on APC surfaces (45, 51). Finally, these actin-enriched projections may also serve as physical barriers for the diffusion and random mixing of nonmicrovillar surface proteins with microvillar proteins. Indeed, the observation that TCR clusters maintain their boundaries while moving toward the central region of the IS (18) and do not readily mix with other microclusters such as Lat or LFA-1 assemblies (52), might potentially be explained by the segregation of TCR and other molecules to distinct compartments on the T-cell surface. The lateral mobility of TCRs has been shown to be high (53), yet the measured diffusion coefficients were found to be low compared with freely diffusing membrane proteins, commensurate with a model in which each TCR is confined to a microvillus for a significant fraction of the time. The redistribution of TCRs during different stages of T-cell activation and formation of the IS remains to be determined, as it is likely to be associated with microvilli collapse and mixing of TCR and Lat microclusters (18).
In summary, we report here a definitive demonstration of a spatial relation between TCRs and microvilli. This observation, made by the combination of two state-of-the-art optical microscopy techniques and extended also to three additional surface molecules, L-selectin, CD44, and CD45, highlights the importance of microvilli in the compartmentalization of distinct adhesive and signaling molecules on the cell membrane. The microscopic methodology presented here is likely to be of much use for localizing other proteins in relation to membrane structures on T cells as well as other cells (54).
Materials and Methods
Cells.
Human peripheral T lymphocytes were isolated from citrate-anticoagulated whole blood of healthy donors by dextran sedimentation and Ficoll (Sigma) gradient separation followed by depletion of B cells by using a nylon wool column (Unisorb), on which most of the B cells were adsorbed. Cells were incubated in a complete RPMI growth medium for more than 2 h, and then nonadherent cells were harvested and transferred to a new plate (resulting in ∼90% CD3+ T lymphocytes) and used within 1–2 d as “resting T cells.” Effector T cells were generated by stimulating freshly isolated resting T cells on an anti-CD3/anti-CD28 antibodies coated plate for 2 d. Cells were then transferred to a new plate and grown in a complete RPMI growth medium that contained IL-2 (350 U/mL) and 2-mercaptoethanol (50 μM) for 7–14 d. CD4+ T cells were purified from a buffy coat suspension prepared from whole blood using the RosetteSep kit (StemCell Technologies).
Sample Preparation for Microscopy.
Cells in suspension were washed with 5 mM EDTA/PBS for 5 min by centrifugation at 4 °C. After a 10-min incubation in a blocking solution (1% BSA, 5 mM EDTA, 0.05% N3Na, PBS) on ice, cells were labeled with antibodies (10 μg/mL) for 20 min on ice. Cells were washed twice with 5 mM EDTA/PBS by centrifugation at 4 °C, and were then fixed with a fixation buffer [4% (wt/vol) paraformaldehyde, 0.2–0.5% glutaraldehyde, 2% (wt/vol) sucrose, 10 mM EGTA, and 1 mM EDTA, PBS] in suspension for 1 h on ice. After washing out the fixative twice with PBS by centrifugation, the cell membrane was stained with FM1-43 or FM1-43FX (Invitrogen; 5 μg/mL) for 30 min on ice. In the case of the fixable dye, cells were fixed again on ice for 30 min, and fixatives were washed twice at 4 °C, and then washed twice with PBS by centrifugation at 4 °C. Cells were suspended in PBS and were kept on ice. To verify that the morphology of our T cells was retained by this procedure, we imaged fixed cells with SEM (Fig. S1 A and B) and compared with cells that were frozen and observed by cryo-SEM (Fig. S1 C and D). We then verified that our antibody-labeling procedure also did not alter the morphology of the T cells (data not shown). For details on SEM and cryo-SEM procedures, see separate sections below (SEM Imaging and Cryo-SEM Imaging).
One hundred microliters of cells in PBS were placed in a freshly prepared poly-l-lysine (PLL) (0.01%; Sigma)-coated glass-bottom chamber (MatTek). The chamber was previously cleaned with 1 M NaOH (Fluka) for 40 min, coated with PLL for 40 min, and washed with distilled water. Thirty minutes before the SLN measurement, the buffer was exchanged to the freshly prepared “blinking buffer” [50 mM cysteamine (Sigma), 0.5 mg/mL glucose oxidase (Sigma), 40 μg/mL catalase (Sigma), 10% (wt/vol) glucose (Sigma), 93 mM Tris⋅HCl, PBS buffer (pH 7.5–8.5)]. All buffers were filtered with 0.2-μm pore-sized filters (Millipore or Thermo Scientific). The following labeled primary antibodies were used: Alexa 647-conjugated mouse anti-human αβTCR (clone IP26; BioLegend), Alexa 647-conjugated mouse anti-human CD3ε (clone HIT3a; BioLegend), Alexa 647-conjugated mouse anti-human CD62L (L-selectin) (clone DREG-56; BioLegend), Alexa 647-conjugated rat anti-human CD44 (clone IM7; BioLegend), Alexa 647-conjugated mouse anti-human CD45 (clone HI30; BioLegend), and Alexa 647-conjugated mouse IgG1 κ isotype control antibodies (clone MOPC-21; BioLegend). In addition, purified mouse anti-human CD62L (clone DREG-56; BioLegend) IgG antibodies were labeled with Alexa 568 NHS ester at a 1:5 ratio in 0.1 M sodium bicarbonate buffer for 1 h at room temperature in the dark. The unlabeled dye molecules were removed using a Micro Bio-Spin column with Bio-Gel P-30 (Bio-Rad). For stimulating effector T cells, we used mouse anti-human CD3 (clone OKT3; BioLegend) and mouse anti-human CD28 (clone CD28.2; BioLegend).
In some experiments, cells were treated with Lat-A (1 μM) (FluoProbes) for 30 min in a 37 °C culture chamber before the preparation described above. During this preparative process, all buffers contained the same concentration of Lat-A.
TIRF Setup.
Microscopy was performed using a custom-built TIRF-based setup. Two different laser lines, at 532 nm (50 mW; Cobolt) and 642 nm (150 mW; Toptica), were coupled into a polarization-maintaining single-mode fiber by using a series of dichroic beam splitters (z408bcm, z532bcm; Chroma) and an objective lens (M-20×; N.A., 0.4; Newport). This fiber was pigtailed into an acousto-optic tunable filter (AOTFFnc-VIS-TN-FI; AA Opto-Electronic), which enabled separately modulating each excitation beam. To maximize coupling efficiency, the polarization of each laser was tuned by using a polarizer (GT10-A; Thorlabs) and the power of each laser was controlled by the computer or by manual adjustment of a half-wave plate (WPH05M; Thorlabs) positioned after a polarizer. The first-order output beam from the AOTF was expanded and collimated to a diameter of 6 mm by achromatic lenses (01LAO773, 01LAO779; CVI Melles Griot). The expanded laser beams were focused at the back focal plane of the microscope objective lens (UAPON 100×OTIRF; N.A., 1.49; Olympus) by an achromatic focusing lens (f = 500 mm; LAO801; CVI Melles Griot), and total internal reflection was achieved at the sample by shifting the position of the focused beam from the center of the objective to its edge. Fluorescence emitted by the sample passed through a multiple-edge dichroic beam splitter (FF494/540/650-Di01; Semrock), which separated excitation beams from the fluorescence light, and was then coupled out from the side port of the microscope (Olympus IX71). The residual scattered laser light that passed through the dichroic beam splitter was blocked by notch filters (NF01-405/488/532/635 StopLine Quad-notch filter and ZET635NF; Semrock). The fluorescent image was split into two areas of a single EMCCD chip (iXonEM +897 back-illuminated; Andor). The light was focused by a tube lens (f = 180 mm; Olympus), and then relayed with another achromatic lens (f = 100 mm; ACL0304; CASIX), and this collimated beam was split at the edge of 640-nm wavelength by a dichroic beam splitter (640dcrx 228869; Chroma). A selective emission filter (z488-532-647m; Chroma) mounted on a filter wheel was also introduced within the light path. Each spectrally separated image was collected with a single lens (f = 150 mm; 01LAO551; CVI Melles Griot) to refocus, and the two images were projected onto the two halves of the CCD chip. The final magnification on the EMCCD camera was 240×, resulting in a pixel size of 66.67 nm.
Reconstruction of 3D Cell Surfaces.
Using weak illumination of a 532-nm laser, 50 frames of TIRF images of T cells were taken at a series of angles of incidence (see Table S1 for a list of the angles of incidence used and details on how they were varied). To obtain the 3D topography of the membrane, we used the procedure described by Sundd et al. (36). Thus, assuming that at a particular angle of incidence θ the pixel of maximal intensity [] is the one closest to the glass surface, the relative axial distance of each point on the cell surface [with intensity ] from the glass (δz) can be calculated as follows: Here, d(θ) is the penetration depth of the TIRF evanescent field with an angle of incidence θ, given by , where λ is wavelength (532 nm), n1 is the refractive index of the glass coverslip and immersion oil (1.52), and n2 is the refractive index of the blinking buffer (1.35), as measured by a refractometer at 23 °C.
Constructing LocTips Maps.
An algorithm was developed to define the regions of individual microvilli and their tip positions using Matlab. TIRFM images were processed with a “Laplacian of a Gaussian” (LoG) filter (Matlab; image-processing tool kit), and the parameters of the filter (Gaussian σ= 0.5; kernel size = 10 × 10) were optimized to flatten cell body regions while keeping the tip positions of microvilli appearing as peaks (Fig. S2F). The LoG filter-processed images were converted to binary images by setting a threshold intensity level of 5, which captured most distinguishable microvilli regions. For defining individual microvilli areas, segmentation was performed with the function “bwlabel” in Matlab, which computes connected components for 2D binary images. To include a maximum number of microvilli, the binary image obtained from the data taken at the smallest angle of incidence was analyzed for segmentation first, and then information from the image taken at the largest angle of incidence was combined to separate individual microvilli. In particular, the binary image of the smallest angle was treated with the function “imerode” in Matlab, and image segmentation was then performed by applying the function bwlabel (with the parameter for “connected object size” set to 4). If the total size of an individual object was larger than 10 pixels (this mostly happened when two individual microvilli areas merged), the binary values of this structure were multiplied with the corresponding binary image obtained from maximum angle, resulting in a new binary map to which bwlabel was applied for segmentation. If this binary image of the object was not segmented by bwlabel, imerode was applied to the binary image from the maximum angle, and then this step was repeated up to four times. The eroded binary map was recovered by the “imdilate” function at the end. Last, segmented areas obtained from images taken at angles 65.5°, 66.8°, and 68.6° were combined and the mean of the δz of each pixel was calculated and used to generate the LocTips map. The coordinates of the minimum δz pixel of an individual microvillus region are referred to as its tip position. The above three angles of incidence are optimal in terms of the position of the focused beam at the middle of the TIRF zone of the backfocal plane of the objective lens, and the calculated δz values at these three angles nicely agreed with each other (Fig. S2 A–C), justifying the above process.
SLN.
SLN measurements were performed on membrane molecules labeled with Alexa 647-conjugated monoclonal antibodies. Alexa 647 is a cyanine dye that can be converted into a dark state upon red laser illumination. Only a small fraction of the dye molecules in the dark state were switched back on at any moment of time in a buffer containing β-mercaptoethylamine together with glucose oxidase/catalase as an oxygen-scavenging system (38, 55), so that each individual molecule appeared separated from the others in the recorded fluorescent images. This facilitated determination of the positions of these molecules with a precision that is not limited by optical diffraction but rather depends on the number of photons emitted from each molecule and the signal-to-background ratio (see below).
All SLN measurements were performed at an incident angle of 66.8° using a 642-nm laser (Toptica) operating at a power of ∼30–35 mW (corresponding to ∼18–22 kW/cm2). For each focal plane, 30,000 frames were recorded, divided into 10 series of movies (3,000 frames in each; acquisition time, 15 ms per frame). To facilitate sample drift correction (see below), membrane TIRFM reference images (50 frames, 15 ms per frame) were obtained between the movies under weak illumination of a 532-nm laser (10–20 μW).
Dual-Plane SLN.
We implemented a simple technique that enabled measuring molecules located on two planes in the z direction, which we termed dual-plane SLN. A full description of this method is given in Fig. S3. A piezo stage (PI nano Z-Piezo slide scanner; PI) was used to move the sample up or down (Fig. S3A), and data were recorded at the 0- and −400-nm focal planes, leading effectively to the collection of signals from molecules at different planes in the sample. This method does not permit 3D image reconstruction in its current implementation, as in the biplane method of Bewersdorf and coworkers (56). However, it is readily combined with the VA-TIRFM experiment.
In analogy to the rejection of out-of-focus signals in confocal microscopy, the sectioning effect of dual-plane SLN was achieved by rejecting the out-of-focus images of single molecules during the localization procedure. Thus, when the image of a single molecule was out of focus, the intensity of the signal reduced and its spatial width became larger, allowing us to filter it out. For quantifying the defocusing of single-molecule images, we measured changes in the widths obtained from the 2D Gaussian fits of images of individual fluorescent beads of ∼110 nm adsorbed on a glass surface while moving the z position of the sample stage with a step size of 100 nm. The values of the SD of the Gaussian fits to bead images in the x and y directions at a stage position of −400 nm (that is, the glass plane is −400 nm away from the focal plane) are significantly larger than those obtained at a stage position of 0 nm (Fig. S3B). This means that it is possible to collect “in-focus” molecules at 0 and −400 nm selectively by setting an appropriate threshold on the width.
We tested the z sectioning of SLN measurements at 0- and −400-nm focal planes with two different samples: (i) Alexa 647 molecules bound on the glass surface as an example of a 2D configuration (Fig. S3C); (ii) a human resting T cells labeled with Alexa 647-conjugated anti–L-selectin antibodies (Fig. S3D). Following localization analysis (see below), only molecules whose fitted SD did not vary by more than 0.3 pixels from the average were retained. Based on this analysis, it was found that molecules bound on the glass surface were detected almost exclusively at the 0-nm focal plane (Fig. S3C). On the other hand, distinctive signals of L-selectin molecules labeled on a resting T cell were obtained from both the 0- and −400-nm focal planes (Fig. S3D). The histograms of x and y SDs of molecular images found both at the 0- and −400-nm focal planes were comparable to each other (Fig. S3 E and F), indicating that these molecules were in focus at the corresponding positions of the piezo stage. These results show that our method enables us to get the two separate z-sectioned SLN images in the TIRFM configuration.
Drift Correction.
Sample drift during the measurement was corrected movie-by-movie based on the reference TIRFM images of cell membrane that were acquired between SLN movies. The level of drift was determined by a 2D cross-correlation of each reference TIRFM image with a template image (which was selected to be the reference image last obtained in the series). A peak appeared in the 2D cross-correlation image and was typically found to be shifted from position (0, 0) in the x and y directions due to the lateral drift of sample. The deviation of the cross-correlation peak, which was obtained using a 2D Gaussian fit, was used for correction of SLN movies.
Localization Analysis.
SLN movies were analyzed using custom-written Matlab (MathWorks) routines. Individual emitters were identified in each frame by steps of thresholding and fit to a 2D Gaussian function to obtain the x and y coordinates and the widths in the x and y directions. A narrow distribution of widths was obtained in these measurements. The SD of this distribution was used as a criterion to accept molecules for the SLN images. Thus, only molecules whose widths were within ±3 SD of the mean width were used. In membrane-stained samples, a higher background signal was observed. Therefore, an averaging filter was applied to each frame (kernel size, 60 × 60 pixels; Matlab image-processing tool kit), and the averaged frame was subtracted from the original frame to reduce the background while keeping single-molecule blinking features. To determine the precision of the localization of a single molecule, highly diluted fluorescent beads (∼110 nm; Tetraspec; Invitrogen) were adsorbed on a clean glass slide and 1,000 frames were recorded at a rate of 15 ms per frame. The illumination power was adjusted so that the emission intensity of the beads matched the range of photon numbers emitted from a single blinking Alexa 647 molecule. The x and y coordinates and the numbers of photons were analyzed in multiple frames measured for each bead. The average localization precision in x–y was found to be ∼11 nm (FWHM).
Dual-Color SLN.
In this experiment, we simultaneously labeled T-cell surface molecules with two types of antibodies, conjugated either with Alexa 568 or Alexa 647 at a 1:1 ratio (10 μg/mL each). Cells were plated on a PLL-coated glass surface together with fluorescent nanodiamonds (FNDs) (a kind gift of Dr. Keir Neumann, NIH, Bethesda, MD) that were used as fiducial points for drift correction. To adsorb FNDs on the glass surface, a FND suspension was sonicated and centrifuged to break and remove large clusters, and then diluted and applied to the glass chamber for 10 min. Unbound FNDs were rinsed away thoroughly with PBS. The two colors were imaged sequentially using SLN, as described above. Drift correction was performed based on the positions of the FNDs in the mean image of each SLN movie. Localization analysis was performed as above. The positions of clusters of “green” molecules were initially identified from TIRF images that were measured before SLN data collection. The center of mass for each cluster was then calculated, and the distances of “red” molecules belonging to the same region from this point were measured and histogrammed.
SEM Imaging.
For SEM imaging, cells were fixed in a fixation buffer [4% (wt/vol) paraformaldehyde, 0.5% glutaraldehyde, 2% (wt/vol) sucrose, 10 mM EGTA, and 1 mM EDTA in PBS] for 1 h on ice and were then placed on a PLL-coated coverslip. The samples were dehydrated in different concentration of ethanol and dried in a BAL-TEC CPD 030 critical point drier. Samples were placed on a carbon tape and coated with carbon (Edwards; Auto306) or sputter-coated with gold–palladium (Edwards; S150). They were then observed using an Ultra 55 SEM (Zeiss).
Cryo-SEM Imaging.
T cells were high-pressure frozen as follows. Ten microliters of the cell suspension were sandwiched between two metal discs (3-mm diameter, 0.1-mm cavities) and cryofixed in a high-pressure freezing device (HPM10; Bal-Tec). The frozen samples were kept in liquid nitrogen and transferred by using a vacuum cryotransfer device (VCT 100; Leica Microsystems) to a freeze-fracture device (BAF 60; Leica Microsystems). Cells were freeze-fractured at −120 °C, etched for 10 or 40 min at −105 °C, and coated with 4-nm platinum/carbon by double-axis rotary shadowing. Samples were observed at −120 °C in an Ultra 55 SEM (Zeiss) by using a secondary electron in-lens detector and a backscattered electron in-lens detector.
TEM Imaging.
Mice were perfused with 2% (wt/vol) glutaraldehyde–4% (wt/vol) paraformaldehyde solution in 0.1 M phosphate buffer (pH 7.4) through the left ventricle. Lymph nodes were removed and postfixed by 2% (wt/vol) osmium tetroxide and dehydrated in a graded ethanol series, and then embedded in Quetol 812 epoxy resin. Ultrathin sections were stained with 2% (wt/vol) uranyl acetate and Reynold’s lead citrate, and examined using a JEM-1230 transmission electron microscope (JEOL).
Acknowledgments
We thank Drs. Shirsendu Ghosh, Sagi Barzilai, Sandeep Yadav, Tal Ilani, Tali Dadosh, and Eyal Shimoni for their kind advice and experimental help during the project, and Dr. Keir Neuman (NIH) for kindly sharing with us fluorescent nanodiamond samples. The SEM studies were conducted at the Electron Microscopy Unit at the Weizmann Institute of Science. G.H. is the incumbent of the Hilda Pomeraniec Memorial Professorial Chair. R.A.’s research was supported by the US–Israel Binational Science Foundation.
Footnotes
The authors declare no conflict of interest.
This article is a PNAS Direct Submission.
See Commentary on page 11061.
This article contains supporting information online at www.pnas.org/lookup/suppl/doi:10.1073/pnas.1605399113/-/DCSupplemental.
References
- 1.Majstoravich S, et al. Lymphocyte microvilli are dynamic, actin-dependent structures that do not require Wiskott–Aldrich syndrome protein (WASp) for their morphology. Blood. 2004;104(5):1396–1403. doi: 10.1182/blood-2004-02-0437. [DOI] [PubMed] [Google Scholar]
- 2.Nijhara R, et al. Rac1 mediates collapse of microvilli on chemokine-activated T lymphocytes. J Immunol. 2004;173(8):4985–4993. doi: 10.4049/jimmunol.173.8.4985. [DOI] [PubMed] [Google Scholar]
- 3.Müller N, et al. Measles virus contact with T cells impedes cytoskeletal remodeling associated with spreading, polarization, and CD3 clustering. Traffic. 2006;7(7):849–858. doi: 10.1111/j.1600-0854.2006.00426.x. [DOI] [PubMed] [Google Scholar]
- 4.Schwarz US, Alon R. L-selectin-mediated leukocyte tethering in shear flow is controlled by multiple contacts and cytoskeletal anchorage facilitating fast rebinding events. Proc Natl Acad Sci USA. 2004;101(18):6940–6945. doi: 10.1073/pnas.0305822101. [DOI] [PMC free article] [PubMed] [Google Scholar]
- 5.Sundd P, Pospieszalska MK, Cheung LSL, Konstantopoulos K, Ley K. Biomechanics of leukocyte rolling. Biorheology. 2011;48(1):1–35. doi: 10.3233/BIR-2011-0579. [DOI] [PMC free article] [PubMed] [Google Scholar]
- 6.von Andrian UH, Hasslen SR, Nelson RD, Erlandsen SL, Butcher EC. A central role for microvillous receptor presentation in leukocyte adhesion under flow. Cell. 1995;82(6):989–999. doi: 10.1016/0092-8674(95)90278-3. [DOI] [PubMed] [Google Scholar]
- 7.Berlin C, et al. α4 integrins mediate lymphocyte attachment and rolling under physiologic flow. Cell. 1995;80(3):413–422. doi: 10.1016/0092-8674(95)90491-3. [DOI] [PubMed] [Google Scholar]
- 8.Singer II, et al. CCR5, CXCR4, and CD4 are clustered and closely apposed on microvilli of human macrophages and T cells. J Virol. 2001;75(8):3779–3790. doi: 10.1128/JVI.75.8.3779-3790.2001. [DOI] [PMC free article] [PubMed] [Google Scholar]
- 9.Abitorabi MA, Pachynski RK, Ferrando RE, Tidswell M, Erle DJ. Presentation of integrins on leukocyte microvilli: A role for the extracellular domain in determining membrane localization. J Cell Biol. 1997;139(2):563–571. doi: 10.1083/jcb.139.2.563. [DOI] [PMC free article] [PubMed] [Google Scholar]
- 10.Buscher K, et al. The transmembrane domains of L-selectin and CD44 regulate receptor cell surface positioning and leukocyte adhesion under flow. J Biol Chem. 2010;285(18):13490–13497. doi: 10.1074/jbc.M110.102640. [DOI] [PMC free article] [PubMed] [Google Scholar]
- 11.Goldberg MW. Immunolabeling for scanning electron microscopy (SEM) and field emission SEM. Methods Cell Biol. 2008;88:109–130. doi: 10.1016/S0091-679X(08)00407-X. [DOI] [PubMed] [Google Scholar]
- 12.Wilson SM, Bacic A. Preparation of plant cells for transmission electron microscopy to optimize immunogold labeling of carbohydrate and protein epitopes. Nat Protoc. 2012;7(9):1716–1727. doi: 10.1038/nprot.2012.096. [DOI] [PubMed] [Google Scholar]
- 13.Fischer ER, Hansen BT, Nair V, Hoyt FH, Dorward DW. 2012. Scanning electron microscopy. Current Protoc Microbiol Chapter 2:Unit 2B.2.
- 14.Arechaga I, et al. Structural characterization of the TCR complex by electron microscopy. Int Immunol. 2010;22(11):897–903. doi: 10.1093/intimm/dxq443. [DOI] [PubMed] [Google Scholar]
- 15.Monks CR, Freiberg BA, Kupfer H, Sciaky N, Kupfer A. Three-dimensional segregation of supramolecular activation clusters in T cells. Nature. 1998;395(6697):82–86. doi: 10.1038/25764. [DOI] [PubMed] [Google Scholar]
- 16.Bunnell SC. Multiple microclusters: Diverse compartments within the immune synapse. Curr Top Microbiol Immunol. 2010;340:123–154. doi: 10.1007/978-3-642-03858-7_7. [DOI] [PubMed] [Google Scholar]
- 17.Yokosuka T, Saito T. The immunological synapse, TCR microclusters, and T cell activation. Curr Top Microbiol Immunol. 2010;340:81–107. doi: 10.1007/978-3-642-03858-7_5. [DOI] [PubMed] [Google Scholar]
- 18.Lillemeier BF, et al. TCR and Lat are expressed on separate protein islands on T cell membranes and concatenate during activation. Nat Immunol. 2010;11(1):90–96. doi: 10.1038/ni.1832. [DOI] [PMC free article] [PubMed] [Google Scholar]
- 19.Sherman E, et al. Functional nanoscale organization of signaling molecules downstream of the T cell antigen receptor. Immunity. 2011;35(5):705–720. doi: 10.1016/j.immuni.2011.10.004. [DOI] [PMC free article] [PubMed] [Google Scholar]
- 20.Guy CS, et al. Distinct TCR signaling pathways drive proliferation and cytokine production in T cells. Nat Immunol. 2013;14(3):262–270. doi: 10.1038/ni.2538. [DOI] [PMC free article] [PubMed] [Google Scholar]
- 21.Varma R, Campi G, Yokosuka T, Saito T, Dustin ML. T cell receptor-proximal signals are sustained in peripheral microclusters and terminated in the central supramolecular activation cluster. Immunity. 2006;25(1):117–127. doi: 10.1016/j.immuni.2006.04.010. [DOI] [PMC free article] [PubMed] [Google Scholar]
- 22.Friedman RS, Beemiller P, Sorensen CM, Jacobelli J, Krummel MF. Real-time analysis of T cell receptors in naive cells in vitro and in vivo reveals flexibility in synapse and signaling dynamics. J Exp Med. 2010;207(12):2733–2749. doi: 10.1084/jem.20091201. [DOI] [PMC free article] [PubMed] [Google Scholar]
- 23.Stemberger C, et al. A single naive CD8+ T cell precursor can develop into diverse effector and memory subsets. Immunity. 2007;27(6):985–997. doi: 10.1016/j.immuni.2007.10.012. [DOI] [PubMed] [Google Scholar]
- 24.Shulman Z, et al. Transendothelial migration of lymphocytes mediated by intraendothelial vesicle stores rather than by extracellular chemokine depots. Nat Immunol. 2011;13(1):67–76. doi: 10.1038/ni.2173. [DOI] [PubMed] [Google Scholar]
- 25.Tumeh PC, et al. The impact of ex vivo clinical grade activation protocols on human T-cell phenotype and function for the generation of genetically modified cells for adoptive cell transfer therapy. J Immunother. 2010;33(8):759–768. doi: 10.1097/CJI.0b013e3181f1d644. [DOI] [PMC free article] [PubMed] [Google Scholar]
- 26.Fisher PJ, Bulur PA, Vuk-Pavlovic S, Prendergast FG, Dietz AB. Dendritic cell microvilli: A novel membrane structure associated with the multifocal synapse and T-cell clustering. Blood. 2008;112(13):5037–5045. doi: 10.1182/blood-2008-04-149526. [DOI] [PubMed] [Google Scholar]
- 27.Ueda H, Morphew MK, McIntosh JR, Davis MM. CD4+ T-cell synapses involve multiple distinct stages. Proc Natl Acad Sci USA. 2011;108(41):17099–17104. doi: 10.1073/pnas.1113703108. [DOI] [PMC free article] [PubMed] [Google Scholar]
- 28.Sabatos CA, et al. A synaptic basis for paracrine interleukin-2 signaling during homotypic T cell interaction. Immunity. 2008;29(2):238–248. doi: 10.1016/j.immuni.2008.05.017. [DOI] [PMC free article] [PubMed] [Google Scholar]
- 29.Linthicum DS, Sell S, Wagner RM, Trefts P. Scanning immunoelectron microscopy of mouse B and T lymphocytes. Nature. 1974;252(5479):173–175. doi: 10.1038/252173a0. [DOI] [PubMed] [Google Scholar]
- 30.Polliack A, Hämmerling U, Lampen N, de Harven E. Surface morphology of murine B and T lymphocytes: A comparative study by scanning electron microscopy. Eur J Immunol. 1975;5(1):32–39. doi: 10.1002/eji.1830050108. [DOI] [PubMed] [Google Scholar]
- 31.van Ewijk W, Brons NH. Scanning electron microscopy of B- and T-cells in peripheral lymphoid organs of the mouse. Adv Exp Med Biol. 1976;66:171–175. doi: 10.1007/978-1-4613-4355-4_26. [DOI] [PubMed] [Google Scholar]
- 32.Singer II, et al. Sphingosine-1-phosphate agonists increase macrophage homing, lymphocyte contacts, and endothelial junctional complex formation in murine lymph nodes. J Immunol. 2005;175(11):7151–7161. doi: 10.4049/jimmunol.175.11.7151. [DOI] [PubMed] [Google Scholar]
- 33.Bajénoff M, et al. Stromal cell networks regulate lymphocyte entry, migration, and territoriality in lymph nodes. Immunity. 2006;25(6):989–1001. doi: 10.1016/j.immuni.2006.10.011. [DOI] [PMC free article] [PubMed] [Google Scholar]
- 34.Truskey GA, Burmeister JS, Grapa E, Reichert WM. Total internal reflection fluorescence microscopy (TIRFM). II. Topographical mapping of relative cell/substratum separation distances. J Cell Sci. 1992;103(Pt 2):491–499. doi: 10.1242/jcs.103.2.491. [DOI] [PubMed] [Google Scholar]
- 35.Stock K, et al. Variable-angle total internal reflection fluorescence microscopy (VA-TIRFM): Realization and application of a compact illumination device. J Microsc. 2003;211(Pt 1):19–29. doi: 10.1046/j.1365-2818.2003.01200.x. [DOI] [PubMed] [Google Scholar]
- 36.Sundd P, et al. Quantitative dynamic footprinting microscopy reveals mechanisms of neutrophil rolling. Nat Methods. 2010;7(10):821–824. doi: 10.1038/nmeth.1508. [DOI] [PMC free article] [PubMed] [Google Scholar]
- 37.Rust MJ, Bates M, Zhuang X. Sub-diffraction-limit imaging by stochastic optical reconstruction microscopy (STORM) Nat Methods. 2006;3(10):793–795. doi: 10.1038/nmeth929. [DOI] [PMC free article] [PubMed] [Google Scholar]
- 38.van de Linde S, et al. Direct stochastic optical reconstruction microscopy with standard fluorescent probes. Nat Protoc. 2011;6(7):991–1009. doi: 10.1038/nprot.2011.336. [DOI] [PubMed] [Google Scholar]
- 39.Bruehl RE, Springer TA, Bainton DF. Quantitation of L-selectin distribution on human leukocyte microvilli by immunogold labeling and electron microscopy. J Histochem Cytochem. 1996;44(8):835–844. doi: 10.1177/44.8.8756756. [DOI] [PubMed] [Google Scholar]
- 40.Tian A, Baumgart T. Sorting of lipids and proteins in membrane curvature gradients. Biophys J. 2009;96(7):2676–2688. doi: 10.1016/j.bpj.2008.11.067. [DOI] [PMC free article] [PubMed] [Google Scholar]
- 41.Callan-Jones A, Bassereau P. Curvature-driven membrane lipid and protein distribution. Curr Opin Solid St M. 2013;17(4):143–150. [Google Scholar]
- 42.Thomas ML. The leukocyte common antigen family. Annu Rev Immunol. 1989;7:339–369. doi: 10.1146/annurev.iy.07.040189.002011. [DOI] [PubMed] [Google Scholar]
- 43.Hermiston ML, Xu Z, Weiss A. CD45: A critical regulator of signaling thresholds in immune cells. Annu Rev Immunol. 2003;21:107–137. doi: 10.1146/annurev.immunol.21.120601.140946. [DOI] [PubMed] [Google Scholar]
- 44.Kumari S, Curado S, Mayya V, Dustin ML. T cell antigen receptor activation and actin cytoskeleton remodeling. Biochim Biophys Acta. 2014;1838(2):546–556. doi: 10.1016/j.bbamem.2013.05.004. [DOI] [PMC free article] [PubMed] [Google Scholar]
- 45.Kumar R, et al. Increased sensitivity of antigen-experienced T cells through the enrichment of oligomeric T cell receptor complexes. Immunity. 2011;35(3):375–387. doi: 10.1016/j.immuni.2011.08.010. [DOI] [PubMed] [Google Scholar]
- 46.Crites TJ, et al. TCR Microclusters pre-exist and contain molecules necessary for TCR signal transduction. J Immunol. 2014;193(1):56–67. doi: 10.4049/jimmunol.1400315. [DOI] [PMC free article] [PubMed] [Google Scholar]
- 47.Bunnell SC, et al. T cell receptor ligation induces the formation of dynamically regulated signaling assemblies. J Cell Biol. 2002;158(7):1263–1275. doi: 10.1083/jcb.200203043. [DOI] [PMC free article] [PubMed] [Google Scholar]
- 48.Shakibaei M, Zimmermann B, Scheller M. Endocytosis of integrin α5β1 (fibronectin receptor) of mouse peritoneal macrophages in vitro: An immunoelectron microscopic study. J Struct Biol. 1993;111(3):180–189. doi: 10.1006/jsbi.1993.1048. [DOI] [PubMed] [Google Scholar]
- 49.Greicius G, et al. Microvilli structures on B lymphocytes: Inducible functional domains? Int Immunol. 2004;16(2):353–364. doi: 10.1093/intimm/dxh031. [DOI] [PubMed] [Google Scholar]
- 50.Brodovitch A, Limozin L, Bongrand P, Pierres A. Use of TIRF to monitor T-lymphocyte membrane dynamics with submicrometer and subsecond resolution. Cell Mol Bioeng. 2015;8(1):178–186. doi: 10.1007/s12195-014-0361-8. [DOI] [PMC free article] [PubMed] [Google Scholar]
- 51.Castro M, et al. Receptor pre-clustering and T cell responses: Insights into molecular mechanisms. Front Immunol. 2014;5:132. doi: 10.3389/fimmu.2014.00132. [DOI] [PMC free article] [PubMed] [Google Scholar]
- 52.Feigelson SW, et al. Occupancy of lymphocyte LFA-1 by surface-immobilized ICAM-1 is critical for TCR- but not for chemokine-triggered LFA-1 conversion to an open headpiece high-affinity state. J Immunol. 2010;185(12):7394–7404. doi: 10.4049/jimmunol.1002246. [DOI] [PubMed] [Google Scholar]
- 53.Dushek O, et al. Effects of intracellular calcium and actin cytoskeleton on TCR mobility measured by fluorescence recovery. PLoS One. 2008;3(12):e3913. doi: 10.1371/journal.pone.0003913. [DOI] [PMC free article] [PubMed] [Google Scholar]
- 54.Mattila PK, et al. The actin and tetraspanin networks organize receptor nanoclusters to regulate B cell receptor-mediated signaling. Immunity. 2013;38(3):461–474. doi: 10.1016/j.immuni.2012.11.019. [DOI] [PubMed] [Google Scholar]
- 55.Dempsey GT, et al. Photoswitching mechanism of cyanine dyes. J Am Chem Soc. 2009;131(51):18192–18193. doi: 10.1021/ja904588g. [DOI] [PMC free article] [PubMed] [Google Scholar]
- 56.Juette MF, et al. Three-dimensional sub-100 nm resolution fluorescence microscopy of thick samples. Nat Methods. 2008;5(6):527–529. doi: 10.1038/nmeth.1211. [DOI] [PubMed] [Google Scholar]


