Significance
Myosin-5a is a molecular motor that functions as a cargo transporter in cells. The motor function of myosin-5a is regulated by calcium via the calmodulin bound to the first isoleucine-glutamine (IQ) motif (IQ1) of myosin-5a. Here, we solve the crystal structure of a truncated myosin-5a containing the motor domain and the IQ1 complexed with calcium-bound calmodulin. Comparison of the structures of the IQ1 complexed with calmodulin with or without bound calcium reveals the calcium-induced conformational changes of calmodulin. We demonstrated that calmodulin continuously associates with the IQ1 during that calcium transition and that the IQ1 binding substantially changes the thermodynamic and kinetics of calcium transition in calmodulin. These findings provide insight into the mechanism by which calcium regulates myosin-5a.
Keywords: calcium, calmodulin, molecular motor, myosin-5a, regulation
Abstract
The motor function of vertebrate myosin-5a is inhibited by its tail in a Ca2+-dependent manner. We previously demonstrated that the calmodulin (CaM) bound to the first isoleucine-glutamine (IQ) motif (IQ1) of myosin-5a is responsible for the Ca2+-dependent regulation of myosin-5a. We have solved the crystal structure of a truncated myosin-5a containing the motor domain and IQ1 (MD-IQ1) complexed with Ca2+-bound CaM (Ca2+-CaM) at 2.5-Å resolution. Compared with the structure of the MD-IQ1 complexed with essential light chain (an equivalent of apo-CaM), MD-IQ1/Ca2+-CaM displays large conformational differences in IQ1/CaM and little difference in the motor domain. In the MD-IQ1/Ca2+-CaM structure, the N-lobe and the C-lobe of Ca2+-CaM adopt an open conformation and grip the C-terminal and the N-terminal portions of the IQ1, respectively. Remarkably, the interlobe linker of CaM in IQ1/Ca2+-CaM is in a position opposite that in IQ1/apo-CaM, suggesting that CaM flip-flops relative to the IQ1 during the Ca2+ transition. We demonstrated that CaM continuously associates with the IQ1 during the Ca2+ transition and that the binding of CaM to IQ1 increases Ca2+ affinity and substantially changes the kinetics of the Ca2+ transition, suggesting that the IQ1/CaM complex functions as an intact Ca2+ sensor responding to distinct calcium signals.
Calcium (Ca2+) is a ubiquitous intracellular signal regulating numerous cellular processes. This versatility is achieved by varying the speed, amplitude, and spatiotemporal aspects of the Ca2+ signal (1). Ca2+ signals are mediated by a number of dedicated Ca2+ sensor proteins, such as troponin C in skeletal muscle, and the generic Ca2+ sensor protein calmodulin (CaM), which regulates an array of cellular processes (1). A prominent question is how CaM decodes different Ca2+ signals to regulate different cellular processes.
CaM contains two approximately symmetrical lobes, the N-lobe and the C-lobe, connected by a flexible linker (2, 3). Each lobe has two EF-hand motifs, each of which is able to bind a Ca2+ ion. Upon the Ca2+ transition, CaM undergoes conformational changes and alters its interaction with target proteins. Although many CaM target proteins, such as myosin light chain kinase (MLCK) and CaM-dependent protein kinases, can bind to only Ca2+-bound CaM (Ca2+-CaM), a number of target proteins can bind to both Ca2+-CaM and Ca2+-free CaM (apo-CaM) (4, 5). The latter group includes unconventional myosins and some ion channels, which bind to CaM via isoleucine-glutamine (IQ) motifs. Although at least 80 unique high-resolution structures of target proteins in complex with CaM have been resolved (5), Ca2+-free and Ca2+-bound structures have not been determined for a single target protein/CaM complex. Thus, it is difficult to envisage the Ca2+-dependent conformational transition of the CaM bound to the target protein.
Vertebrate myosin-5a (Myo5a) is a processive molecular motor responsible for organelle transport along actin filaments (6). The heavy chain of Myo5a contains an N-terminal motor domain that possesses actin binding and ATPase activities, a lever arm containing six tandem IQ motifs, a series of coiled-coil segments, and the C-terminal globular tail domain (GTD). The six IQ motifs of Myo5a serve as the binding sites for CaM or the CaM-like light chain.
The motor function of Myo5a is activated by Ca2+ and cargo binding (7–12). The inhibited Myo5a is in a folded conformation such that the GTD interacts with the motor domain and inhibits its motor activity; high Ca2+ or cargo binding may reduce the head–GTD interactions, thus activating the motor activity. Because the actin-activated ATPase activity of Myo5a is stimulated by micromolar concentrations of Ca2+, and the light chain bound to Myo5a IQ motifs is CaM, it is believed that Ca2+ regulates Myo5a function via the bound CaM. We recently demonstrated that the CaM bound at the first IQ motif (IQ1) is responsible for Ca2+ regulation of Myo5a, because the ATPase of the truncated Myo5a containing the motor domain and the IQ1 in complex with CaM (MD-IQ1/CaM) is inhibited by the GTD in a Ca2+-dependent manner (13). We proposed that CaM in the IQ1 is part of the GTD-binding site and that Ca2+ induces a conformational change of CaM in the IQ1, thus preventing the GTD interaction with the motor domain (13, 14). Therefore, it is important to know the structure of apo-CaM and Ca2+-CaM bound to Myo5a to understand fully Ca2+ regulation of Myo5a.
Both apo-CaM and Ca2+-CaM are able to bind to the IQ1 of Myo5a (15, 16). To date, only the crystal structure of the Myo5a IQ1 and IQ2 motifs in complex with apo-CaM (IQ1-2/apo-CaM) has been solved (17). In IQ1-2/apo-CaM, the C-lobe of apo-CaM adopts a semiopen conformation to contact the N-terminal part of the IQ motif extensively, whereas the closed N-lobe of apo-CaM interacts more weakly with the C-terminal part (17). It was proposed that a large structural rearrangement of apo-CaM in IQ1-2 is needed to accommodate Ca2+ (17). In addition to the crystal structure of Myo5a IQ1-2/apo-CaM, several crystal structures of MD-IQ1/ELC [the chicken Myo5a motor domain with the IQ1 (MD-IQ1) in complex with essential light chain LC1-sa (ELC)] have been solved (18, 19). However, biochemical studies have shown that the light chain bound to the IQ1 of chicken Myo5a is actually CaM, not ELC (20). Nevertheless, MD-IQ1/ELC can be considered the equivalent of MD-IQ1/apo-CaM, because ELC shares a high sequence similarity with CaM and has a structure similar to that of the apo-CaM bound to the IQ1.
Here, we determined at 2.5-Å resolution a structure of mouse Myo5a containing the motor domain and the IQ1 in complex with Ca2+-CaM (MD-IQ1/Ca2+-CaM). Compared with the MD-IQ1/ELC and IQ1-2/apo-CaM structures, MD-IQ1/Ca2+-CaM displays a different conformation in IQ1/CaM with little difference in the motor domain. Ca2+-binding induces the N-lobe and C-lobe of CaM to transform from a closed conformation and a semi-open conformation, respectively, to an open conformation and a flip-flop of CaM relative to the IQ1. Importantly, we demonstrated that CaM continuously associates with the IQ1 during the Ca2+ transition and that the binding of CaM to the IQ1 substantially changes the Ca2+ affinity and the kinetics of the Ca2+ transition, indicating that IQ1/CaM functions as an intact Ca2+ sensor.
Results
Overall Structure of Myo5a MD-IQ1/Ca2+-CaM.
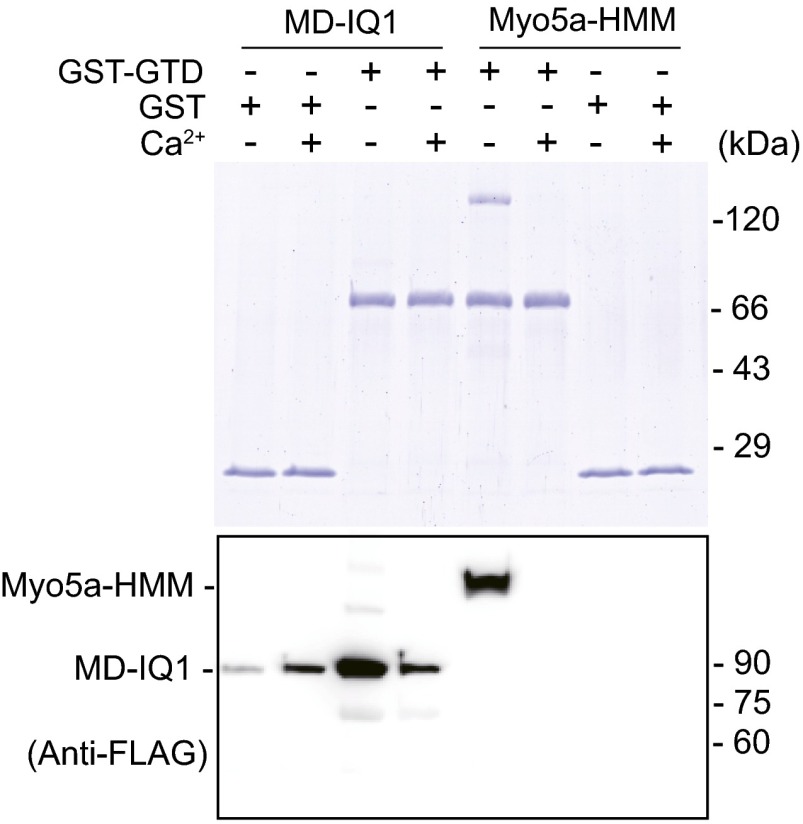
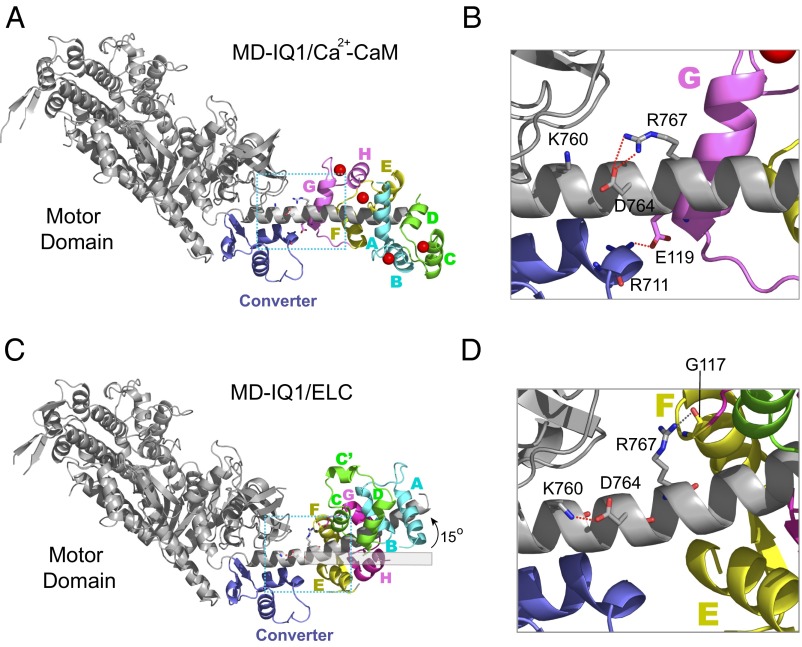
We coexpressed a FLAG-tagged fragment of mouse Myo5a that contains the motor domain and the first IQ motif (residues 1–791, hereafter called the “MD-IQ1”) and CaM in insect cells and copurified the complex using affinity and size-exclusion chromatography. MD-IQ1/CaM contains all essential components for Ca2+ regulation of Myo5a, because the actin-activated ATPase activity of MD-IQ1/CaM is inhibited by the GTD in a Ca2+-dependent manner (13), and the interaction between MD-IQ1/CaM and the GTD is regulated by Ca2+ (Fig. S1). The crystal structure of the nucleotide-free MD-IQ1 in complex with Ca2+-CaM was determined at 2.5-Å resolution and with an Rwork/Rfree ratio of 0.194/0.241 (Fig. 1A and Table S1). A number of loop regions are invisible in the complex structure, likely because of flexibility (see the legend of Fig. 1).
Fig. S1.
Myo5a-HMM and the MD-IQ1 bind to GST-GTD in a Ca2+-dependent manner. FLAG-tagged MD-IQ1 or Myo5a-HMM was incubated with GST-GTD or GST and was pulled down by GSH-Sepharose under EGTA or pCa4 conditions. The pulled-down samples (20 μL each) were separated by SDS/PAGE and detected by Coomassie blue staining (Upper) or Western blot using anti-FLAG antibody (Lower). Note that the pulled-down Myo5a-HMM samples for Western blot were prediluted 10 times before being loaded onto SDS/PAGE.
Fig. 1.
Structural comparison of MD-IQ1/Ca2+-CaM and MD-IQ1/ELC. (A) The overall structure of MD-IQ1/Ca2+-CaM. The helices of CaM, designated A–H, are colored in pairs (A/B in cyan, C/D in green, E/F in yellow, G/H in pink). The electron density map around the terminal residues of the heavy chain (residues 1–3 and 788–791) and CaM (residues 1–6 and 147–148) is poorly defined because of their structural disorder. In addition, there are several breaks in the heavy chain trace (residues 44–45, 53–56, 185–190, 382–383, and 484–486) and in CaM (residues 74–81). (B) An enlarged view of the boxed area in A showing detailed interactions between the heavy chain and Ca2+-CaM. (C) The overall structure of MD-IQ1/ELC (PDB ID code: 1OE9). The structure MD-IQ1/ELC has been superimposed on the motor domain of MD-IQ1/Ca2+-CaM shown in A. The helices of ELC are colored as CaM in A, except the corresponding helix C of Ca2+-CaM is spliced into helices C and C′. (D) An enlarged view of the boxed area in C showing detailed interactions between the heavy chain and the ELC.
Table S1.
Data collection and refinement statistics
| Data collection | |
| Space group | P212121 |
| Cell dimensions | |
| a, b, c (Å) | 56.1, 99.5, 248.2 |
| α, β, γ (°) | 90.0, 90.0, 90.0 |
| Wavelength (Å) | 0.9792 |
| Resolution range (Å) | 50–2.5 (2.54–2.50) |
| Unique reflections | 47,736 (2,225) |
| Redundancy | 9.8 (9.3) |
| <I>/<σ(I)> | 22.9 (3) |
| Completeness (%) | 97.4 (90.6) |
| Rmerge | 0.106 (0.704) |
| Structure refinement | |
| Resolution range (Å) | 48.85–2.50 (2.55–2.50) |
| No. reflections | 47,658 (2,540) |
| No. atoms | 7,444 |
| Protein | 7,086 |
| Water | 358 |
| Rwork | 0.194 (0.246) |
| Rfree | 0.241 (0.338) |
| Mean B factor (Å2) | 46.7 |
| Rmsd bond length (Å) | 0.008 |
| Rmsd bond angles (°) | 1.036 |
Values in parentheses are for the data in the highest resolution shell.
The overall conformation of MD-IQ1/Ca2+-CaM is similar to that of a nucleotide-free chicken MD-IQ1/ELC (PDB ID code: 1OE9) (Fig. 1 A and C). The motor domains of MD-IQ1/Ca2+-CaM and MD-IQ1/ELC superimpose very well with an rmsd of 0.352 Å for 616 Cα atoms. On the other hand, the conformation of the lever arms of MD-IQ1/Ca2+-CaM is quite different from that of MD-IQ1/ELC. The long α-helix of the lever arm is straight in MD-IQ1/Ca2+-CaM but is bent by ∼15° at the site just N-terminal of the IQ1 in MD-IQ1/ELC.
The different orientations of the lever arms in MD-IQ1/Ca2+-CaM and in MD-IQ1/ELC are likely caused by the different interactions between the light chain and the heavy chain outside the IQ1. In MD-IQ1/Ca2+-CaM, the two conserved residues preceding IQ1, Asp764 and Arg767, form a salt bridge, stabilizing the straight α-helix structure (Fig. 1B). In contrast, in MD-IQ1/ELC, the side chain of Arg767 orientates away from Asp764 and forms a hydrogen bond with the amide nitrogen of Gly117 of ELC, and Asp764 forms a salt bridge with Lys760 (Fig. 1D). Moreover, the interactions between the light chain and the converter in MD-IQ1/Ca2+-CaM and MD-IQ1/ELC are different. The helix G and the loop between helices F and G of Ca2+-CaM mainly contact the converter, whereas in ELC the helix E is involved in the interaction with the converter (Fig. 1 B and D). Noticeably, Glu119 of helix G forms a salt bridge with Arg711 of the converter in MD-IQ1/Ca2+-CaM (Fig. 1B).
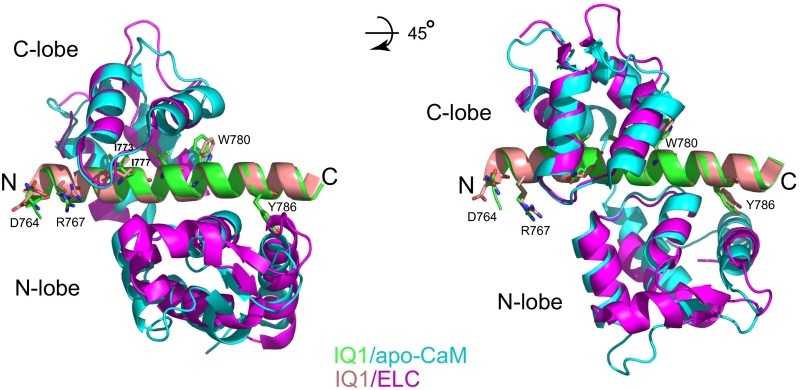
The overall structure of ELC in MD-IQ1/ELC is similar to that of apo-CaM in IQ1/apo-CaM (PDB ID code: 2IX7) (Fig. S2). As in MD-IQ1/ELC, but unlike MD-IQ1/Ca2+-CaM, the side chain of Arg767 in IQ1/apo-CaM does not form a salt bridge with Asp764. Therefore, the different orientations of the lever arm in MD-IQ1/Ca2+-CaM and MD-IQ1/ELC are likely to be caused by the Ca2+-induced different interactions between the light chain and the heavy chain rather than by differences in the light chain.
Fig. S2.
Structural comparison of Myo5a IQ1/apo-CaM and Myo5a IQ1/ELC. The structures of Myo5a IQ1/apo-CaM (PDB ID code: 2IX7) and IQ1/ELC (PDB ID code: 1OE9) are superimposed on the IQ1. The hydrophobic anchor residues, as well as Asp764 and Arg767, are shown as sticks. Note that, unlike the side chain of Arg767 in Myo5a IQ1/Ca2+-CaM (Fig. 1B), the side chain of Arg767 in IQ1/apo-CaM does not form a salt bridge with Asp764.
Interaction Between Ca2+-CaM and the IQ1.
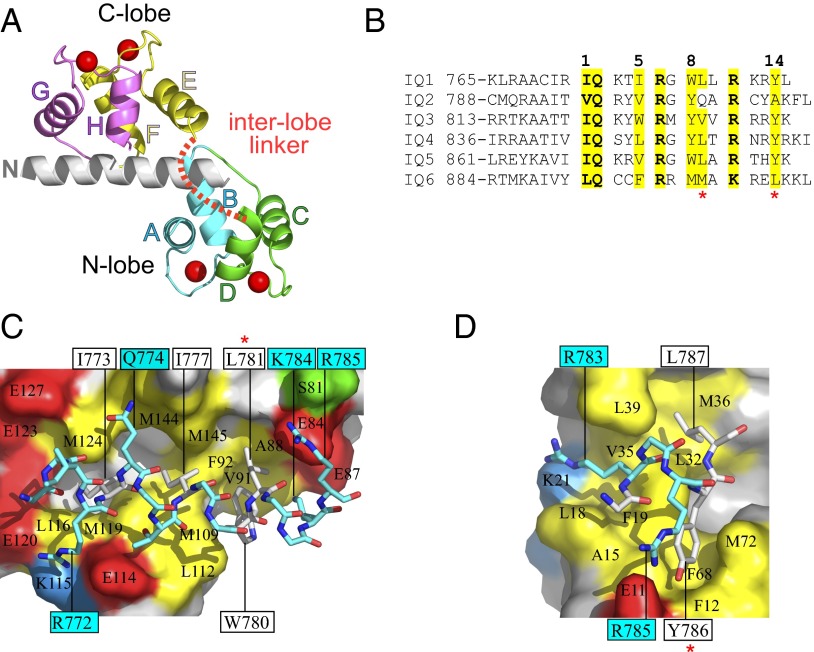
Similar to the classic orientation of most single α-helix/Ca2+-CaM complexes, Ca2+-CaM binds antiparallel to the straight α-helix of the Myo5a IQ1 (Fig. 2A). The IQ1/Ca2+-CaM domain is an ellipsoidal compact structure in which all eight helices of CaM (A–D in the N-lobe and E–H in the C-lobe) wrap around the IQ1 α-helix. The binding of Ca2+-CaM to the IQ1 is driven largely by hydrophobic interactions and by the electrostatic interactions between the basic residues in the IQ1 and the acidic residues in CaM. Based on the distances between four key hydrophobic anchor residues (Ile773, Ile777, Trp780, and Tyr786) docked into the hydrophobic pockets formed by Ca2+-CaM, we named the binding mode of the IQ1 the “1-5-8-14 mode” (Fig. 2B).
Fig. 2.
The interaction between the Myo5a IQ1 and Ca2+-CaM. (A) The structure of the Myo5a IQ1 in complex with Ca2+-CaM. The interlobe linker of Ca2+-CaM is disordered and is shown as a dashed red line. (B) Alignment of the six IQ motif sequences from Myo5a. The hydrophobic anchor residues are indicated by numbers. The red asterisks indicate the hydrophobic residues in positions 9 and 14 of most IQ motifs from mouse Myo5a. (C and D) The binding interface of the IQ1 and the C-lobe (C) and of the IQ1 and the N-lobe (D). The IQ1 is shown in stick representation with hydrophobic residues in white. CaM lobes are shown in surface representation, and residues that contribute hydrophobic (yellow), negatively charged (red), positively charged (blue), and polar (green) side-chain contacts (≤4 Å) to the IQ1 are differently colored. Selected residues are labeled. IQ1 residue labels are boxed.
There are extensive interactions between the C-lobe of Ca2+-CaM and the IQ1. Four hydrophobic residues (Ile773, Ile777, Trp780, and Leu781) on one face of the IQ1 helix dock into the hydrophobic pocket on the surface of the Ca2+ C-lobe (Fig. 2C). Outside this hydrophobic pocket the basic residues Lys784 and Arg785 of the IQ1 form salt bridges with Glu87 and Glu84 of CaM, respectively. On the opposite face of the IQ1 helix, IQ1 Arg772 forms salt bridges with CaM Glu120, and the signature residue IQ1 Gln774 forms a hydrogen bond with the main chain atom of CaM Met144. The buried surface area of the interaction between the C-lobe of Ca2+-CaM and the IQ1 is 1,672 Å2.
In contrast to the extensive interaction between the C-lobe of Ca2+-CaM and the IQ1, only four residues of the IQ1 are involved in binding of the N-lobe (Fig. 2D). The anchor residue Tyr786 docks into the hydrophobic pocket formed by Phe12, Ala15, Phe68, and Met72. The aliphatic parts of Arg783 and Leu787 contact the hydrophobic surface comprising residues Leu18, Phe19, Leu32, Val35, Met36, and Leu39. The highly conserved basic residue Arg785 in the IQ1 forms salt bridges with Glu11 in the N-lobe. The interface between the N-lobe of Ca2+-CaM and the IQ motif buries a solvent-accessible area of 927 Å2.
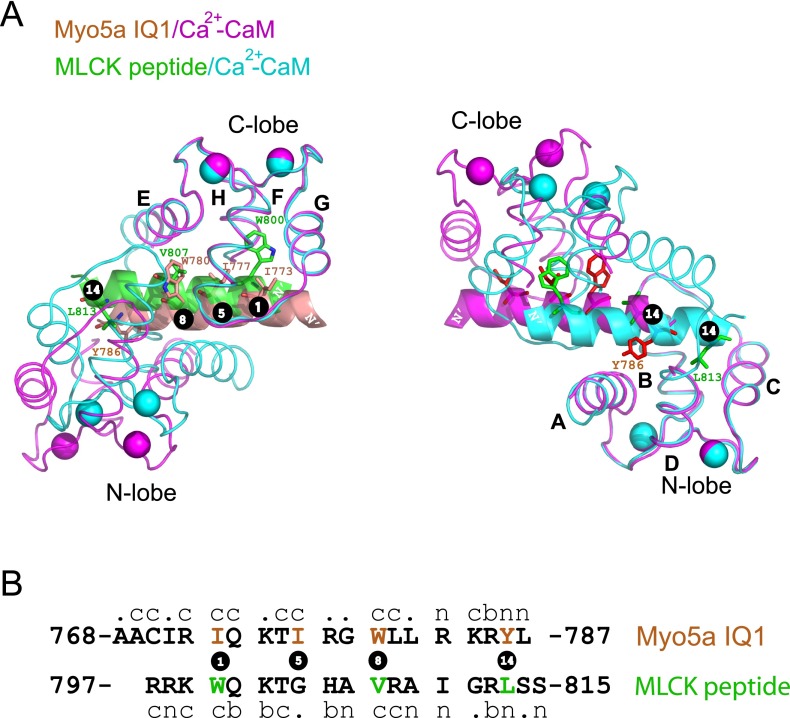
The Ca2+-CaM docking mode for the IQ1 (1-5-8-14 mode) is similar to that for the smooth muscle MLCK (smMLCK) peptide (1-8-14 mode), except that the IQ1 has a bulky hydrophobic residue (Ile777) and smMLCK has a small residue (Gly804) in position 5 (Fig. S3). The overall structure of Ca2+-CaM bound to the IQ1 resembles that bound to the smMLCK peptide. Particularly, the N-lobe and the C-lobe of Ca2+-CaM in complex with the IQ1 can be well aligned individually with those in complex with the smMLCK peptide, with an rmsd of 0.535 over 63 Cα pairs for the N-lobe and 0.498 over 57 Cα pairs for the C-lobe (Fig. S3A). On the other hand, the two lobes of Ca2+-CaM bound to the IQ1 are more separated from each other than those bound to the smMLCK peptide. The geometric difference between the two complexes is caused by the different target peptide sequence, particularly the anchor residues. The anchor residues Ile777 and Trp780 in position 5 and 8 of the IQ1 are bulkier than the counterpart residues Gly804 and Val807 in smMLCK. To accommodate those bulky side residues in the IQ1, the C-lobe moves slightly outward from its position in the structure of the complex with smMLCK (Fig. S3A, Left). The differences are more apparent in the interaction involving the N-lobe. Although both target peptides use the anchor residue at position 14 to dock into the N-lobe, the binding sites in the N-lobe are different. The hydrophobic patch formed by helices A and D interacts with Tyr786 of the IQ1, whereas that formed by helices C and D interacts with Leu813 of the smMLCK peptide (Fig. S3A, Right).
Fig. S3.
Structural comparison of Myo5a IQ1/Ca2+-CaM and smMLCK/Ca2+-CaM. (A) The overall conformation of Myo5a IQ1/Ca2+-CaM (1-5-8-14 mode) is compared with that of smMLCK/Ca2+-CaM (1-8-14 mode; PDB ID code: 1CDL) with the C-lobes (Left) or the N-lobes (Right) superimposed. The hydrophobic anchor residues are shown as sticks. (B) Sequence comparison of the Myo5a IQ1 and MLCK peptide. The letters “n,” “c,” and “b” indicate whether each residue of these motifs interacts with the N-lobe, the C-lobe, or both lobes of CaM. The hydrophobic anchor residues in each motif are numbered.
Among the six IQ motifs in Myo5a, the second IQ motif (IQ2) has the weakest affinity to Ca2+-CaM (21). IQ2 has a polar residue (Gln804) at position 9 and a small hydrophobic residue (Ala809) at position 14, whereas other IQ motifs have bulky hydrophobic residues at both positions (Fig. 2B). In IQ1/Ca2+-CaM, Leu781 at position 9 and Tyr786 at position 14 form hydrophobic interactions with the C-lobe and the N-lobe, respectively (Fig. 2 C and D). It is possible that the corresponding residues in IQ2 interact weakly with Ca2+-CaM, thus weakening the binding of IQ2 to Ca2+-CaM.
Structural Comparison of IQ1/apo-CaM and IQ1/Ca2+-CaM.
Although both apo-CaM and Ca2+-CaM bind antiparallel to the IQ1, the conformations of the two lobes of Ca2+-CaM are quite different from those of apo-CaM, and different sets of residues in the IQ1 interact with apo-CaM and Ca2+-CaM (Fig. 3).
Fig. 3.
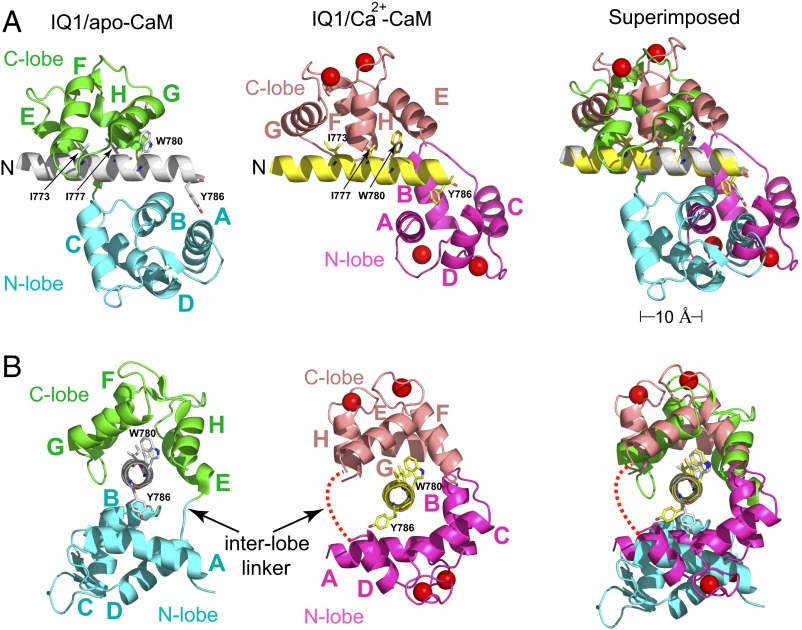
The Ca2+ transition induces CaM to flip-flop around the IQ1. (A) Views of the structures of the Myo5a IQ1/apo-CaM (PDB ID code: 2IX7) and IQ1/Ca2+-CaM with the IQ1 superimposed. The N-lobe and C-lobe of apo-CaM are colored cyan and green, respectively. The N-lobe and C-lobe of Ca2+-CaM are colored magenta and salmon, respectively. The helices of CaM are designated A–H. The N terminus of the IQ1 is indicated. Four hydrophobic anchor residues (Ile773, Ile777, Trp780, and Tyr786) are shown as sticks. Compared with apo-CaM, the N-lobe of Ca2+-CaM moves ∼10 Å toward the C terminus of the IQ1. (B) Views of A with a 90° rotation around the vertical axis. The IQ1 is in a nearly vertical orientation with its N and C termini at the bottom and the top, respectively. The interlobe linker of Ca2+-CaM, shown as a dashed red line, is located on the opposite side of the IQ1 in comparison with apo-CaM.
Superposition of the IQ motifs of IQ1/apo-CaM and IQ1/Ca2+-CaM shows that the C-lobe stays in the same position in Ca2+-CaM and apo-CaM, but the N-lobe rotates anticlockwise around the straight helix of the IQ1 and shifts ∼10 Å toward the C terminus of the IQ1 upon Ca2+ binding (Fig. 3A). Compared with the C-lobe in IQ1/apo-CaM, the C-lobe in the Ca2+-bound form rotates ∼180° around the axis perpendicular to the IQ1; thus, the interlobe linker is positioned on the opposite side of the IQ1. The N-lobe in the Ca2+-free form adopts a closed conformation and weakly contacts the C-terminal part of the IQ1. In contrast, the N-lobe in the Ca2+-bound form adopts an open conformation, thus exposing the hydrophobic cleft to fit the IQ1 (Fig. 3A). The most striking difference between these two complexes is that the interlobe linker of CaM is in opposite positions in IQ1/Ca2+-CaM and IQ1/apo-CaM (Fig. 3B). Thus, the Ca2+ transition induces CaM to flip-flop around the IQ1 helix.
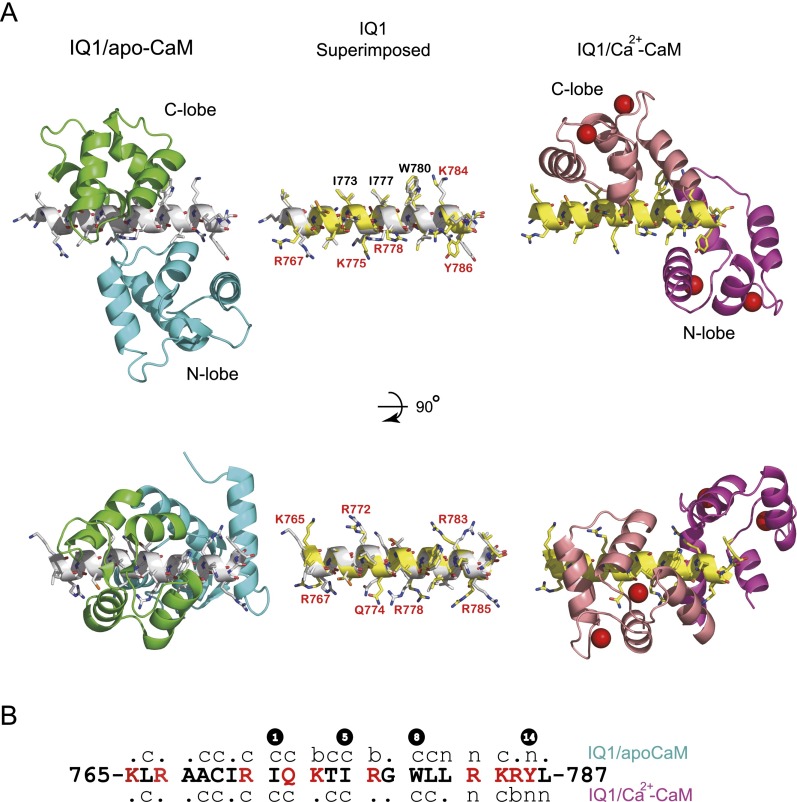
The IQ1 adopts different conformations to accommodate apo-CaM and Ca2+-CaM (Fig. S4). Although the overall structures of the IQ1 in complex with apo-CaM and with Ca2+-CaM are similar (rmsd of 0.647 Å over 23 Cα atoms), Ca2+ binding clearly alters the side-chain orientations of some residues in the IQ1, including Gln774, Tyr786, and all eight basic residues. Interestingly, among the four anchor residues, Try786 is the only residue whose conformation is noticeably changed by Ca2+ binding.
Fig. S4.
Structural comparison of the IQ1 in IQ1/CaM with or without bound Ca2+. (A) The structure of IQ/Ca2+-CaM is compared with IQ1/apo-CaM (PDB ID code: 2IX7) with the Cα of the IQ1 superimposed (rmsd of 0.647 Å over 23 Cα atoms). The residues whose conformations are altered by Ca2+ binding are labeled in red. Among four anchor residues (I773, I777, W780, and Y786), only the conformation of Y786 is changed by Ca2+ binding. (B) Sequence of the IQ1. The letters “n,” “c,” and “b” indicate whether each residue of the IQ1 interacts with the N-lobe, the C-lobe, or both lobes of CaM. The residues whose conformations are altered by Ca2+ binding are indicated in red. The hydrophobic anchor residues are numbered.
CaM Continuously Associates with the IQ1 During Ca2+ Transition.
The flip-flop of apo-CaM and Ca2+-CaM relative to the IQ1 immediately suggests a mechanism for this conformational transition: The binding of Ca2+ to apo-CaM in the IQ1 first induces the dissociation of CaM from the IQ1, and then Ca2+-CaM rebinds to the IQ1. Conversely, the dissociation of Ca2+ from Ca2+-CaM in the IQ1 first induces the dissociation of CaM from the IQ1, and then apo-CaM rebinds to the IQ1. If indeed this mechanism is true, we expect that the Ca2+ transition will induce CaM to dissociate from the IQ1.
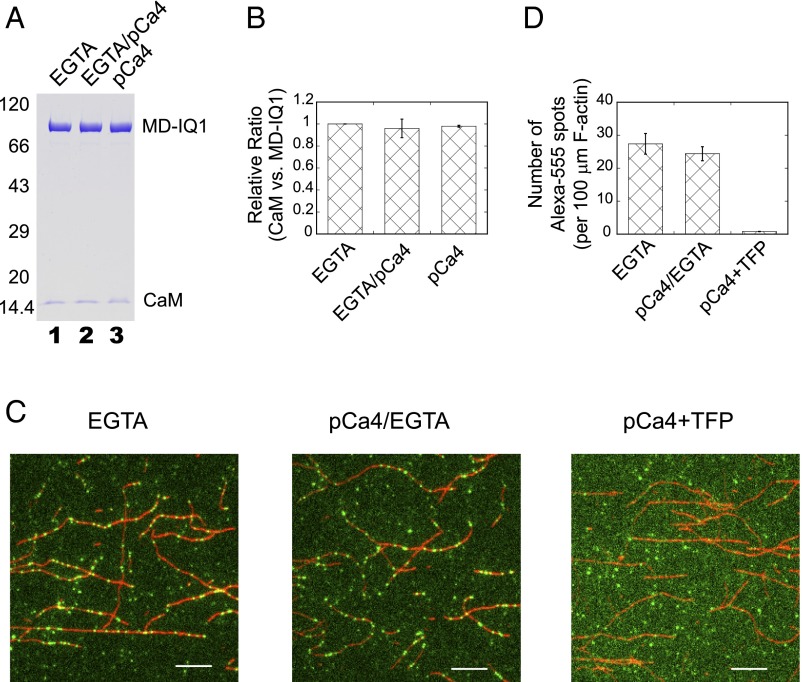
To test this possibility, we first examined the association of CaM with the MD-IQ1 upon Ca2+ transition using a pull-down assay. MD-IQ1/CaM was first bound to anti-Flag beads and then was washed twice with Ca2+-free solution followed by pCa4 solution. The amount of CaM associated with the MD-IQ1 after treatment was compared with the samples washed only with Ca2+-free solution or with pCa4 solution. The amount of CaM associated with the MD-IQ1 was essentially the same with the different washing methods (Fig. 4 A and B), indicating that no significant amount of CaM dissociates from the MD-IQ1 during the Ca2+ transition.
Fig. 4.
CaM continuously associates with the Myo5a MD-IQ1 during the Ca2+ transition. (A) Purified MD-IQ1 bound to anti-Flag beads was washed twice alternately with Ca2+-free (EGTA) solution and pCa4 solution, eluted by Flag peptide, and subjected to SDS/PAGE analysis (lane 2). Control samples were prepared similarly except they were washed only with Ca2+-free solution (lane 1) or with pCa4 solution (lane 3). The protein bands in SDS/PAGE were visualized by Coomassie blue staining. (B) The relative ratio of CaM to the MD-IQ1 (average ± SD; three independent assays). (C) Effects of Ca2+ treatment on the association of Alexa-555–labeled CaM with the MD-IQ1. The MD-IQ1 in complex with Alexa-555–labeled CaM was introduced into a chamber preabsorbed with Alexa-488–labeled F-actin and subjected to the following three treatments sequentially: (i) EGTA (rinsing with 50 μL EGTA buffer); (ii) pCa4/EGTA (rinsing with 50 μL pCa4 buffer followed immediately by 50 μL EGTA buffer); and (iii) pCa4+TFP (rinsing with 50 μL pCa4 buffer containing 100 μM TFP). The images (512 × 512 pixels each) of the Alexa-555–labeled MD-IQ1 (green) and Alexa-488–labeled F-actin (red) after each treatment were recorded. For clarity, only a part of the image (240 × 240 pixels) is shown. (Scale bars, 5 μm.) (D) The number of Alexa-555 fluorescent spots that colocalized with Alexa-488–labeled F-actin after each treatment. Values are means ± SD of six different images.
We further investigated the association of CaM with the MD-IQ1 during the Ca2+ transition at the single-molecule level. The MD-IQ1 in complex with Alexa-555–labeled CaM was introduced into an F-actin–coated glass chamber, and the unbound molecules were removed by repeated washing with EGTA solution. The chamber then was washed with four chamber-volumes of pCa4 solution, followed immediately (within ∼25 s) by EGTA solution. Thus, MD-IQ1/Alexa-555-CaM had been exposed to a Ca2+ transition cycle, i.e., an increase and a decrease in Ca2+ concentration. The images before and after treatment with a Ca2+ transition cycle were recorded under a total internal reflection fluorescence (TIRF) microscope, and the fluorescent spots that colocalized with actin filaments in the images were quantified (Fig. 4C). The number of the actin-colocalized fluorescent spots was only slightly lower after one Ca2+ transition cycle (Fig. 4D), indicating that CaM does not dissociate from the MD-IQ1 during the Ca2+ transition. In contrast, the actin-colocalized fluorescent spots were completely removed by pCa4 solution containing 100 μM trifluoperazine (TFP) (Fig. 4 C and D), a reagent that efficiently strips CaM from the IQ motifs (22).
The above results indicate that neither the binding of Ca2+ to IQ1/apo-CaM nor the dissociation of Ca2+ from IQ1/Ca2+-CaM is accompanied by the dissociation of CaM from the IQ motif. Instead, an in situ conformational change of CaM occurs during the Ca2+ transition.
Ca2+ Transition in IQ1/CaM.
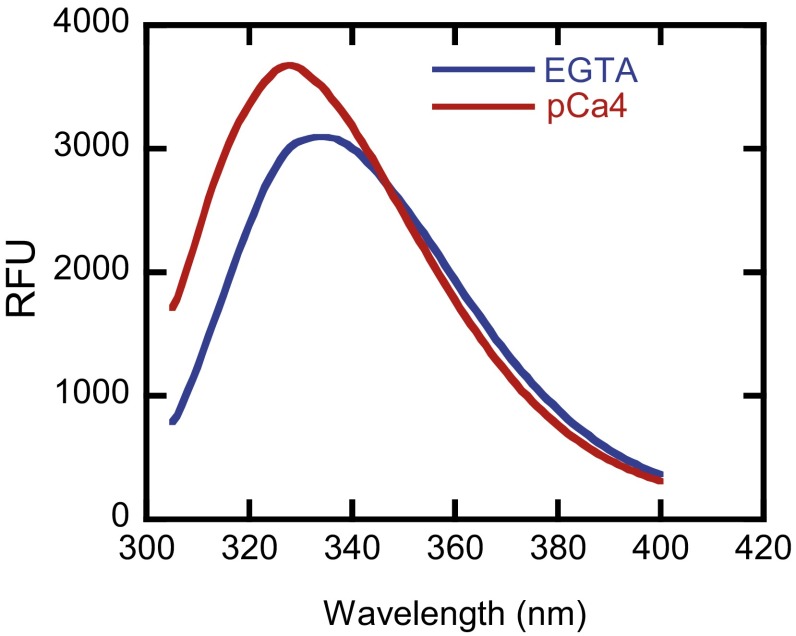
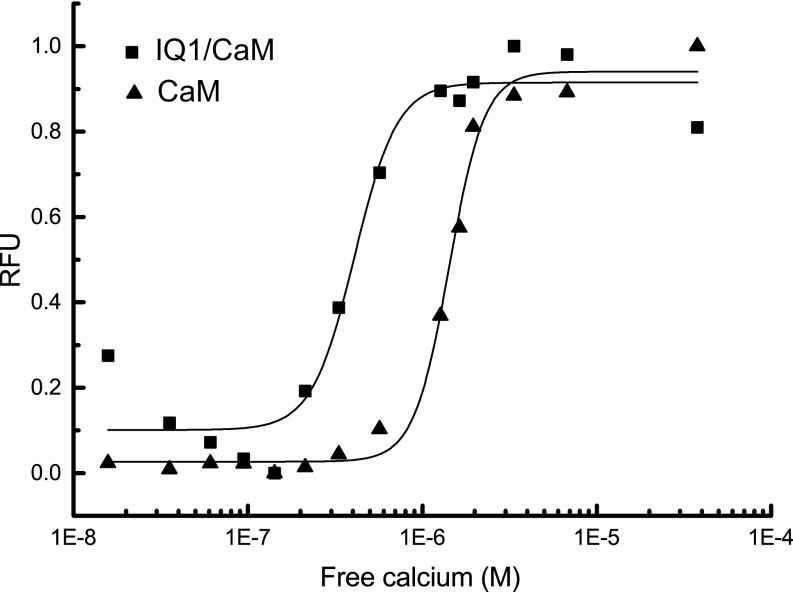
The profound interaction between the IQ1 and CaM with or without bound Ca2+ likely affects the Ca2+ affinity and kinetics of the Ca2+ transition. CaM does not contain tryptophan residues, and the Myo5a IQ1 contains a single tryptophan residue, which is wrapped by the C-lobe of both Ca2+-CaM and apo-CaM (Fig. 3A). The tryptophan fluorescence of IQ1/CaM is enhanced by Ca2+ binding (Fig. S5). Titration of the tryptophan fluorescence of IQ1/CaM with Ca2+ yielded the Ca2+ affinity of IQ1/CaM (Kd = 0.44 ± 0.10 μM), which is slightly stronger than that of unbound CaM (Kd = 1.43 ± 0.05 μM) (Fig. S6).
Fig. S5.
Tryptophan fluorescence emission spectra of IQ1/CaM in the absence or presence of Ca2+. CaM (15 μM) was incubated with 10 μM IQ1 peptide under EGTA conditions or pCa4 conditions for 30 min. Tryptophan fluorescence was excited by 295 nm, and the 305–400 nm emission spectra of IQ1/CaM were collected. RFU, relative fluorescence units.
Fig. S6.
Determination of the Ca2+ affinity of CaM and IQ1/CaM. For CaM, 277 nm was used to excite tyrosine, and the emission wavelength was monitored at 308 nm. For IQ1/CaM, a 295-nm excitation wavelength was used, and the emission wavelength was monitored at 320 nm. The data were normalized and fit with a modified Hill equation to obtain the Ca2+ affinities, which were 1.43 ± 0.05 μM for CaM and 0.44 ± 0.10 μM for IQ1/CaM.
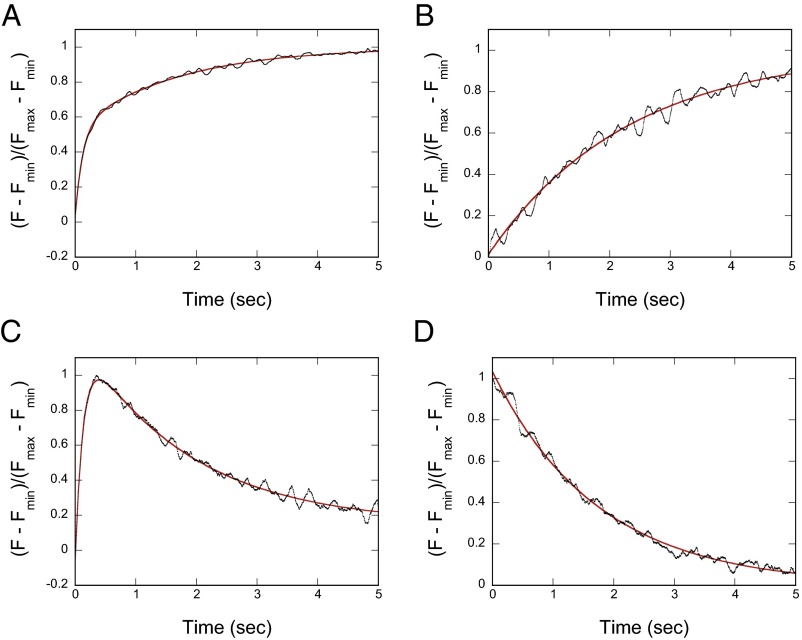
To measure the rate of Ca2+ dissociation from the IQ1/CaM, we used stopped-flow measurements of changes in the Quin-2 fluorescence upon binding Ca2+ released from IQ1/Ca2+-CaM. The Quin-2 fluorescence change in IQ1/CaM is biphasic with rates of 8.30 ± 0.33/s and 0.58 ± 0.02/s (Fig. 5A). To identify the Ca2+-binding sites responsible for those two phases, we measured the change in Quin-2 fluorescence using the IQ1/CaM-B12Q mutant, which contains E31Q and E67Q mutations that abolish the Ca2+-binding ability in the N-lobe (23). B12Q mutations weaken the interaction between the IQ1 and CaM only slightly (Fig. S7). IQ1/CaM-B12Q contains a single kinetic component with a rate of 0.45 ± 0.03/s, a value equivalent to the slower rate in wild-type IQ1/CaM (Fig. 5B). These results indicate that the faster phase and the slower phase of fluorescence change in IQ1/CaM upon Ca2+ dissociation correspond to Ca2+ dissociations from the N-lobe and the C-lobe, respectively.
Fig. 5.
The rates of Ca2+ dissociation from IQ1/CaM. (A and B) Time course of fluorescence enhancement of Quin-2 after mixing 75 μM Quin-2 with 30 μM Ca2+, 10 μM IQ1, and 4 μM wild-type CaM (A) or B12Q (B). The smooth line (red) is the best fit to a double exponential (A) or a single exponential (B) to obtain the Ca2+ dissociation rates, which are 8.30 ± 0.33/s (∼53% of total amplitude) and 0.58 ± 0.02/s (∼47% of total amplitude) for wild-type IQ1/CaM (n = 2) and 0.45 ± 0.03/s for IQ1/CaM B12Q (n = 2). (C and D) Time course of the change in tryptophan fluorescence after mixing 10 mM EGTA with 100 μM Ca2+, 10 μM IQ1, and 15 μM wild-type CaM (C) or B12Q (D). The smooth red line is the best fit to a double exponential (C) or a single exponential (D) to obtain the Ca2+ dissociation rates, which were 6.94 ± 0.76/s (∼100% of maximum amplitude) and 0.58 ± 0.03/s (∼97% of maximum amplitude) for wild-type IQ1/CaM (n = 3) and 0.57 ± 0.01/s for IQ1/CaM B12Q (n = 2). All concentrations refer to the final concentrations after mixing.
Fig. S7.
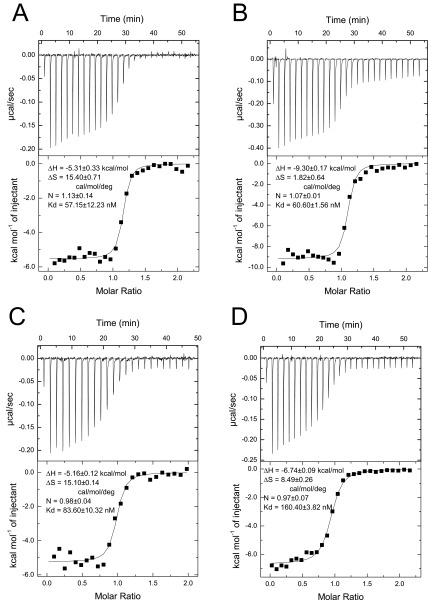
ITC characterization of the interactions of the IQ1 with CaM with or without bound Ca2+. (A and B) The IQ1 peptide at 200 μM in 20 μM apo-CaM (A) or 20 μM Ca2+-CaM (B). (C and D) The IQ1 peptide at 200 μM in 20 μM apo-CaM B12Q (C) or 20 μM Ca2+-CaM B12Q (D). All the isotherms are fit to a single binding site model. The panels show the addition of 1.5-μL aliquots of titrant into the target solution (Upper) and binding isotherms (Lower). The thermodynamic parameters are the means of two separate experiments.
We further analyzed the dissociation rate of Ca2+ from IQ1/CaM using stopped-flow measurements of the change in tryptophan fluorescence as a function of time after the addition of EGTA to chelate-free Ca2+. The tryptophan fluorescence first increases and then decreases (Fig. 5C), indicating that the fluorescence reflects two events. The rates of tryptophan fluorescence increase and decrease were 6.94 ± 0.76/s and 0.58 ± 0.03/s, respectively. These values are similar to the values for the faster and slower components detected in the Quin-2 experiments, indicating that the faster increase and the slower decrease of tryptophan fluorescence are caused by Ca2+ dissociation from the N-lobe and the C-lobe, respectively. Consistent with this notion, the dissociation of Ca2+ from IQ1/CaM-B12Q, which contains a single kinetic component with a rate of 0.57 ± 0.01/s, produces a decrease in tryptophan fluorescence (Fig. 5D). Those results indicate that during the Ca2+ transition in IQ1/CaM, Ca2+ dissociates from the N-lobe before it dissociates from the C-lobe.
Our pull-down assay and single-molecule assay show that the Ca2+ transition in IQ1/CaM does not induce the dissociation of CaM from the IQ1. We thus expected that the rates of Ca2+ dissociation from IQ1/CaM are independent of exogenous CaM. To test this possibility, we measured the rates of change in tryptophan fluorescence in IQ1/CaM upon Ca2+ dissociation in the presence of different concentrations of CaM. As expected, the rates of both the faster and the slower components are marginally changed when the total concentration of CaM increases from 5 μM to 20 μM (Table S2). Based on the affinity of Ca2+-CaM to the IQ1 (Kd = 60.6 nM) (Fig. S7B), we calculated that when the total CaM concentration increases from 5 to 20 μM, the free CaM concentration increases from 0.059 to 10.06 μM (Table S2). Thus, an approximately 200-fold change in the free CaM concentration has little effect on the Ca2+ dissociation rates from IQ1/Ca2+-CaM.
Table S2.
The rates of Ca2+ dissociation from the IQ1/CaM complex
| [CaM]total, μM | [CaM]free, μM | k−1, /s | k-2, /s |
| 5.00 | 0.059 | 8.24 ± 0.41 | 0.56 ± 0.04 |
| 10.00 | 0.749 | 7.88 ± 0.04 | 0.53 ± 0.04 |
| 15.00 | 5.117 | 6.94 ± 0.76 | 0.58 ± 0.03 |
| 20.00 | 10.060 | 6.75 ± 0.53 | 0.64 ± 0.04 |
Values are means ± SD of three independent assays. The dissociation rates of Ca2+ from the IQ1/Ca2+-CaM complex are obtained from the measurements of tryptophan fluorescence as described in Fig. 5C. The final mixture contains 10 μM IQ1 peptide and the indicated total concentration of CaM. The concentrations of free CaM were calculated based on the apparent Kd (60.6 nM) of Ca2+-CaM to the IQ1 (Fig. S7B).
Table 1 summarizes the effects of IQ1 binding on the interaction of Ca2+ with CaM. The binding of CaM to the IQ1 slightly enhances the Ca2+ affinity and substantially decreases the rates of Ca2+ association and dissociation.
Table 1.
Effects of the IQ1 on the Ca2+ affinity and the kinetics of the Ca2+ transition of CaM
| Kd, μM | k−1, /s | k-2, /s | k+1, 106 /M/s | k+2, 106 /M/s | |
| CaM | 1.43 ± 0.05* | >1,000† | 7.5 ± 0.0† | >500‡ | 5.55‡ |
| IQ1/CaM | 0.44 ± 0.10* | 6.94 ± 0.76§ | 0.58 ± 0.03§ | 15.8‡ | 1.32‡ |
Kd, the Ca2+ affinity, is obtained from titration of CaM and IQ1/CaM with Ca2+ (Fig. S6).
The Ca2+ dissociation rates from the N-lobe of CaM (k−1) and from the C-lobe of CaM (k-2) are cited from ref. 24.
The Ca2+ association rates with the N-lobe (k+1) and with the C-lobe (k+2) are calculated based on the equations k+1 = k−1/Kd and k+2 = k-2/Kd.
The Ca2+ dissociation rates from the N-lobe (k−1) and from the C-lobe (k-2) for IQ1/CaM are obtained from measurement of changes in tryptophan fluorescence (Fig. 5C).
Discussion
CaM is a ubiquitous and multifunctional protein that binds to many target proteins in a Ca2+-dependent or -independent manner. Many target proteins can bind only to Ca2+-CaM, but a few target proteins, including myosin-5 and a number of ion channels, can bind to Ca2+-CaM or to apo-CaM (4, 5). Although hundreds of high-resolution structures of target proteins in complex with CaM have been solved, Ca2+-free and Ca2+-bound structures have not been determined for a single target protein/CaM complex. Several high-resolution structures of Myo5a in complex with Ca2+-free CaM or CaM-like light chain have been solved (17–19); here we present the crystal structure of Myo5a complexed with Ca2+-CaM.
The versatility of CaM function in regulating a large number of different Ca2+-dependent signal pathways depends on its ability to interact with a wide range of target proteins. Conversely, binding to the target proteins might alter the thermodynamics and kinetics of CaM in its interaction with Ca2+. It has been shown that the Ca2+ affinity and the rate of Ca2+ dissociation from CaM bound to the IQ motifs of voltage-dependent ion channels vary with the IQ motif (24, 25), suggesting that CaMs in complex with target proteins are able to respond to distinct Ca2+ signals that differ in terms of speed, amplitude, and spatiotemporal patterning. Here, we found that the binding of the Myo5a IQ1 to CaM substantially enhances the Ca2+ affinity and decreases the rates of Ca2+ association and dissociation (Table 1) and that CaM binds to the Myo5a IQ1 continuously during the Ca2+ transition. Therefore, the Myo5a IQ1/CaM complex can be considered an intact Ca2+ sensor.
Ca2+-Induced Conformational Transition of CaM Bound to the IQ1.
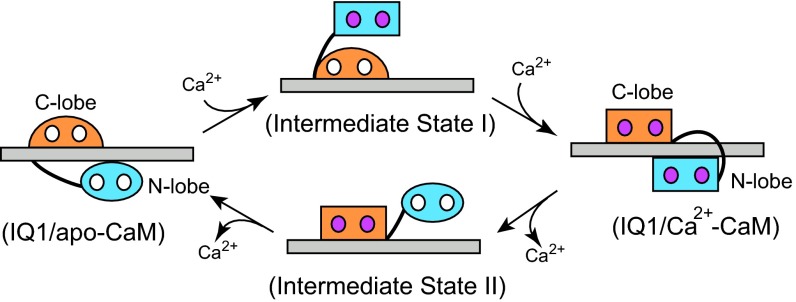
The interlobe linker of apo-CaM in complex with the Myo5a IQ1 is located on the opposite side of the IQ1 in IQ1/Ca2+-CaM (Fig. 3). However, neither the binding of Ca2+ to apo-CaM nor the dissociation of Ca2+ from Ca2+-CaM is accompanied by the dissociation of CaM from the IQ1, raising questions about how the interlobe linker traverses across the long IQ1 α-helix during the Ca2+ transition. We propose that during the Ca2+ transition the C-lobe continuously associates with the IQ1, and the N-lobe rotates around the IQ1 to bind to the new position in the IQ1, thus placing the interlobe linker on the opposite side of the IQ1 (Fig. 6).
Fig. 6.
Model for the Ca2+-induced conformational changes of CaM complexed with the Myo5a IQ1. The CaM conformations are represented by a rectangle (open conformation), oval (closed conformation), and semicircle (semiopen conformation). The N-lobe is shown in cyan, and the C-lobe is shown in orange. The IQ1 is shown as a gray bar, Ca2+ is shown as a small hot pink circle; and the empty Ca2+-binding site is shown as small white circle. When the Ca2+ level increases, IQ1/apo-CaM transforms to IQ1/Ca2+-CaM via intermediate state I. First, Ca2+ binds to the N-lobe and induces it to form an open conformation. The Ca2+-bound N-lobe cannot form a proper interaction with the C-terminal portion of the IQ1 and thus dissociates from it. Then Ca2+ binds to the C-lobe, inducing the C-lobe to rotate 180° around the axis perpendicular to the IQ1 and inducing the Ca2+-bound N-lobe to rotate anticlockwise around the IQ1 (visualize the structure from the right side) to bind to the C-terminal portion of the IQ1. When the Ca2+ level decreases, IQ1/Ca2+-CaM transforms to IQ1/apo-CaM via intermediate state II. First, Ca2+ dissociates from the Ca2+-bound N-lobe, so that the N-lobe forms a closed conformation and dissociates from the IQ1. Then Ca2+ dissociates from the Ca2+-bound C-lobe, inducing an in situ 180° rotation of the C-lobe to form the semi-open conformation and a clockwise rotation of the apo-N-lobe to bind to the C-terminal portion of the IQ1.
Our model is consistent with following observations. First, structural and kinetic analyses indicate that the Ca2+ transition occurs in the N-lobe before it occurs in the C-lobe. In IQ1/apo-CaM, the C-lobe is in a semi-open conformation and cannot bind tightly to Ca2+ without a conformational change (17). The strong interaction between the C-lobe and the IQ1 likely inhibits this conformational change, thus greatly decreasing the Ca2+ association rate in the C-lobe. In contrast, the N-lobe is in the closed conformation and interacts weakly with the IQ1, making the N-lobe more accessible to Ca2+ than the C-lobe. In IQ1/Ca2+-CaM, the IQ1 interacts with the Ca2+-C-lobe more strongly than with the Ca2+-N-lobe, thus likely slowing the dissociation of Ca2+ from the Ca2+-C-lobe more than from the Ca2+-N-lobe. Consistently, kinetic analysis has shown that, in IQ1/Ca2+-CaM, Ca2+ dissociates approximately 10-fold faster from the N-lobe than from the C-lobe (Fig. 5 and Table 1). Second, regardless of the Ca2+-binding state, the affinity of CaM to the IQ1 is similar to that of the C-lobe but is substantially stronger than that of the N-lobe (21). In other words, the C-lobe plays a major role in the interaction between the IQ1 and CaM, and the N-lobe makes little contribution to the overall affinity between the IQ1 and CaM. Thus, it is possible that during the Ca2+ transition, the C-lobe constitutively associates with the IQ1, and the N-lobe dissociates from the IQ1. Third, the tryptophan fluorescence of IQ/CaM rises rapidly and decreases slowly during Ca2+ dissociation (Fig. 5C), indicating the presence of an intermediate state. The transient high tryptophan fluorescence during Ca2+ dissociation probably represents the intermediate state II (Fig. 6), in which the apo-N-lobe dissociates from its original binding site in the IQ1 and the Ca2+-C-lobe still binds to the IQ1.
Mechanism of Ca2+ Activation of Myo5a.
In the absence of Ca2+, Myo5a is in a folded, inhibited state such that the GTD interacts with the head and inhibits its motor activity. High levels of Ca2+ abolish the interaction between the head and the GTD, thus activating motor activity. Because the C-lobe of CaM in the IQ1 is necessary for mediating Ca2+ regulation of Myo5a, we previously proposed that the C-lobe of CaM in the IQ1 interacts with the GTD in the absence of Ca2+ (13). It is plausible that the C-lobe of apo-CaM in the IQ1 forms specific interactions with the GTD and that the Ca2+-induced conformational change of the C-lobe disrupts these interactions, thus abolishing the inhibition of Myo5a motor function by the GTD.
In vivo experiments show that the motor function of Myo5 might be directly activated by Ca2+ influx. In hippocampal neurons, the Myo5b-dependent movement of the AMPA receptor-bearing recycling endosomes in dendritic spines is reported to be triggered by elevated Ca2+ levels following presynaptic simulation (26). In the fly compound eye, light-induced Ca2+ influx is thought to activate the Myo5-dependent movement of pigment granules (27). The kinetic study described here showed that the rate of Ca2+ dissociation from the C-lobe of CaM in a complex with the Myo5a IQ1 was ∼0.58/s, suggesting that Myo5a might remain in the activated state for a few seconds after being activated by Ca2+ influx. Considering the velocity of Myo5a movement along the actin filament (∼0.5 μm/s), the Ca2+-activated Myo5a would be able to travel a substantial distance before being turned off.
Micromolar levels of Ca2+ also induce a dissociation of CaM from Myo5a IQ motifs (most likely from the IQ2) (15, 16, 28), thus compromising the rigid structure of the lever arm and inhibiting the in vitro actin-gliding activity. Therefore, the overall effect of Ca2+ on Myo5a motor function probably depends on both the rate of Ca2+ transition in the CaM bound to the IQ1 and the rate of Ca2+-induced CaM dissociation from the IQ2. Although Nguyen and Higuchi reported that Ca2+ induces a rapid dissociation of CaM from Myo5a (29), the precise rates of CaM dissociation from each IQ motif of Myo5a remain to be determined.
In addition to Ca2+, the cargo-binding protein melanophilin can activate the motor function of Myo5a (10–12, 30). However, this activation was observed only in conditions of relatively high ionic strength, suggesting that other factors might be involved. One possibility is that transient rises in Ca2+ induce Myo5a to form an extended conformation, which then is stabilized by the binding of melanophilin. Thus, it would be important in the future to analyze the regulation of Myo5a motor function by transient Ca2+ in the presence of cargo-binding proteins.
Materials and Methods
Expression and Purification of Myo5a MD-IQ1/CaM.
The cDNA of the Myo5a MD-IQ1 (residues 1–791) was amplified from mouse Myo5a (7) by PCR and subcloned into pFastFTc, a modified pFastBacHTc transfer vector (Invitrogen) containing a FLAG-tag instead of a His-tag. The expressed MD-IQ1 contains an N-terminal sequence of MHHDYKDDDDKVD (the FLAG-tag is underlined). Recombinant baculovirus was prepared as previously described (31). To express MD-IQ1/CaM, sf9 cells were coinfected with two recombinant baculoviruses expressing the MD-IQ1 and CaM (7). The expressed MD-IQ1 was purified with anti-FLAG M2 affinity chromatography (Sigma-Aldrich) (31), followed by Superdex S200 chromatograph (GE Healthcare) preequilibrated with 10 mM Tris⋅HCl (pH 7.5), 0.2 M NaCl, 1 mM DTT, 1 mM EGTA, and 10% glycerol. The purified MD-IQ1/CaM protein was concentrated to ∼15 mg/mL using an Amicon Ultra-4 Centrifugal Filter (Millipore) and was stored at −80 °C before crystallization.
For function assays, we used the MD-IQ1 and Myo5a heavy meromyosin (Myo5a-HMM) constructs containing an N-terminal tag (MSYYHHHHHH DYKDD DDKNI PTTEN LYFQG AMGIR NSKAY VDELT SPA; the His6-tag and FLAG-tag are underlined) (13). The expression and purification were as previously described (13).
Crystallization, Data Collection, and Processing.
Crystals were grown at 20 °C by the hanging-drop vapor-diffusion method using equal amounts of MD-IQ1/CaM (∼15 mg/mL) and reservoir solution [containing 100 mM Tris⋅HCl (pH 7.5), 2 mM CaCl2, 2 mM DTT, 2 mM NaN3, 10% glycerol, and 6% PEG8000]. The crystals were cryoprotected in the mother liquor supplemented with 30% glycerol and flash cooled in liquid nitrogen. The diffraction data were collected at 100 K at the Shanghai Synchrotron Radiation Facility beamline BL17U and processed using the HKL-2000 suite (32). The crystal belongs to the P212121 space group and contains one MD-IQ1/CaM heterodimer per asymmetric unit. The structure was solved by molecular replacement (MR) in Phaser using the motor domain structure of chicken Myo5a MD-1IQ/ELC (PDB ID code: 1OE9) as search model, yielding a good electron density map for CaM (33). The model was built in Coot and refined using Phenix suite (34, 35). RAMPAGE analysis of the final model reveals that 96.48% of residues are in favorable regions, and 3.52% are in the allowed region (36). Structural figures were generated with PyMOL.
Pull-Down Assay of GTD with the MD-IQ1 and Myo5a-HMM.
To examine the effects of Ca2+ on the binding of the GTD with the MD-IQ1 and Myo5a-HMM, we performed GST pull-down assays under EGTA conditions and pCa4 conditions. For the pull-down assay under EGTA conditions, 100 μL of 0.5 μM GST-GTD or GST and 1 μM FLAG-tagged MD-IQ1 or Myo5a-HMM in washing buffer [20 mM 3-(N-morpholino)propanesulfonic acid (Mops)-KOH (pH 7.0), 50 mM NaCl, 1 mM MgCl2, 1 mM EGTA, and 1 mM DTT] were mixed with 10 μL of glutathione (GSH)-Sepharose (GE Healthcare) and incubated with rotation at 4 °C for 2 h. After three washings with 200 μL washing buffer to remove the unbound proteins, the bound proteins were eluted with 40 μL elution buffer [10 mM GSH, 50 mM Tris⋅HCl (pH 7.5), 50 mM NaCl, and 1 mM DTT]. The pull-down assay under pCa4 conditions was performed similarly, except that the washing buffer contained 20 mM Mops-KOH (pH 7.0), 50 mM NaCl, 1 mM MgCl2, 0.87 mM EGTA, 1 mM CaCl2, and 1 mM DTT. The eluted proteins (20 μL each) were separated by SDS/PAGE (5–20%) and detected by Coomassie blue staining or Western blot using HRP-conjugated anti-FLAG antibody (Sigma-Aldrich). The eluted Myo5a-HMM samples for Western blotting had been prediluted 10 times before being loaded onto SDS/PAGE.
Isothermal Titration Calorimetry.
CaM was dialyzed overnight against EGTA buffer [25 mM Tris⋅HCl (pH 7.5), 100 mM KCl, and 1 mM EGTA] or pCa4 buffer [25 mM Tris⋅HCl (pH 7.5), 100 mM KCl, 1 mM CaCl2, and 0.87 mM EGTA]. The IQ1 powder was dissolved in EGTA and pCa4 buffer, respectively. The isothermal titration calorimetry (ITC) experiments were performed on an ITC-200 instrument (GE Healthcare) as follows. Wild-type CaM or CaM-B12Q (20 μM) was titrated by the IQ1 peptide (200 μM) at 25 °C and with a fixed stirring speed of 750 rpm. Titration consisted of 27 injections, 0.5 μL for the first injection and 1.5 μL for all following injections. To achieve complete equilibration, the time between each injection was 120 s. The first injection of 0.5 μL was ignored in the final data analysis. The blank injections of the IQ1 into the corresponding buffer were used to account for the heat of mixing and dilutions. The values were analyzed using standard ITC software with an equation as described previously (37, 38).
Pull-Down Assay of the MD-IQ1 with CaM.
To examine the effects of Ca2+ on the association of CaM with the MD-IQ1, we performed a pull-down assay of the MD-IQ1 under different Ca2+ conditions. Purified MD-IQ1 (∼4 μM, 200 μL) in Ca2+-free solution [50 mM Tris⋅HCl (pH 7.5), 0.15 M NaCl, and 1 mM EGTA] was incubated with 50 μL anti-Flag M2 beads with rotation for 2 h at 4 °C. Anti-Flag M2 beads then were washed twice with 200 μL of Ca2+-free solution followed by 200 μL of pCa4 solution (Ca2+-free solution plus 1.1 mM CaCl2). The bound proteins were eluted with 50 μL 0.25 mM FLAG peptide in Ca2+-free solution. Two control samples were prepared similarly except that only Ca2+-free solution or pCa4 solution was used throughout the procedures. After adjusting free Ca2+ to ∼0.1 mM by adding CaCl2, the eluted proteins were analyzed by SDS/PAGE, visualized by Coomassie Blue staining, and quantified using the ImageJ program.
Single-Molecule Microscopy.
The coverslips were cleaned by sonication and stored in double-distilled H2O to keep the surface hydrophilic (39). The flow chambers (25 × 0.2 × 2–3 mm, volume of 10–15 μL) used for the in vitro single-molecule assays were assembled as previously described (40). We used an inverted Nikon Ti-E TIRF microscope with a Nikon ×100, 1.49 NA objective to excite the surface and an electron-multiplying CCD to image the emission.
The flow chamber was first incubated with 0.2 mg/mL N-ethylmaleimide (NEM)-myosin in high-salt buffer [10 mM Hepes-KOH (pH 7.5), 500 mM KCl, and 5 mM MgCl2] for 5 min and blocked with casein (1 mg/mL). Then 40 nM Alexa-488–labeled F-actin was added and incubated for 4 min. All buffers added thereafter contained a deoxidation system (2 U/μL catalase, 0.04 U/μL glucose oxidase, and 6 mg/mL glucose). After rinsing with EGTA buffer [20 mM Hepes-KOH (pH 7.6), 25 mM KCl, and 1 mM EGTA] to remove the unbound F-actin, the chamber was perfused with 15 μL Alexa-555–labeled MD-IQ1 (∼100 pM) in the EGTA buffer and incubated for 3 min. After rinsing with EGTA buffer to remove the unbound MD-IQ1 molecules, the chamber was subjected to the following three treatments sequentially: (i) rinsing with 50 μL EGTA buffer; (ii) rinsing with 50 μL pCa4 buffer [20 mM Hepes-KOH (pH 7.6), 25 mM KCl, 1 mM EGTA, and 1.1 mM CaCl2] followed immediately by 50 μL EGTA buffer; and (iii) rinsing with pCa4 buffer containing 100 μM TFP. The images (512 × 512 pixels) were recorded after each treatment and merged using the ImageJ program. The Alexa-555 fluorescent spots that colocalized with Alexa-488 NEM–labeled F-actin were quantified and normalized to the total length of F-actin.
Skeletal myosin was purified from rabbit skeletal muscle as described (41). NEM-myosin was prepared by incubating 70 μM rabbit skeletal myosin with 5 mM NEM at 23 °C for 75 min. The reaction was stopped by the addition of 10 mM DTT and was subjected to exhaustive dialysis against 25 mM KPO4 (pH 6.5), 0.6 M KCl, 1 mM EDTA, and 1 mM DTT to remove excess NEM. NEM-myosin was stored at −80 °C before use. G-actin was purified from rabbit skeletal muscle as described (42). Alexa-488 phalloidin-labeled F-actin was prepared by incubating 0.8 μM G-actin with 0.2 μM Alexa Fluor 488 phalloidin (Invitrogen) and 0.6 μM unlabeled phalloidin (Invitrogen) in 25 mM imidazole (pH 7.5), 100 mM KCl, 2 mM MgCl2, 0.3 mM ATP, and 0.5 mM DTT for 1 h. The labeled F-actin was stored at 4 °C before use.
The MD-IQ1 in complex with Alexa-555–labeled CaM was prepared by exchanging Alexa-555–labeled CaM onto the MD-IQ1 as described (22). Alexa-555–labeled CaM was prepared as follows. CaM-T5C, a CaM mutant created by site-directed mutagenesis, was expressed in Escherichia coli and purified as described (13). The purified CaM-T5C was dialyzed against 25 mM Tris⋅HCl (pH 7.0), 100 mM NaCl, and 2 mM EDTA. To label CaM-T5C, 100 μM CaM-T5C was first incubated with 1 mM TCEP at room temperature for 1 h and then was incubated with 10- to 20-fold molar excess Alexa Fluor 555 C2 maleimide (Invitrogen) at room temperature with rotation for 2 h. The reaction was stopped by the addition of 2 mM DTT, and Alexa-555–labeled CaM was purified by Phenyl-Sepharose chromatography. The labeling efficiency was determined by NanoDrop and SDS/PAGE.
Ca2+ Affinity Measurement.
CaM (15 μM) was incubated with or without the IQ1 (10 μM) at room temperature in a series of standardized Ca2+ buffers prepared according to the Ca2+ calibration kit (Molecular Probes). After incubation for 30 min, the fluorescence was collected on a Multi-Mode microplate reader (SpectraMax i3; Molecular Devices). For IQ1/CaM, a 295-nm excitation wavelength was used, and the emission wavelength was monitored at 320 nm as previously described (24). For CaM, 277 nm was used to excite tyrosine, and the emission wavelength was monitored at 308 nm. The data were normalized and fit to a four-parameter Hill equation using OriginPro9.1 (OriginLab): F = Fmin + (A*[free Ca2+]h)/(Kdh+ [free Ca2+]h) where Fmin is the minimum fluorescence, A is the magnitude of the fluorescence, Kd is the apparent dissociation constant for the Ca2+ binding to IQ1/CaM or CaM, and h is the Hill coefficient.
Emission Spectra Measurement.
CaM (15 μM) and the IQ1 (10 μM) were added to TBS [50 mM Tris⋅HCl (pH 7.5), and 150 mM NaCl] containing 1 mM EGTA. After incubation for 30 min, the emission spectra were collected on a fluorescence spectrometer (F7000; Hitachi). Tryptophan fluorescence was excited at 295 nm using a 5-mm slit, and the emission spectra were collected from 305 to 400 nm as previously described (24). To determine the effect of Ca2+ on the conformation of IQ1/CaM, 1.1 mM CaCl2 was added, and the emission spectra were collected again under the same conditions. The results were analyzed and plotted using KaleidaGraph 4.03 (Synergy Software).
Ca2+ Dissociation Kinetics.
The Myo5a IQ1 peptide (N′-KLRAA CIRIQ KTIRG WLLRK RYL-C′) (>95% pure) was synthesized by GL Biochem Ltd. To remove any possible contaminating small molecules, the IQ1 peptide was dissolved in TBS and centrifuged at 15,700 × g for 10 min. The supernatant of the IQ1 peptide was determined by measuring the absorbance at 280 nm using a molar extinction coefficient of 7,090 L⋅mol−1⋅cm−1. Wild-type CaM and the B12Q mutant were prepared as described (13).
An Applied Photophysics stopped-flow instrument (Leatherhead) with an optical path length of 2 mm was used to measure the rates of Ca2+ dissociation at room temperature. The Quin-2 signal was measured after rapid mixing of 5 μM CaM or CaM-B12Q, 12.5 μM IQ1 peptide, and 37.5 μM Ca2+ in TBS with 375 μM Quin-2 in TBS with a mixing ratio of 4:1. Quin-2 fluorescence was excited at 330 ± 1.5 nm and monitored using a 515-nm long-pass emission filter. Tryptophan fluorescence was measured after rapid mixing of 6.25–25.00 μM CaM or CaM-B12Q, 12.5 μM IQ1 peptide, and 125 μM Ca2+ in TBS with 50 mM EGTA in TBS with a mixing ratio of 4:1. Tryptophan fluorescence was excited at 295 ± 1.5 nm and monitored using a 320-nm long-pass emission filter. The collected data were normalized using minimum–maximum normalization [F′ = (F − Fmin)/(Fmax − Fmin) where Fmin is the minimum fluorescence, and Fmax is the maximum fluorescence]. Ca2+ dissociation rates were derived from the fits of the fluorescence traces to a single- or double-exponential equation using KaleidaGraph (Synergy Software).
Acknowledgments
We thank the Yingfang Liu laboratory (Institute of Biophysics, Chinese Academy of Sciences) for assistance with protein crystallization, the Dongsheng Liu laboratory (Tsinghua University) for assistance with kinetic analysis, and the staff at the Shanghai Synchrotron Radiation Facility for assistance with data collection. This work was supported by National Basic Research Program of China Grants 2013CB932800 and 2012CB114102 and the National Natural Science Foundation of China Grants 31171367 and 31470791 (to X.-d.L.) and by National Natural Science Foundation of China Grants 31325007 and 31430024 (to K.Y.)
Footnotes
The authors declare no conflict of interest.
This article is a PNAS Direct Submission.
Data deposition: Crystallography, atomic coordinates, and structure factors reported in this paper have been deposited in the Protein Data Bank, www.pdb.org (PDB ID code 4ZLK).
This article contains supporting information online at www.pnas.org/lookup/suppl/doi:10.1073/pnas.1607702113/-/DCSupplemental.
References
- 1.Berridge MJ, Lipp P, Bootman MD. The versatility and universality of calcium signalling. Nat Rev Mol Cell Biol. 2000;1(1):11–21. doi: 10.1038/35036035. [DOI] [PubMed] [Google Scholar]
- 2.Babu YS, Bugg CE, Cook WJ. Structure of calmodulin refined at 2.2 A resolution. J Mol Biol. 1988;204(1):191–204. doi: 10.1016/0022-2836(88)90608-0. [DOI] [PubMed] [Google Scholar]
- 3.Barbato G, Ikura M, Kay LE, Pastor RW, Bax A. Backbone dynamics of calmodulin studied by 15N relaxation using inverse detected two-dimensional NMR spectroscopy: The central helix is flexible. Biochemistry. 1992;31(23):5269–5278. doi: 10.1021/bi00138a005. [DOI] [PubMed] [Google Scholar]
- 4.Jurado LA, Chockalingam PS, Jarrett HW. Apocalmodulin. Physiol Rev. 1999;79(3):661–682. doi: 10.1152/physrev.1999.79.3.661. [DOI] [PubMed] [Google Scholar]
- 5.Tidow H, Nissen P. Structural diversity of calmodulin binding to its target sites. FEBS J. 2013;280(21):5551–5565. doi: 10.1111/febs.12296. [DOI] [PubMed] [Google Scholar]
- 6.Reck-Peterson SL, Provance DW, Jr, Mooseker MS, Mercer JA. Class V myosins. Biochim Biophys Acta. 2000;1496(1):36–51. doi: 10.1016/s0167-4889(00)00007-0. [DOI] [PubMed] [Google Scholar]
- 7.Li XD, Mabuchi K, Ikebe R, Ikebe M. Ca2+-induced activation of ATPase activity of myosin Va is accompanied with a large conformational change. Biochem Biophys Res Commun. 2004;315(3):538–545. doi: 10.1016/j.bbrc.2004.01.084. [DOI] [PubMed] [Google Scholar]
- 8.Wang F, et al. Regulated conformation of myosin V. J Biol Chem. 2004;279(4):2333–2336. doi: 10.1074/jbc.C300488200. [DOI] [PubMed] [Google Scholar]
- 9.Krementsov DN, Krementsova EB, Trybus KM. Myosin V: Regulation by calcium, calmodulin, and the tail domain. J Cell Biol. 2004;164(6):877–886. doi: 10.1083/jcb.200310065. [DOI] [PMC free article] [PubMed] [Google Scholar]
- 10.Li XD, Ikebe R, Ikebe M. Activation of myosin Va function by melanophilin, a specific docking partner of myosin Va. J Biol Chem. 2005;280(18):17815–17822. doi: 10.1074/jbc.M413295200. [DOI] [PubMed] [Google Scholar]
- 11.Sckolnick M, Krementsova EB, Warshaw DM, Trybus KM. More than just a cargo adapter, melanophilin prolongs and slows processive runs of myosin Va. J Biol Chem. 2013;288(41):29313–29322. doi: 10.1074/jbc.M113.476929. [DOI] [PMC free article] [PubMed] [Google Scholar]
- 12.Yao LL, et al. Melanophilin stimulates myosin-5a motor function by allosterically inhibiting the interaction between the head and tail of myosin-5a. Sci Rep. 2015;5:10874. doi: 10.1038/srep10874. [DOI] [PMC free article] [PubMed] [Google Scholar]
- 13.Lu Z, et al. Calmodulin bound to the first IQ motif is responsible for calcium-dependent regulation of myosin 5a. J Biol Chem. 2012;287(20):16530–16540. doi: 10.1074/jbc.M112.343079. [DOI] [PMC free article] [PubMed] [Google Scholar]
- 14.Li XD, et al. The globular tail domain puts on the brake to stop the ATPase cycle of myosin Va. Proc Natl Acad Sci USA. 2008;105(4):1140–1145. doi: 10.1073/pnas.0709741105. [DOI] [PMC free article] [PubMed] [Google Scholar]
- 15.Trybus KM, Krementsova E, Freyzon Y. Kinetic characterization of a monomeric unconventional myosin V construct. J Biol Chem. 1999;274(39):27448–27456. doi: 10.1074/jbc.274.39.27448. [DOI] [PubMed] [Google Scholar]
- 16.Homma K, Saito J, Ikebe R, Ikebe M. Ca(2+)-dependent regulation of the motor activity of myosin V. J Biol Chem. 2000;275(44):34766–34771. doi: 10.1074/jbc.M003132200. [DOI] [PubMed] [Google Scholar]
- 17.Houdusse A, et al. Crystal structure of apo-calmodulin bound to the first two IQ motifs of myosin V reveals essential recognition features. Proc Natl Acad Sci USA. 2006;103(51):19326–19331. doi: 10.1073/pnas.0609436103. [DOI] [PMC free article] [PubMed] [Google Scholar]
- 18.Coureux PD, et al. A structural state of the myosin V motor without bound nucleotide. Nature. 2003;425(6956):419–423. doi: 10.1038/nature01927. [DOI] [PubMed] [Google Scholar]
- 19.Coureux PD, Sweeney HL, Houdusse A. Three myosin V structures delineate essential features of chemo-mechanical transduction. EMBO J. 2004;23(23):4527–4537. doi: 10.1038/sj.emboj.7600458. [DOI] [PMC free article] [PubMed] [Google Scholar]
- 20.Koide H, et al. Identification of the single specific IQ motif of myosin V from which calmodulin dissociates in the presence of Ca2+ Biochemistry. 2006;45(38):11598–11604. doi: 10.1021/bi0613877. [DOI] [PubMed] [Google Scholar]
- 21.Martin SR, Bayley PM. Calmodulin bridging of IQ motifs in myosin-V. FEBS Lett. 2004;567(2-3):166–170. doi: 10.1016/j.febslet.2004.04.053. [DOI] [PubMed] [Google Scholar]
- 22.Trivedi DV, et al. Direct measurements of the coordination of lever arm swing and the catalytic cycle in myosin V. Proc Natl Acad Sci USA. 2015;112(47):14593–14598. doi: 10.1073/pnas.1517566112. [DOI] [PMC free article] [PubMed] [Google Scholar]
- 23.Beckingham K. Use of site-directed mutations in the individual Ca2(+)-binding sites of calmodulin to examine Ca2(+)-induced conformational changes. J Biol Chem. 1991;266(10):6027–6030. [PubMed] [Google Scholar]
- 24.Black DJ, et al. Calmodulin interactions with IQ peptides from voltage-dependent calcium channels. Am J Physiol Cell Physiol. 2005;288(3):C669–C676. doi: 10.1152/ajpcell.00191.2004. [DOI] [PubMed] [Google Scholar]
- 25.Theoharis NT, Sorensen BR, Theisen-Toupal J, Shea MA. The neuronal voltage-dependent sodium channel type II IQ motif lowers the calcium affinity of the C-domain of calmodulin. Biochemistry. 2008;47(1):112–123. doi: 10.1021/bi7013129. [DOI] [PubMed] [Google Scholar]
- 26.Wang Z, et al. Myosin Vb mobilizes recycling endosomes and AMPA receptors for postsynaptic plasticity. Cell. 2008;135(3):535–548. doi: 10.1016/j.cell.2008.09.057. [DOI] [PMC free article] [PubMed] [Google Scholar]
- 27.Satoh AK, Li BX, Xia H, Ready DF. Calcium-activated myosin V closes the Drosophila pupil. Curr Biol. 2008;18(13):951–955. doi: 10.1016/j.cub.2008.05.046. [DOI] [PMC free article] [PubMed] [Google Scholar]
- 28.Cheney RE, et al. Brain myosin-V is a two-headed unconventional myosin with motor activity. Cell. 1993;75(1):13–23. doi: 10.1016/S0092-8674(05)80080-7. [DOI] [PubMed] [Google Scholar]
- 29.Nguyen H, Higuchi H. Motility of myosin V regulated by the dissociation of single calmodulin. Nat Struct Mol Biol. 2005;12(2):127–132. doi: 10.1038/nsmb894. [DOI] [PubMed] [Google Scholar]
- 30.Zhang WB, Yao LL, Li XD. The globular tail domain of myosin-5a functions as a dimer in regulating the motor activity. J Biol Chem. 2016;291(26):13571–13579. doi: 10.1074/jbc.M116.724328. [DOI] [PMC free article] [PubMed] [Google Scholar]
- 31.Li XD, Jung HS, Mabuchi K, Craig R, Ikebe M. The globular tail domain of myosin Va functions as an inhibitor of the myosin Va motor. J Biol Chem. 2006;281(31):21789–21798. doi: 10.1074/jbc.M602957200. [DOI] [PubMed] [Google Scholar]
- 32.Otwinowski Z, Minor W. Processing of X-ray diffraction data collected in oscillation mode. Methods Enzymol. 1997;276:307–326. doi: 10.1016/S0076-6879(97)76066-X. [DOI] [PubMed] [Google Scholar]
- 33.McCoy AJ, et al. Phaser crystallographic software. J Appl Cryst. 2007;40(Pt 4):658–674. doi: 10.1107/S0021889807021206. [DOI] [PMC free article] [PubMed] [Google Scholar]
- 34.Emsley P, Cowtan K. Coot: Model-building tools for molecular graphics. Acta Crystallogr D Biol Crystallogr. 2004;60(Pt 12 Pt 1):2126–2132. doi: 10.1107/S0907444904019158. [DOI] [PubMed] [Google Scholar]
- 35.Adams PD, et al. PHENIX: A comprehensive Python-based system for macromolecular structure solution. Acta Crystallogr D Biol Crystallogr. 2010;66(Pt 2):213–221. doi: 10.1107/S0907444909052925. [DOI] [PMC free article] [PubMed] [Google Scholar]
- 36.Lovell SC, et al. Structure validation by Calpha geometry: Phi,psi and Cbeta deviation. Proteins. 2003;50(3):437–450. doi: 10.1002/prot.10286. [DOI] [PubMed] [Google Scholar]
- 37.Wu G, Gao Z, Dong A, Yu S. Calcium-induced changes in calmodulin structural dynamics and thermodynamics. Int J Biol Macromol. 2012;50(4):1011–1017. doi: 10.1016/j.ijbiomac.2012.02.017. [DOI] [PubMed] [Google Scholar]
- 38.Fu C, Zhang J, Zheng Y, Xu H, Yu S. Binding of calmodulin changes the calcineurin regulatory region to a less dynamic conformation. Int J Biol Macromol. 2015;79:235–239. doi: 10.1016/j.ijbiomac.2015.04.069. [DOI] [PubMed] [Google Scholar]
- 39.Wang C, et al. Dynamic tubulation of mitochondria drives mitochondrial network formation. Cell Res. 2015;25(10):1108–1120. doi: 10.1038/cr.2015.89. [DOI] [PMC free article] [PubMed] [Google Scholar]
- 40.Sun Y, et al. Single-molecule stepping and structural dynamics of myosin X. Nat Struct Mol Biol. 2010;17(4):485–491. doi: 10.1038/nsmb.1785. [DOI] [PMC free article] [PubMed] [Google Scholar]
- 41.Kielley WW, Harrington WF. A model for the myosin molecule. Biochim Biophys Acta. 1960;41:401–421. doi: 10.1016/0006-3002(60)90037-8. [DOI] [PubMed] [Google Scholar]
- 42.Pardee JD, Spudich JA. Purification of muscle actin. Methods Cell Biol. 1982;24:271–289. doi: 10.1016/s0091-679x(08)60661-5. [DOI] [PubMed] [Google Scholar]


