Significance
Our study aimed at exploring the intersection of high-fat diet, mucosal immune defenses, and microbiota. It remains unclear how diet imbalance toward excessive fat intake leads to secondary pathological effects on host physiology through the microbiota. We show that a short period of consumption of high-fat diet alters the small-intestinal defenses and that the biochemistry of the ileum is drastically modified, leading to physiological changes close to that observed in cystic fibrosis. We identified peroxisome proliferator-activated receptor-γ as major regulator of mucosal defenses upon exposure to fat excess. As a result, our work provides a fundamental understanding of the underlying cause of severe chronic disorders associated with Western diet.
Keywords: high-fat diet, microbiota, antimicrobial peptides, PPAR-γ, CFTR
Abstract
Diet is among the most important factors contributing to intestinal homeostasis, and basic functions performed by the small intestine need to be tightly preserved to maintain health. Little is known about the direct impact of high-fat (HF) diet on small-intestinal mucosal defenses and spatial distribution of the microbiota during the early phase of its administration. We observed that only 30 d after HF diet initiation, the intervillous zone of the ileum—which is usually described as free of bacteria—became occupied by a dense microbiota. In addition to affecting its spatial distribution, HF diet also drastically affected microbiota composition with a profile characterized by the expansion of Firmicutes (appearance of Erysipelotrichi), Proteobacteria (Desulfovibrionales) and Verrucomicrobia, and decrease of Bacteroidetes (family S24-7) and Candidatus arthromitus. A decrease in antimicrobial peptide expression was predominantly observed in the ileum where bacterial density appeared highest. In addition, HF diet increased intestinal permeability and decreased cystic fibrosis transmembrane conductance regulator (Cftr) and the Na-K-2Cl cotransporter 1 (Nkcc1) gene and protein expressions, leading to a decrease in ileal secretion of chloride, likely responsible for massive alteration in mucus phenotype. This complex phenotype triggered by HF diet at the interface between the microbiota and the mucosal surface was reversed when the diet was switched back to standard composition or when mice were treated for 1 wk with rosiglitazone, a specific agonist of peroxisome proliferator-activated receptor-γ (PPAR-γ). Moreover, weaker expression of antimicrobial peptide-encoding genes and intervillous bacterial colonization were observed in Ppar-γ–deficient mice, highlighting the major role of lipids in modulation of mucosal immune defenses.
Humans coexist with a large number of microorganisms called microbiota. The intestine is populated by more than 100 trillion microbial cells, and the rules of this coexistence need deciphering. These numbers are essentially accounted for by the colon (1). In the small intestine (SI), a gradient of microbial density and community exists from the duodenum, which is relatively poorly populated, to the distal ileum/cecum, which tends to resemble the colon (2, 3). This holobiont has been established by the strong mutual selective pressure of coevolution and its homeostasis is essential to health (4, 5). Changes in diet composition are among the most influential conditions altering this balance, possibly with pathological consequences whose mechanisms can be experimentally addressed in the mouse, which has developed a similar condition of mutualistic symbiosis.
Intestinal epithelial cells (IECs) are on the front line of this confrontation. The SI epithelium is extensively folded into crypts and villi, which increase the surface available for food digestion and nutrient absorption (6). IECs develop an array of strategies to keep these complex and dynamic microbial communities at bay. IECs act as sentinels by expressing a wide range of efficient pattern recognition receptors that control innate defense mechanisms regulating the proximity and composition of the microbiota (7, 8). Other elements of epithelial barrier capacity comprise tight junctions (9, 10) and production/secretion of antimicrobial peptides (AMP) (11, 12). The antibacterial lectin Reg3γ promotes the spatial segregation of microbiota and host in the intestine (13), the secretion and organization of the mucus layer that provides physico-chemical protection and a matrix for secreted antimicrobial molecules (14, 15), and the control of electrolyte balance (16, 17) contribute to this defense. The microbiota itself participates in strengthening mucosal defenses by stimulating epithelial renewal (18–20), production of AMP (21), cytoprotection against xenobiotics (22, 23), immune maturation, increase of intestinal impermeability (24), and modulation of mucus quality and penetrability (25). Hence, the direct engagement of the intestinal epithelium by the microbiota remains rare and limited because most of the commensal bacteria are kept at respectable distance. Highly efficient strategies of bacterial sequestration are deployed in the SI (26, 27), likely to preserve its key nutritional functions, whereas the colon can allow closer bacterial colonization. Indeed, bacteria could be detected in murine colonic crypts, whereas in healthy conditions they could not be detected in SI crypts (28).
High dietary fat intake is often associated with modification of the intestinal microbiota (dysbiosis), characterized by low diversity and a shift in community composition with higher proportion of Firmicutes (29). Indeed, dietary fat accounts for food imbalance, leading to obesity, and various mouse models point to gut dysbiosis as a contributing factor to obesity (30–32) and type 2 diabetes (33, 34). More recently, metagenomic analysis has shown that a dysbiotic human fecal microbiota was associated with obesity, diabetes, and metabolic syndrome (35). Fat excess is likely to account in part for the dysbiotic state, although a direct role for high dietary fat intake in driving the composition of the gut microbiota and the mechanisms leading to metabolic alterations are still debated (35). High-fat (HF) diet is believed to directly influence the assembly of an alternative microbiota with increased energy-harvesting capacity (36, 37). Furthermore, insulin resistance, which is associated with obesity, is considered the result of chronic low-grade inflammation of the tissues caused by transepithelial translocation of enteric bacteria or bacterial products through a failing epithelial barrier (38, 39). Taken together, these findings suggest that a fat-enriched diet is central to the loss of epithelial barrier integrity, which in turn directly or indirectly affects the microbiota, causing a dysbiosis that further alters epithelial homeostasis. Several studies have addressed the long-term effects of HF diet in such pathologies (40–42). Interestingly, most studies have characterized the fecal or cecal luminal microbiota; however, very few have attempted to characterize the mucosa-associated microbiota in the upper digestive segments, even though basic functions performed by the SI need to be tightly preserved to maintain health. As a consequence, the direct impact of HF diet initiation on SI mucosal defenses, or on the spatial distribution of the SI microbiota, remain poorly characterized and very few studies have attempted to describe the simultaneous impacts of a HF diet on IECs and on microbiota before the development of metabolic diseases (43, 44).
Hence, the present study addressed these effects on the mouse SI of short-term administration (30 d; i.e., before diabetes or obesity development) of a HF diet. To this purpose we aim to characterize the physiological changes occurring at the interface of the microbiota and the mucosal surface and to decipher the molecular signals accounting for these deleterious effects. We proposed an integrated process, shedding new light on the relationship between HF diet, the microbiota, and the physiological defense processes by analyzing the microbiota composition of the intervillous and luminal section of the ileum using laser-capture microdissection (LCM) coupled to 16S rRNA gene sequencing, as well as the spatial distribution of the microbiota using FISH. We correlated the expression of host mucosal defense genes [AMP, cystic fibrosis transmembrane conductance regulator (Cftr) and the Na-K-2Cl cotransporter 1 (Nkcc1) genes] and the peroxisome proliferator-activated receptor (Ppar)-γ, a nuclear receptor that plays a major role in regulating lipid metabolism (45), assessed by quantitative RT-PCR (RT-qPCR) to the microbiota changes upon HF diet administration. Electrogenic activities reflecting the secretion of Cl− and HCO3− on the luminal side of the ileal mucosal and the intestinal permeability were functionally validated in Ussing chambers. Our results showed that 30 d after feeding a HF diet, the SI microbiota colonized the intervillous zone usually considered germ-free. This massive spatial redistribution was accompanied by a drastic change in composition of the microbiota. A decrease in AMP gene expression was concurrently observed. The impact of HF diet was predominant in the ileum, where it led to increased permeability and decreased expression of Cftr and Nkcc1 genes, leading to a decrease in ileal secretion of electrolytes. These defects were associated with major alterations in mucus layer phenotype. Moreover, we showed that stimulation of PPAR-γ led to restoration of Cftr, AMP gene-expression levels, and the spatial distribution of the microbiota, whereas in Ppar-γ–deficient mice bacteria colonized the ileal intervillous space and decreased AMP expression. Taken together, these results indicate that PPAR-γ is a key regulator of the observed early effects of HF diet.
Results
One Month of HF Diet Consumption Did Not Induce Metabolic Changes in Mice.
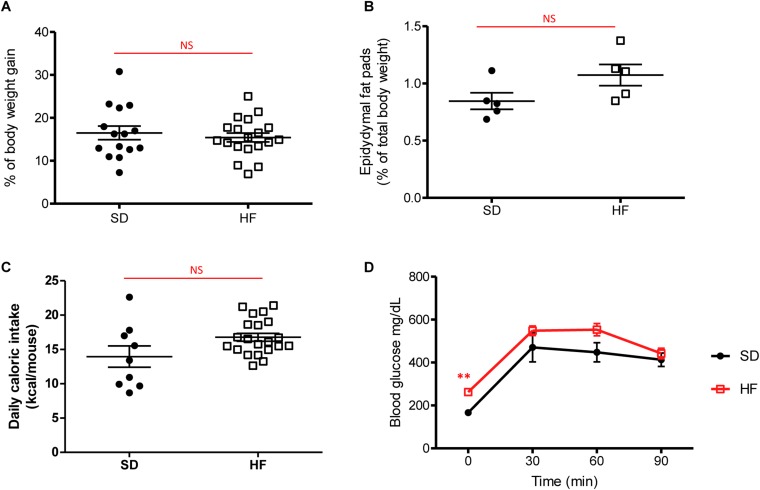
Following 30 d of HF diet, we analyzed global weight, epididymal fat pads as marker of obesity, daily caloric intake, and glucose uptake. Body weight, epididymal fat pads, and daily caloric intake were not significantly higher in HF-fed mice, compared with mice fed a standard diet (SD-fed mice) (Fig. S1 A–C). As shown in Fig. S1D, HF feeding did not induce glucose intolerance after 4 wk. Blood glucose concentration in HF-fed mice was only significantly higher than that of SD-fed mice at time 0, whereas during glucose challenge blood glucose concentrations were not significantly different.
Fig. S1.
Metabolic parameters after 1 mo of diet. (A) Body weight gain (%) in mice fed SD and HF diet for 4 wk. (B) Epidydymal fat pads (percent of total body weight) in SD-fed and HF-fed mice for 4 wk. (C) Daily food intake (kilocalories per mouse) in SD-fed and HF-fed mice for 4 wk. (D) Plasma glucose (mg/dL) after an oral glucose load (1 g/kg in 0.9% NaCl) in SD-fed and HF-fed mice for 4 wk. All values are means ± SEM. Means with asterisks are significantly different from values of SD-fed mice (**P < 0.01). NS, not significant.
HF Diet Rapidly Alters the Spatial Distribution and Composition of the Microbiota.
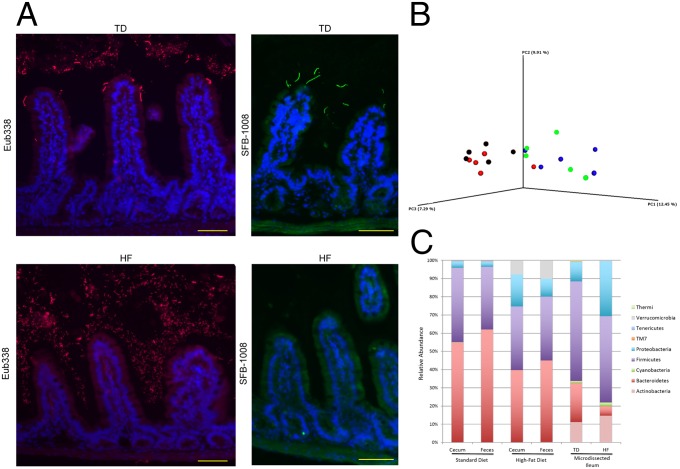
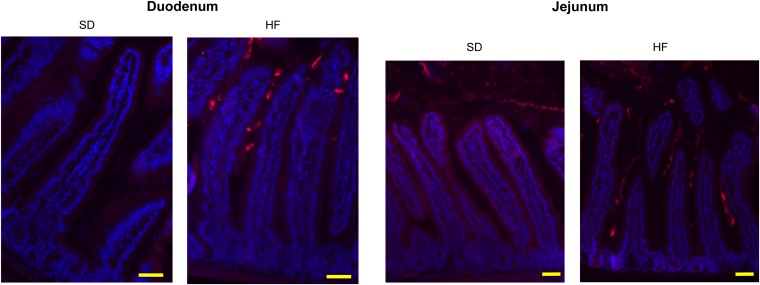
Following 30 d of HF diet, we analyzed the spatial distribution of the microbiota in the duodenum, jejunum, and ileum of mice by the FISH technique, using universal probes targeting the 16S rRNA gene. We observed a higher bacterial density in the lumen of the duodenum, jejunum, and ileum segments in HF-fed mice compared with SD-fed mice (Fig. 1A and Fig. S2). Moreover, the spatial distribution was drastically changed and characterized by bacterial colonization of the intervillous space in HF-fed mice, predominantly in the ileum (Fig. 1A and Fig. S2). FISH quantification revealed an increase by 42.5% of fluorescence intensity in HF-fed mice, compared with SD-fed mice in the lumen and in the intervilli zone. Interestingly, segmented filamentous bacteria (SFB) could be visualized at the top of the villi in the ileum of SD-fed mice but not in HF-fed mice (Fig. 1A).
Fig. 1.
HF diet shapes the spatial segregation and the composition of intestinal microbiota. (A) Representative photographs of FISH analyses with the pan-bacterial probe Eub338 (red) and the SFB-1008 probe (green) in ileum sections of SD- and HF-fed mice. Nuclei stained with DAPI (blue). (Scale bar, 50 μm.) (B) PCoA plot showing microbiota communities cluster with diet determined by unweighted UniFrac analysis. SD cecum (blue), SD feces (green), HF cecum (black), HF feces (red). (C) Average relative abundance at phylum level in cecal and fecal contents, and in microdissected ileum content of SD- and HF-fed mice.
Fig. S2.
HF diet shapes the spatial segregation and the composition of intestinal microbiota. Representative photographs of FISH analyses with the pan-bacterial probe Eub338 (red) in unwashed duodenum and jejunum sections of SD- and HF-fed mice. Nuclei stained with DAPI (blue). (Scale bars, 50 μm.)
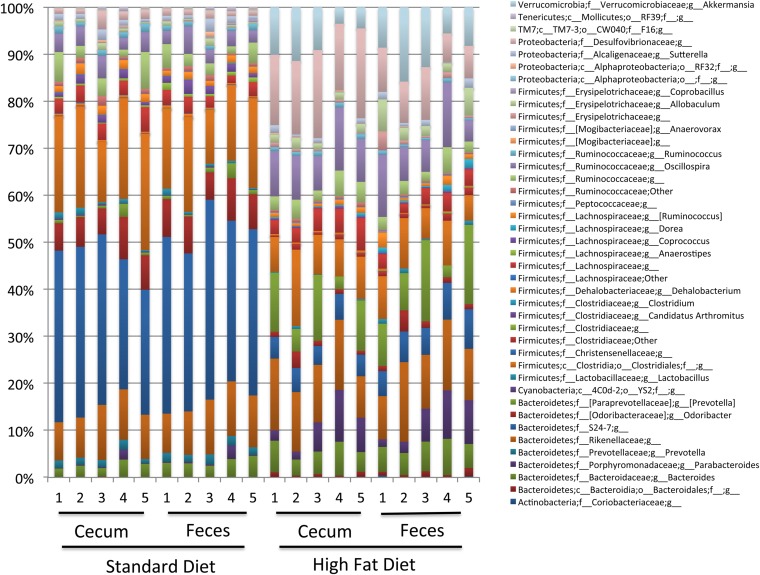
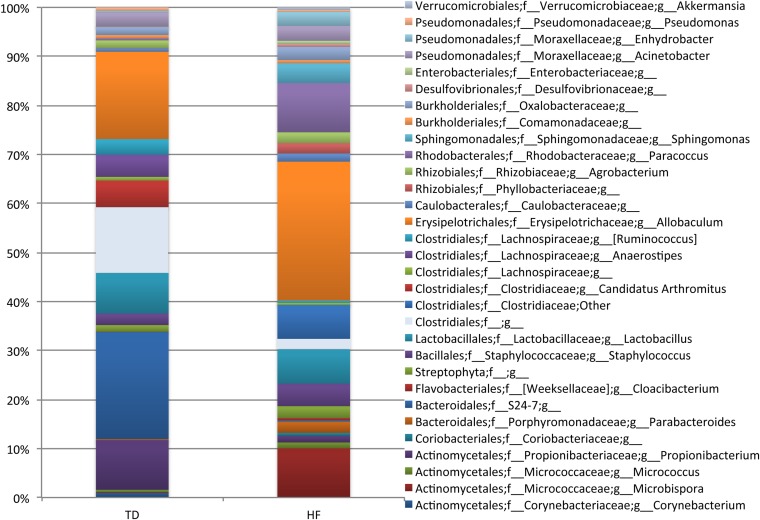
To analyze if these changes in spatial distribution of bacteria were associated with a change in microbiota composition, we performed 16S rRNA gene sequencing of the fecal and cecal contents, and of laser-microdissected intervilli and luminal sections of the ileum. Sequence analysis of the V3-V4 hypervariable regions of the 16S rRNA gene showed that in addition to changes in spatial distribution, the microbiota composition was considerably altered after 30 d of HF diet, compared with SD, as shown by principal coordinates analysis (PCoA) clustering of the different fecal and cecal microbial communities (Fig. 1B). No significant difference in composition was observed between fecal and cecal microbiota of mice fed with a similar diet (Fig. 1B and Fig. S3). At the phylum and family levels, the relative abundance of Bacteroidetes (mainly S24-7 family) was statistically significantly lower in HF-fed mice (i.e., 39.68% ± 4.06% and 44.88% ± 5.62%, respectively, in the cecal and fecal microbiota), compared with SD-fed mice (i.e., 54.76% ± 2.85% and 61.86% ± 3.51%, respectively, in the cecal and fecal microbiota), with a Kruskall–Wallis test, P < 0.05 (Fig. 1C and Figs. S3–S5). Conversely, the relative abundance of Proteobacteria was significantly higher in HF-fed mice (17.58% ± 1.98% and 9.74% ± 1.71%, respectively, in the cecal and fecal microbiota) compared with SD-fed mice (3.54% ± 1.30% and 2.96% ± 1.06%, respectively, in the cecal and fecal microbiota), with a Kruskall–Wallis, P < 0.05 (Fig. 1C and Figs. S3–S5). In Proteobacteria, we observed a major increase in Deltaproteobacteria (Desulfovibrionales order/Desulfovibrionaceae family) (Fig. S3). Concomitantly, members of the Verrucomicrobia (mostly Akkermansia genus) were observed in cecal and fecal contents of HF-fed mice (i.e., 10.16% ± 3.27% and 7.72% ± 2.98%, respectively, in cecal and fecal microbiota, with a Kruskall–Wallis test, P < 0.05), whereas they remained undetectable in SD-fed mice (Fig. 1C and Fig. S3). Among the Firmicutes, we observed a lower relative abundance in Clostridia and the presence of Erysipelotrichi in both cecal and fecal contents of HF-fed mice (Fig. S3) (Kruskall–Wallis test P < 0.05). In microdissected samples of the ileum, the microbiota contained a lower relative abundance of Bacteroidetes (S24-7 family) in HF-fed mice (i.e., 21.22% ± 13.62% and 5.14 ± 4.45%, respectively, in SD-fed mice and in HF-fed mice, with a Kruskall–Wallis test, P < 0.05) (Fig. 1C). This lower relative abundance was accompanied with a lower abundance in Clostridia and a higher abundance in Erysipelotrichi (Allobaculum) in HF-fed mice, similar to the findings obtained with fecal and cecal microbiota (Fig. S4). Moreover the absence of SFB (Candidatus arthromitus) in the ileum of HF-fed mice (4.98% ± 3.50% in SD-fed mice vs. undetectable in HF-fed mice) confirmed FISH analysis (Fig. 1A and Fig. S4).
Fig. S3.
HF diet modifies the genus microbiota composition in cecal and fecal contents. Individual relative abundance at genus level in cecal and fecal contents of SD- and HF-fed mice (n = 5).
Fig. S5.
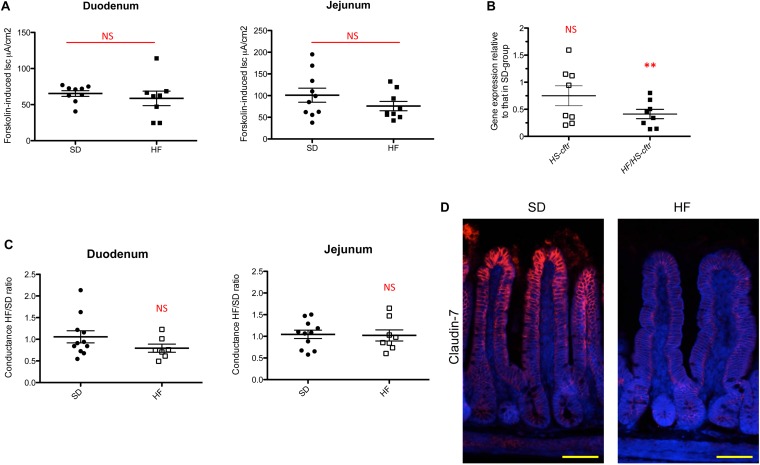
HF diet alters specifically the ileal Cftr chloride secretion pathway. (A) Measurement in Ussing chamber of the short-circuit current increase (Forskolin-induced Isc, μA/cm2) after serosal challenging of duodenum and jejunum tissues with 10 µmol/L forskolin (n = 8–9 per group). NS, not significant. (B) Gene expression relative of Cftr from HS and HF/HS diets (n = 8 per group) compared with SD-fed mice in ileum. Results were normalized to those for the Gapdh gene expression. All values are means ± SEM (**P < 0.01); NS, not significant. (C) Tissue conductance measurements in duodenum and jejunum (n = 7–11 per group). Conductance was studied in Ussing chamber after 30 min (HF/TD ratio). Values are expressed as a ratio of HF-fed mice values compared with SD-fed mice. NS, not significant. (D) Representative photographs of immunofluorescence staining of claudin-7 protein in unwashed ileum sections of SD- and HF-fed mice. Nuclei stained with DAPI (blue). (Scale bars, 50 μm.)
Fig. S4.
HF diet modifies the microbiota composition in LCM ileum. Average relative abundance at genus level in microdissected ileum content of SD- and HF-fed mice (n = 5).
HF Diet Differentially Alters AMP Gene Expression in the Duodenum, Jejunum, and Ileum.
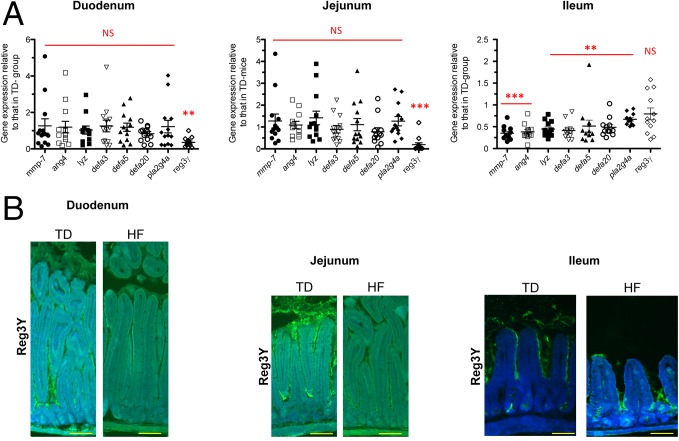
AMP gene expression was analyzed by RT-qPCR following 30 d of HF diet consumption (Dataset S1). Interestingly, in HF-fed mice, AMP gene expression was significantly different in the duodenum and jejunum, compared with the ileum (Fig. 2A). Whereas Reg3γ was down-regulated by 2.8- and 5.2-fold, respectively, in the duodenum and jejunum in HF-fed mice compared with SD-fed mice, its expression remained unchanged in the ileum (Fig. 2A). Moreover quantification of the immunofluorescence staining intensity of Reg3γ showed a significant decrease by 43% and 34% in the duodenum and jejunum, respectively, whereas it remained unchanged in the ileum (Fig. 2B). Interestingly, Mmp-7, the gene encoding the matrix metalloproteinase-7 and responsible for the maturation of AMP, was down-regulated 2.84-fold in the ileum of HF-fed mice compared with SD-fed mice (Fig. 2A). Moreover, the down-regulation range of Mmp-7 corresponded to the ranges of down-regulation of all AMP genes tested in the ileum, namely angiogenin-4, lysozyme, α-defensin-3, -5, and -20, and phospholipase A2 (Fig. 2A). These results show that the upper and the lower segments of the SI differentially modulate AMP expression in response to HF diet, but in both cases it indicates a global decrease in mucosal defenses.
Fig. 2.
HF diet alters differently AMP gene expression in duodenum, jejunum, and ileum. (A) Gene expression relative to AMP genes from HF-fed mice compared with SD-fed mice in duodenum, jejunum, and ileum (n = 10–12 per group). Results were normalized to those for the Gapdh gene expression. All values are means ± SEM. Means with asterisks are significantly different from values of SD-fed mice (**P < 0.01, ***P < 0.001). NS, not significant. (B) Representative photographs of immunofluorescence staining of Reg3γ protein (green) in unwashed duodenum, jejunum, and ileum sections of SD- and HF-fed mice. Nuclei stained with DAPI (blue). (Scale bars, 50 μm.)
HF Diet Alters the Functional Integrity of the ileum via CFTR Dysfunction.
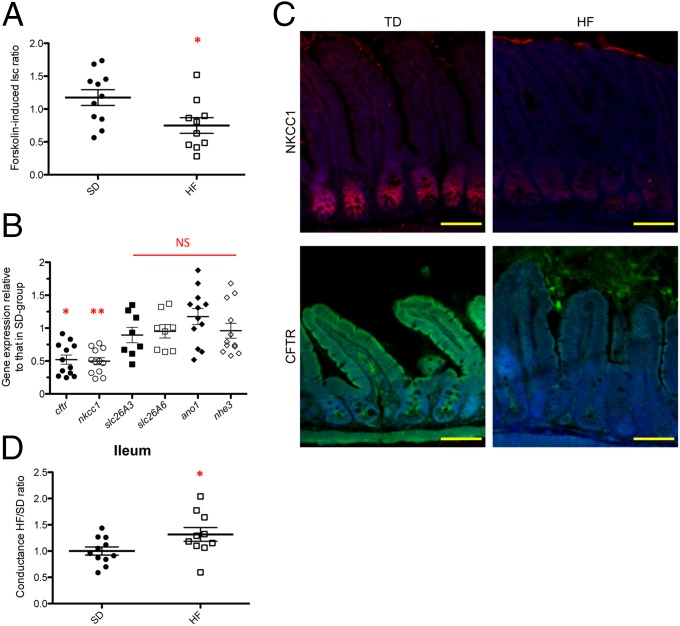
The intestine functions as a secretory and absorptive organ maintaining the homeostatic control of electrolytes and fluid balance that impact on mucosal defenses and the characteristics of the intestinal microbiota (16, 17). Intestinal secretion mainly results from the active transport of Cl− and HCO3− (46). The CFTR, a cAMP-activated epithelial Cl− and HCO3− channel (47), plays a pivotal role in the regulation of epithelial secretion in the SI (48) and its dysfunction allows abnormal bacterial colonization (49, 50). Forskolin, an activator of adenylate cyclase, activates CFTR, and deletion of the Cftr gene abolishes its effect on epithelial Cl− and HCO3− (51, 52). We examined electrogenic activities reflecting the secretion of Cl− and HCO3− on the luminal side of the ileal mucosa in HF-fed mice and in SD-fed mice using Ussing chambers (53). Forskolin-induced Cl− and HCO3− secretion (Isc ratio) was 37% lower in the distal ileum of HF-fed mice than in SD-fed mice (Fig. 3A). Accordingly, Cftr was transcriptionally down-regulated by 2.0-fold and found at a 53% lower level by immunofluorescence staining in the ileum of HF-fed mice (P < 0.05) (Fig. 3 B and C). Gene expression of other major ionic transporters [i.e., solute carrier family 26, member 3 and member 6 (Slc26A3, Slc26A6), anoctamin-1 (Ano1), and sodium–hydrogen exchanger 3 (Nhe3)] was not significantly modified in HF-fed mice, compared with SD-fed mice (Fig. 3B). Intestinal capacity to secrete Cl− is also dependent on NKCC1, which mediates Cl− uptake from the basolateral pole of IECs, thereby providing Cl− for apical secretion via CFTR (48). Interestingly, Nkcc1 was concomitantly transcriptionally down-regulated by 2.0-fold and at a 30% lower level by immunofluorescence staining in HF-fed mice (P < 0.05) (Fig. 3 B and C). No significant change in forskolin-induced Cl− and HCO3− secretion was observed in the duodenum and jejunum, as indicated by ΔIsc measurement (Fig. S5A). We thus concluded that HF diet rapidly affected the Cl− secretagogue pathway in the ileum via its down-regulation of NKCC1 and CFTR functions, both by a decrease in gene and protein expressions. In addition, under high-fat/high-sugar (HF/HS) diet, a 2.42-fold lower level in Cftr gene expression was obtained, whereas it was not changed in HS diet alone (Fig. S5B), indicating that HF alone accounted for the down-regulatory effect.
Fig. 3.
HF diet alters ileal permeability and affects the Cftr chloride secretion pathway. (A) Measurement in Ussing chamber of the increase in short-circuit current (ΔIsc, μA/cm2) induced after serosal challenging of ileum tissue with 10 µmol/L forskolin. Values are expressed as a ratio of HF-fed mice values compared with SD-fed mice (Forskolin-induced Isc ratio). (B) Gene expression relative of electrolyte transporters genes from HF-fed mice compared with SD-fed mice in ileum (n = 8–11). Results were normalized to those for the Gapdh gene expression. All values are means ± SEM. (C) Representative photographs of immunofluorescence staining of CFTR (green) and NKCC1 (red) proteins in unwashed ileum sections of HF- and SD-fed mice. Nuclei stained with DAPI (blue). (Scale bars, 50 μm.) (D) Tissue conductance measurements in duodenum, jejunum and ileum (n = 7–11 per group). Conductance was studied in Ussing chamber after 30 min (HF/TD ratio). Values are expressed as a ratio of HF-fed mice values compared with SD-fed mice. Means with asterisks are significantly different from values of SD-fed mice (*P < 0.05, **P < 0.01). NS, not significant.
HF Diet Alters the Physical Integrity of the Ileal Barrier.
To know if the above functional modifications observed in response to HF-diet resulted in rupture of the physical integrity of the epithelial barrier, we examined the ionic conductance of SI segments in HF- and SD-fed mice. Indeed, in the intestine, the paracellular pathway accounts for at least 90% of the total transepithelial ionic conductance as measured in Ussing chambers (53). In the duodenum and jejunum, the measured ionic conductance remained unchanged between HF-fed and SD-fed mice (Fig. S5C). In contrast, a 30% increase in transepithelial conductance was measured in the distal ileum of HF-fed mice (Fig. 3D), indicating that the paracellular pathway was impaired. Because tight junction proteins play a major role in gating the paracellular pathway, we analyzed the level and localization of claudin-7 as a proxy for epithelial permeability; it was found in lower amount along the ileal villi in HF-fed mice, compared with SD-fed mice (Fig. S5D), confirming a significant alteration of ileal permeability, both at the functional and molecular levels.
HF Diet Alters the Mucus Layer in the Ileum.
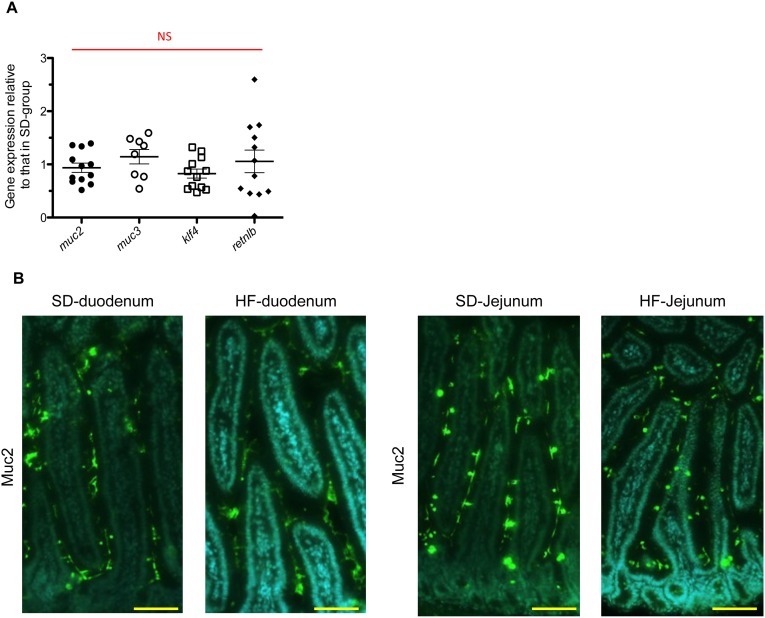
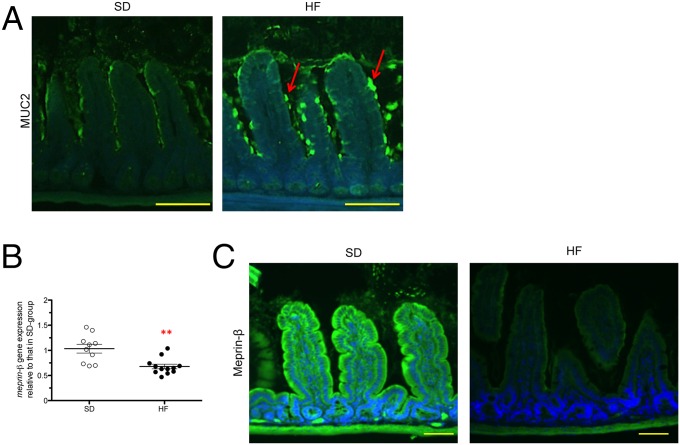
We quantified ileal gene expression of Klf4, Muc2, Muc3, and Retnlß by RT-qPCR. No significant differences were observed between HF-fed mice and SD-fed mice (Fig. S6A). Mucin (MUC) secretion, folding, and assembly require an optimal biochemical milieu (54–56). In the duodenum and jejunum segments, where electrogenic activities were not altered, we did not observe any difference in MUC2 staining between HF-fed mice and SD-fed mice (Fig. S6B). However, we observed the retention of MUC2 proteins in goblet cells, forming ball-shaped cells with fluorescence intensity 45% higher in the ileum of HF-fed mice (Fig. 4A). Consistent with these findings, Meprin-β, a metalloendopeptidase involved in the detachment and release of mucus from goblet cells (57), was transcriptionally down-regulated and present at lower amount in ileal tissues of HF-fed mice (Fig. 4 B and C).
Fig. S6.
HF diet alters the mucus secretion pathway in ileum but not in duodenum and jejunum. (A) Gene-expression relative of mucus from HF-fed mice compared with SD-fed mice in ileum (n = 7–12). Results were normalized to those for the Gapdh gene expression. All values are means ± SEM. NS, not significant. (B) Representative photographs of immunofluorescence staining of MUC2 protein in unwashed and Carnoy fixed duodenum and jejunum sections in SD-fed mice and in HF-fed mice. (Scale bars, 50 µm.)
Fig. 4.
HF diet alters the mucus secretion pathway in ileum. (A) Representative photographs of immunofluorescence staining of MUC2 protein in unwashed and Carnoy fixed ileum sections. The red arrows indicate accumulation of MUC2 at the surface of the goblet cells. (Scale bars, 50 µm.) (B) Gene expression relative to Meprin-β from HF-fed mice compared with SD-fed mice in ileum (n = 8–11). Results were normalized to those for the Gapdh gene expression. All values are means ± SEM. (**P < 0.01) (C) Representative photographs of immunofluorescence staining of Meprin-β in unwashed and Carnoy fixed ileum sections of SD- and HF-fed mice. (Scale bars, 50 µm.) Means with asterisks are significantly different from values of SD-fed mice.
Shift to SD After 30 d of HF Diet Reverses the Observed Phenotypes.
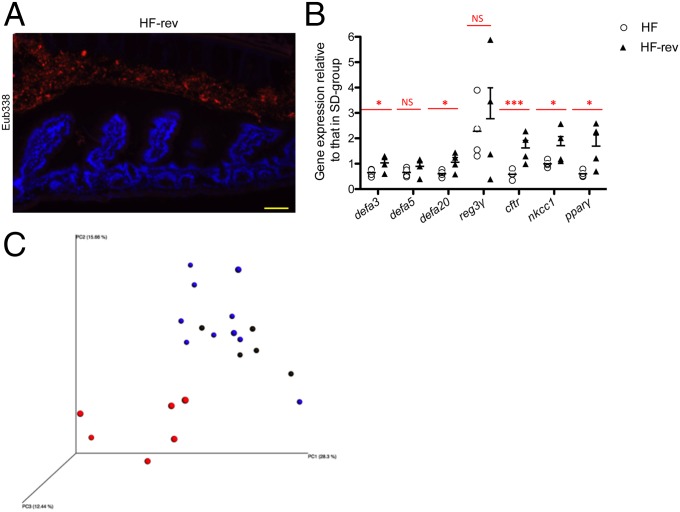
After 30 d on HF diet, mice were returned to SD for 30 d (HF-rev mice) and re-evaluated in comparison with littermates kept for 2 mo under an HF-diet. We observed a restoration of the spatial distribution of the microbiota in the ileum of HF-rev mice as observed in SD-fed mice (Fig. 5A). The ileal gene-expression pattern of HF-rev mice showed that the shift to SD allowed gene expression of Cftr and Ppar-γ to return to the values previously observed in SD-fed mice (Fig. 5B). Moreover, analysis of the microbiota composition of HF-rev mice showed that the bacterial relative abundance returned to levels similar to those observed in SD-fed mice, as shown by the PCoA clustering (Fig. 5C and Dataset S1). At the phylum and family levels, the relative abundance of Bacteroidetes (S24-7 family), Verrucomicrobia, and Desulfovibrionales was similar to those of SD-fed mice (Dataset S1).
Fig. 5.
Reversing from the HF diet to the SD corrects the bacterial spatial segregation and recovers the expression of the AMP Cftr and Ppar-γ genes. (A) Representative photographs of FISH analyses with the pan-bacterial probe Eub338 (red) in ileum sections of mice switched from HF diet to SD for 30 d. Nuclei stained with DAPI (blue). (Scale bar, 50 μm.) (B) Graphs showed the gene expression relative to AMP and electrolytes transporters of HF-fed mice vs. HF-fed mice for 2 mo and HF-rev mice vs. HF-fed mice for 2 mo compared with SD-fed mice in the ileum (n = 4). Results were normalized to those for the Gapdh gene expression. All values are means ± SEM. Means with stars are significantly different from values of SD-fed mice (*P < 0.05, ***P < 0.001). NS, not significant. (C) PCoA plot showing microbiota communities cluster in feces of mice determined by unweighted UniFrac analysis. SD-fed mice (blue), HF-fed mice (red), and HF-rev mice (black).
Dysregulation of the PPAR-γ Pathway by HF Diet Accounts for Alteration of Cftr and AMP Gene Expression.
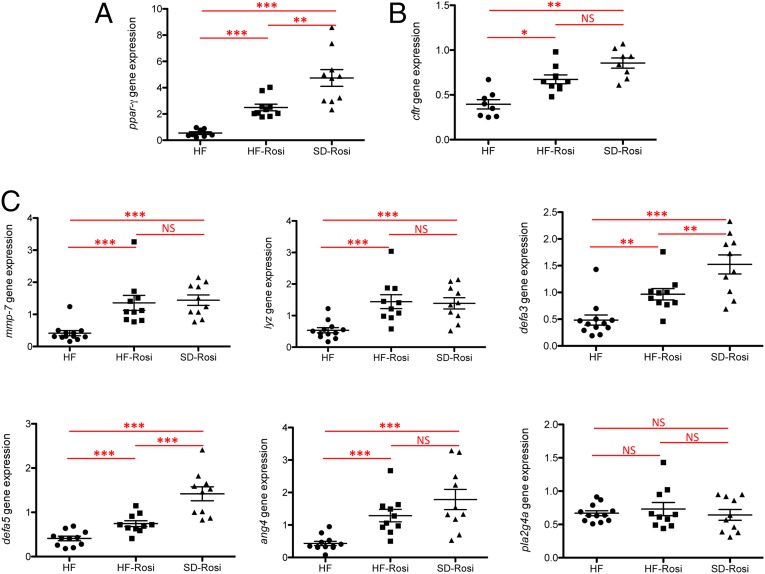
PPAR-γ acts as a main lipid sensor in the SI. It has previously been shown to be a major regulator of mucosal defenses (58, 59). We observed that HF diet down-regulated Ppar-γ gene expression by 1.84-fold (Fig. 6A). To evaluate the involvement of PPAR-γ in the observed phenotypes, SD- and HF-fed mice were treated for 1 wk with rosiglitazone (SD-rosi and HF-rosi), a specific PPAR-γ agonist. This treatment stimulated the expression of Ppar-γ in SD- and HF-fed mice (Fig. 6A). Interestingly, rosiglitazone corrected Cftr (Fig. 6B), Mmp-7, and concomitantly some of the AMP gene-expression levels (i.e., lysozyme, α-defensin-3, -5, and angiogenin-4) in HF-fed mice, reaching the values observed in SD-fed mice (Fig. 6C), thus indicating a crucial role for PPAR-γ in HF-diet–induced homeostatic disruption in the ileum.
Fig. 6.
Ppar-γ pathway regulates the expression of AMP and Cftr and activation by rosiglitazone corrects the HF-diet effects in the ileum. (A) Gene expression relative of Ppar-γ in the ileum (n = 8–11). HF-rosi and SD-rosi are mice treated with rosiglitazone for 1 wk. Results were normalized to those for the Gapdh gene expression. (B) Gene expression relative of Cftr in ileum (n = 8–10 per group). Results were normalized to those for the Gapdh gene expression (C) Gene expression relative of AMP in the ileum (n = 8–10 per group). Results were normalized to those for the Gapdh gene expression and compared with the mean target gene expression in SD mice. All values are means ± SEM. Means with asterisks are significantly different from values of SD-fed mice following one-way ANOVA test (*P < 0.05, **P < 0.01, ***P < 0.001). NS, not significant.
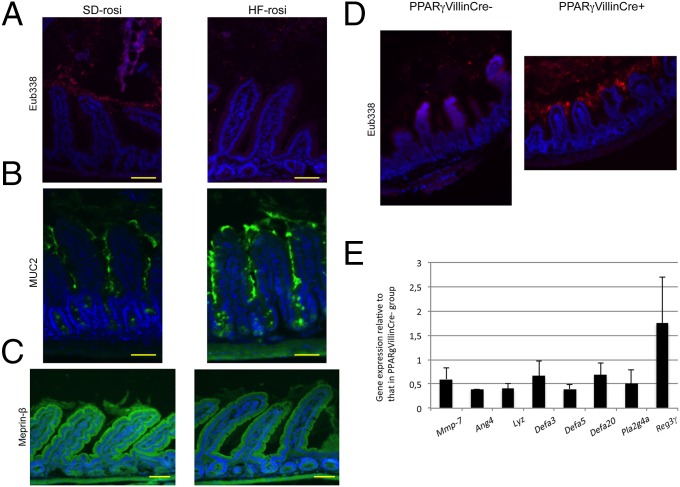
We then analyzed the spatial distribution of the microbiota in the ileum of SD-rosi and HF-rosi mice by the FISH technique, using universal probes targeting the 16S rRNA gene. We observed a higher bacterial density in the lumen of the ileum in SD-rosi mice compared with HF-rosi mice (Fig. 7A). The spatial distribution was drastically changed in HF-rosi mice, compared with HF-fed mice (Figs. 1A and 7A) and characterized by lower bacterial colonization of the intervillous space in HF-rosi mice (Fig. 7A). Moreover, we analyzed MUC2 staining in SD-rosi and HF-rosi mice and observed an intermediate phenotype in the ileum of HF-rosi mice characterized by a loss of retention of MUC2 proteins in goblet cells that formed ball-shaped cells with a sticky mucus layer that seemed to accumulate at the surface of the epithelium, as confirmed by a 48% increase in fluorescence intensity (Fig. 7B). If the staining of Meprin-β in HF-rosi mice did not reach the level of SD-rosi mice (Fig. 7C), it appeared stronger than that of HF-fed mice (Fig. 4C). Concerning the microbiota composition, treatment with rosiglitazone did not restore the microbiota composition of HF-fed mice to that of SD-fed mice, as the relative abundance of the main bacterial families in HF-fed mice and HF-rosi mice remained very similar. For example, the relative abundance of the S24-7 family, which was 36.54% ± 3.59% in the feces of SD-fed mice and 6.74% ± 1.33% in HF-fed mice, reached 11.21% ± 5.32% in HF-rosi mice (Dataset S1).
Fig. 7.
Rosiglitazone restores the spatial distribution of the microbiota in the ileum. (A) Representative photographs of FISH analyses with the pan-bacterial probe Eub338 (red) in ileum sections of SD-rosi and HF-rosi mice. Nuclei stained with DAPI (blue). (Scale bars, 50 μm.) (B) Representative photographs of immunofluorescence staining of MUC2 protein in ileum sections of SD-rosi and HF-rosi mice. (Scale bars, 50 µm.) (C) Representative photographs of immunofluorescence staining of Meprin-β in ileum sections of SD-rosi and HF-rosi mice. (Scale bars, 50 µm.) (D) Representative photographs of FISH analyses with the pan-bacterial probe Eub338 (red) in ileum sections of PPAR-γVillinCre+ mice under SD feeding, and their littermate control mice PPAR-γVillinCre− mice under SD feeding. Nuclei stained with DAPI (blue). (Magnification: 100×.) (E) Gene expression level of PPAR-γVillinCre+ mice mice under SD feeding compared with PPAR-γVillinCre− mice under SD feeding in the ileum. Results were normalized to those for the Gapdh gene expression. All values are means ± SEM.
To validate the involvement of PPAR-γ in both spatial distribution of bacteria and AMP gene expression, experiments were performed with PPAR-γVillinCre+ mice and their littermate controls, PPAR-γ VillinCre− mice, both fed with SD. As observed in HF-fed mice, bacteria could colonize the intervillous space of the ileum of PPAR-γ VillinCre+, whereas this space remained bacteria-free in the PPAR-γ VillinCre− mice (Fig. 7D). Moreover, in comparison with control PPAR-γ VillinCre− mice, expression of the genes encoding angiogenin-4, lysozyme, α-defensin-3, -5, and -20, and phospholipase A2 was down-regulated in the ileum of PPAR-γ VillinCre+ mice (Fig. 7E). Taken together these data confirm the key role of PPAR-γ in the control of AMP expression and on the spatial distribution of bacteria in the ileum.
Discussion
Most studies on the effect of HF diet have considered the impact of long-term exposure on the microbiota–epithelial interface. They have shown that HF diet deregulates mucosal inflammation and causes metabolic disorders, leading to obesity and type 2 diabetes. In contrast, this study aimed to identify the simultaneous consequences of short-term administration of HF diet on SI microbiota and intestinal physiology, and thus to decipher the molecular cross-talk programming the later-observed phenotypes.
We identified the dysregulation of PPAR-γ, CFTR, and AMP after 4 wk of HF diet. Expression of the Ppar-γ, Cftr, and several AMP genes was down-regulated in the SI of HF-fed mice and their expression returned to a standard level when mice were treated with rosiglitazone, a specific agonist of PPAR-γ, indicating a key role of PPAR-γ. To our knowledge, a link between HF diet and these three components had not been described before in the intestinal epithelium. Here, treatment with rosiglitazone, which stimulates PPAR-γ functions, leads to an improved phenotype in HF-fed mice, indicating that in the SI, HF diet impairs PPAR-γ and as a consequence impairs metabolic adaptation, even if the mouse SI can adapt its lipid absorption capacity to fat content of the diet (44). Moreover, the impact of fat was also demonstrated when the diet was switched from HF to SD, reverting AMP, Cftr, and Ppar-γ gene expression to the levels observed in SD-fed mice, as well as the spatial segregation of the microbiota.
Furthermore, we have shown that HF diet or HF combined with HS, but not HS diet alone, was capable to down-regulate Cftr expression, supporting a direct role of fat in the connection between PPAR-γ and CFTR. Previous studies have showed that in mouse models of cystic fibrosis, the lack of CFTR functionality is correlated to Ppar-γ down-regulation and its decreased activity, leading to steatorrhea (59–61). Interestingly, in Cftr−/− mice, Ppar-γ is down-regulated and when mice are treated with rosiglitazone, effects of the CFTR defect (i.e., mucus accumulation) disappeared in Cftr−/− Ppar-γIEC+/+ mice but not in Cftr−/− Ppar-γIEC−/− mice, demonstrating a PPAR-γ–dependent pathway for mucus formation in this model (59). In HF-fed mice, we observed that MUC2 accumulated at the apical side of goblet cells, leading to a ball-shaped and “sticky” aspect of the mucus in the ileum, reflecting considerable reduction in the expansion capacity of the mucins, thus strongly altering the phenotype of the mucus layer. Meprin-β, a metalloendopeptidase involved in the detachment and release of mucus from goblet cells, as well as in the modulation of mucus properties (57), was poorly expressed in HF-fed mice compared with SD-fed mice. Therefore, a combination of down-regulation of Meprin-β expression reducing the apical release of mucin vesicles and dysfunction of the CFTR/NKCC1 complex altering the balance of electrolytes in the luminal fluid (62), all associated with an impairment of the PPAR-γ pathway (59), are likely to account for the collapse of the mucus barrier (55, 57). Moreover, when we treated the mice with rosiglitazone, the Meprin-β staining was stronger in HF-rosi mice compared with HF-fed mice. This result can also explain our observations about the partial reestablishment of the mucus layer in HF-rosi mice and consequently the restoration of the spatial distribution of the microbiota in HF-rosi mice as well. Taken together, these data indicate an association between PPAR-γ and the mucus formation in the ileum.
It has also been described that PPAR-γ is a direct regulator of β-defensin expression in the human and mouse colons but not in the mouse ileum (58). However, in the current HF diet model, down-regulation of Ppar-γ was concomitant to down-regulation of major AMP, such as defensins, in the ileum, and when Ppar-γ expression was increased by rosiglitazone, AMP gene expression was also restored. Moreover, we showed that deletion of Ppar-γ expression in the intestine decreased the expression of some AMP in the ileum of control mice, indicating the key role of PPAR-γ in the control of AMP expression and de facto in bacterial spatial distribution. The decrease in AMP gene expression was correlated to the uncontrolled bacterial colonization, regardless if the duodenum or ileum were considered. This finding supports a model where impairment in AMP gene expression and production is associated with an expansion of the microbiota to otherwise preserved territories (63, 64). In the ileum of HF-fed mice, the decrease in AMP, such as α-defensins, lysozyme, and phospholipase A2 could explain colonization of the intervillous space by the microbiota. We further observed that in the ileum of HF-fed mice, transcription of Mmp-7, which contributes to maturation of α-defensins (65), was down-regulated, similar to AMP-coding genes. Hence, in addition to downregulating AMP, HF diet also affects the maturation of AMP in the ileum, contributing to the inability of the AMP produced to keep bacteria away from the epithelial surface. In the proximal part of the SI, we observed that Reg3γ expression was significantly lower in HF-fed mice. Using Reg3γ −/− mice, it was previously shown that Reg3γ limits bacterial colonization at SI mucosal surface and maintains a homeostatic spatial relationship between the microbiota and the host (13). These results show that the upper and the lower parts of the small intestine differentially modulate AMP expression in response to HF diet. These differences could be explained by AMP being differentially expressed in physiological conditions along the SI (66), and thus respond differentially with respect to microbiota modulation. Moreover, it was recently shown that elimination of the microbiota-accessible carbohydrates, which are highly represented in dietary fibers and used as substrate by intestinal bacteria, induces a shift of the microbiota toward mucus-consuming bacteria and consequently results in closer proximity of bacteria with the epithelium (67). However, no data are actually available concerning the impact on the spatial distribution of microbiota of missing microbiota-accessible carbohydrates in the small intestine.
Our study revealed that HF diet not only altered the spatial segregation of bacteria, but also the microbiota composition. Studies have shown that, on the basis of long-term administration (9–22 wk), obesogenic diets, such as HF diet, reduce the diversity and richness of the fecal and cecal microbiota (32, 68), altering the Firmicutes/Bacteroidetes balance by increasing Firmicutes (Erysipelotrichaceae), Verrucomicrobia, and decreasing Bacteroidales S24-7 (69, 70). Here, we found that HF diet alters the composition of the fecal and cecal microbiota even after a short-term (30 d) consumption, as previously shown (38, 39, 43). Moreover, when we specifically analyzed the microbiota associated to the ileal mucosa, we found that HF diet favored emergence of the genus Akkermensia, a finding supported by similar observations in rat models (43, 71). Akkermansia members, and more specifically Akkermansia muciniphila, have been identified as mucin-degrading bacteria residing in the mucus layer (72). In our model collapse of the mucus barrier could favor the emergence of such bacteria able to use it as substrate, or diet-mediated increase in this species may further participate in the alteration of the mucus barrier (67, 73). Interestingly, the treatment of HF-fed mice with rosiglitazone was able to restore the spatial distribution of the ileal microbiota but not the composition compared with SD-fed mice, indicating that biochemical parameters, such as electrolytes and mucus releases, play pivotal roles in maintaining microbiota at a distance from the epithelium, but diet composition determine the microbiota composition (67). Other bacterial species were affected under HF diet, such as SFB. FISH analyses and 16S rRNA gene sequencing revealed that SFB was no longer detectable in the terminal ileum of HF-fed mice (74). SFB is highly sensitive to diet composition and, because of a large number of auxotrophies (75), SFB survives by establishing close proximity to the epithelial surface, and possibly symbiotic interactions with certain commensal bacteria (76). The few studies analyzing the potential symbiotic relationship between specific commensal bacteria and SFB indicate that members of the Bacteroides/Prevotella or Lactobacillus genus may be key to explain its maintenance and abundance in infants and mice, respectively (77, 78). Moreover, a recent paper shows that decrease of SFB in the ileum corresponds to an increase of the Erysipelotrichi class (79). Here, the decrease in Bacteroides and the appearance of Erysipelotrichi could explain the loss of SFB. Bacteria reaching the epithelial surface are likely to outcompete SFB in HF-fed mice; while under SD, SFB is the sole colonizer of this specific niche.
Together, these results show that HF diet is perceived as a major stress by the SI epithelium that strongly affects mucosal defenses (CFTR, AMP, mucus), largely in response to an alteration of PPAR-γ signaling, thus allowing colonization by the microbiota of the intervillous space.
Further studies should focus on the mechanisms by which short-term fat excess induces these regulatory changes and disrupts epithelial integrity. These studies would also be relevant to better understand the link between HF diet, microbiota, obesity, and type 2 diabetes.
Materials and Methods
Animals.
Animals were housed in the Institut Pasteur animal facility accredited by the French Ministry of Agriculture for performing experiments on live rodents. Work on animals was performed in compliance with French and European regulations on care and protection of laboratory animals (EC Directive 2010/63, French Law 2013–118, February 6, 2013). All experiments were approved by the Ethics Committee #89 and registered under the reference 2013–0124 and by the French Research Ministry under the reference 02079.03. All animal experimentation protocols used at the National University of Singapore were approved by the Institutional Animal Care and Use Committee (authorizations 2013/SHS/866 and 2015/SHS/1023). Mice were housed at 22 °C with a 12-/12‐h light/dark cycle. Two groups of 8-wk-old mice (males C57BL/6JRj, Janvier, France) were fed with a SD (R03-40, SAFE, France; 5.1% weight of fat) or a HF diet (231HF, SAFE, France; 40% weight of fat), both sterilized by γ-irradiation and killed 4 wk after diet experiment. Each experiment was carried out independently at least four times. Two other groups of mice (SD-rosi and HF-rosi) were treated with rosiglitazone (Sigma-Aldrich, R2408; 20 mg⋅kg⋅d) for 1 wk. These mice were killed 5 wk after diet experiment. Mice were killed by cervical dislocation, the SI from duodenum to terminal ileum recovered, and immediately used for RNA and DNA extraction, histological procedures, or permeability measurement using an Ussing chamber.
Two other groups of 8-wk-old mice were studied: HS (elaborated upon request, SAFE, France; 58.30% weight of carbohydrates and 12.4% weight of fat) and HF/HS (SAFE, 230HF, France; 36.8% weight of carbohydrates and 35.8% weight of fat) and killed 4 wk after diet experiment. Each experiment was carried out independently at least two times. The compositions of the diets are described in Table S1.
Table S1.
Diet composition
| Diets | Proteins (%kcal/kg) | Fat (%kcal/kg) | Carbohydrates (%kcal/kg) | Calories (kcal/kg) |
| SD (R03-40) | 30.3 | 16.2 | 53.5 | 2,827 |
| HF (231HF) | 21 | 71 | 8 | 5,053 |
| HS | 22.5 | 11.5 | 66 | 3,979 |
| HF/HS (230HF) | 13 | 61 | 26 | 5,317 |
Specific pathogen-free C57BL/6 wild-type mice carrying a targeted disruption of the gene encoding PPAR-γ in intestinal epithelial cells were generated by breeding animals harboring a floxed Ppar-γ (PPAR-γ fl/fl) to mice expressing the Cre transgene under control of the villin promoter; these mice were designated as PPAR-γ VillinCre+, and their littermate control mice were designated as PPAR-γ VillinCre− (80).
Intraperitoneal Glucose Tolerance Test.
For glucose tolerance tests, 16-h fasted mice received 30 mg of glucose by intraperitoneal administration. Blood samples were taken at 0, 30, 60, and 90 min after glucose administration and glucose concentrations were measured in blood from the tail using the glucometer Alpha Trak 2 with associated ribbon tests (Abbott).
RNA and DNA Extraction.
One-centimeter of intestinal tissue (duodenum, jejunum, or ileum) was homogenized in 2-mL tubes containing 0.1-mm glass beads and 1 mL Trizol using the Precellys system. The duodenum part was taken directly after the stomach, the jejunum part was taken in the middle part of the SI, and the ileum was the distal part of the SI near the cecum. After extraction with chloroform, precipitation with isopropanol and washings with 70% (vol/vol) ethanol, and extracted RNA was resuspended in 100 μL of sterile distilled water. A clean-up of the RNA associated with a DNase treatment was performed with the Nucleospin RNA II kit (Macherey-Nagel). RNA quantification was done using the NanoDrop ND-100 (Thermo Scientific). cDNA synthesis was performed from 2 μg of RNA using oligo-dT (Promega) and SuperScript II (Life Technologies).
RT-qPCR Analysis of Intestinal Cell Gene Expression.
Intestinal RNAs were analyzed by RT-qPCR. The list of the genes detected using the SYBR Green PCR system and the primers associated are listed in Dataset S1. Differences were calculated using the comparative 2-ΔΔCt method (81). Results obtained with the QuantStudio 7 Flex Real-Time PCR System, 384-well (Life Technologies) were normalized to those for the Gapdh gene (Table S2) and compared with the mean target gene expression in SD mice.
Table S2.
List of primers used for RT-qPCR experiments
| Name | Forward (5′→3′) | Reverse (5′→3′) |
| gapdh | CTTATCAGGCCAAGTATGATG | CAACCTGGTCCTCAGTGTAGC |
| muc2 | TACGCTCTCCACCAGTTCCT | CAGCTCTCGATGTGTGTGTAGGT |
| muc3 | TGGTCAACTGCGAGAATGGA | TACGCTCTCCACCAGTTCCT |
| meprin-β | CAGGCAAGGAACACAACTTC | TCTGTCCCGTTCTGGAAAG |
| klf4 | AGAGGAGCCCAAGCCAAAGAGG | CCACAGCCGTCCCAGTCACAGT |
| retnlß | TGGCTGTGGATCGTGGGATA | TAAACCATTCGGCAGCAGCG |
| mmp-7 | CTGCCACTGTCCCAGGAAG | GGGAGAGTTTTCCAGTCATCG |
| lyz | GAGACCGAAGCACCGACTATG | CGGTTTTGACATTGTGTTCGC |
| reg3γ | CCATCTTCACGTAGCAGC | CAAGATGTCCTGAGGGC |
| pla2g4A | GGCCTTTGGCTCAATACAGGT C | ACAGTGGCATCCATAGAAGGCA |
| ang4 | TGGCCAGCTTTGGAATCACTG | GCTTGGCATCATAGTGCTGACG |
| defa3 | TCCTCCTCTCTGCCCTCGT | GACCCTTTCTGCAGGTCCC |
| defa5 | GTCCAGGCTGATCCTATCCA | GATTTCTGCAGGTCCAAAA |
| defa20 | GACCTGCTCAGGACGACTTT | GCCTCAGAGCTGATGGTTGT |
| cftr | AAGGCGGCCTATATGAGGTT | AGGACGATTCCGTTGATGAC |
| nkcc1 | CAAGGGTTTCTTTGGCTAT | TCACCTGAGATATTTGCTCC |
| slc26A3 | TTCCCCTCAACATCACCATCC | GTAAAA TCGTTCTGAGGCCCC |
| slc26A6 | CCAAAC ATA GGAGGCAATCC | GGTATCCTGTGCGTGAATGGCTC |
| nhe3 | TGGCAGAGACTGGGATGATAA | CGCTGACGGATTTGATAGAGA |
| ano1 | AGCAGGCTTCTGACCATCAC | CACGTCCAGACGACACAAGA |
| ppar-γ | CCAGCATTTCTGCTCCACAC | ATTCTTGGAGCTTCAGGCCA |
LCM and Sample Collection for Intestinal Microbiota Analysis.
Duodenum, jejunum, and ileum were embedded in OCT compound 4583 (Sakura), frozen in isopentane cooled with dry ice, and stored at −80 °C. Frozen blocks were cut with a thickness of 8 µm using a CM 3050S cryostat (Leica), and sections were collected on Superfrost plus slides (VWR) and stored at −20 °C. Frozen sections were thawed and briefly stained with histogen (MDS Analytical Technologies), containing RnaseOut recombinant RNase inhibitor, washed in RNase-free water supplemented with ProtectRNA (Sigma-Aldrich), and dehydrated in ethanol [once in 70% (vol/vol) for 30 s, twice in 95% (vol/vol) for 1 min, and twice in 100% (vol/vol) for 2 min] and in xylene (two baths for 5 min) before being air-dried. Slides were then transferred into a Veritas LCM system (Arcturus, ThermoFisher Scientific), microdissected and captured on Capture Macro LCM caps (Arcturus, ThermoFisher Scientific). DNA was extracted using the PicoPure DNA extraction kit (Arcturus, ThermoFisher Scientific) after incubation for 30 min at room temperature with lysozyme (10 mg/mL in PBS; Sigma-Aldrich). DNAs were stored at −20 °C. Bacterial DNA from feces and cecal content were extracted using the PowerFecal DNA isolation kit (MoBio) following the manufacturer’s recommendations. Controls included extractions without addition of any sample as negative control for library construction and potential reagents contamination. To minimize further risk of contamination from small materials, plastic tubes and plates were pretreated with UV cross-linker for 3 h before use.
16S rRNA Gene Sequencing and Analysis.
16S rRNA gene amplification and library construction was performed according to Illumina recommendation (web.uri.edu/gsc/files/16s-metagenomic-library-prep-guide-15044223-b.pdf). Briefly, a first PCR was performed using 4 μL of DNA extracted from microdissected tissues and 2 μL of DNA from feces or intestinal content using primers targeting the 16S rRNA gene V3 and V4 regions and as follows: forward primer 341F 5′-TCGTCGGCAGCGTCAGATGTGTATAAGAGACAGCCTACGGGNGGCWGCAG-3′ and reverse primer 805R 5′- GTCTCGTGGGCTCGGAGATGTGTATAAGAGACAGGACTACHVGGGTATCTAATCC-3′, where the Illumina adapters are indicated in italics. After 25 cycles, PCR products were purified using AMPure XP beads (Beckman Coulter Genomics) according to the manufacturer’s recommendations. A second PCR was performed to attach dual indices using the Nextera XT Index kit (Illumina). After eight cycles, PCR products were purified using AMPure XP beads (Beckman Coulter Genomics). PCR were also performed using PicoPure extraction buffer alone, “blank” extraction with the PowerFecal DNA isolation kit or water and used as controls for 16S rRNA gene sequencing analysis. The size of the libraries (600 bp) and their quantification were determined by Fragment Analyzer (Proteigene) using the High Sensitivity NGS Fragment Analysis kit. Purified amplicons were pooled in equimolar concentration to obtain a 6-pM library containing 10% of PhiX control. Sequencing was performed on an Illumina MiSeq instrument using the paired-end 300 bases pair protocol at the Institut Pasteur.
A total of 84 samples were sequenced including 36 fecal and cecal samples, 30 laser-microdissected samples (duodenum, jejunum, and ileum), 5 PicoPure buffer controls (LCM buffer), 4 PowerFecal buffer controls (MoBio buffer), and 9 water samples as no template controls (Water). A total of 8,916,630 read pairs were generated (mean 106,150 read pairs per sample with median of 50,884). The reads were first demultiplexed according to their dual barcode by samples and each pair was assembled using FLASH v1.2.11 (82). The FLASH error-correction feature was used to remove ambiguous base pairs in the overlapping region of each read pairs (average size of the overlapping region 120 bp). Primer sequences were then remove (cutadapt 2.6) (journal.embnet.org/index.php/embnetjournal/article/view/200) and any fragments containing ambiguous bases N or shorter than 370 were removed (PRINSEQ-lite 0.20.3) (83). Furthermore, only fragments with a mean Phred quality score above 28 were kept. A total of 5,344,705 fragments were retained with an average of 60,052 fragments per sample. Sequences analyses were performed using QIIME (v1.9.1) (84) as follows: (i) pick_otu.py to cluster sequences using the UCLUST algorithm (85) into operational taxonomic units (OTUs) at 97% similarity; (ii) pick_rep_set.py to select a representatives set of OTUs, including a sequence representative of each OTU, corresponding to the centroid of the associated cluster; (iii) assigne_taxonomy.py performs taxonomy assignment for the representative set, using Uclust assignment method (default parameters) and the Greengenes 13.8 16S rRNA genes sequence database (86). To build the phylogenic tree of representative sets, the multiple-alignment was generated using PyNAST (87) based on default similarity of 75%. The phylogenic tree was constructed using make_phylogeny.py with tree_method_default parameter using the FastTree algorithm (88). The resulting phylogenic tree was further processed to calculate core diversity metrics, including β-diversity [based on weighted/unweighted unifrac metrics (89)] and α-diversity (for different depth of rarefactions) measures. Moreover we carried out taxonomic group diversity analysis and differential taxonomy abundance (scripts of Qiime). The intergroup high similarity and intra group low similarity of microbiota in the contexts of HF diet and SD are proven by β-diversity, PCoA (Generated By Qiime using unweighted unifrac metrics) (84, 89). To test for significant differences in taxonomic abundances we used the nonparametric Kruskal–Wallis test with the false-discovery rate correction. Differences were considered significant at P < 0.05. The number of sequences obtained with the controls samples and the microdissected duodenum and jejunum was not enough to get significant results.
Immunostaining.
Unflushed SI Swiss rolls were prepared and tissues were fixed in 4% (vol/vol) paraformaldehyde for immunofluorescence (IF) staining or in Carnoy (ethanol/chloroform/acetic acid 60:30:10) for mucus preservation, dehydrated, and embedded in paraffin according to the standard protocol. All of the stainings were done on dewaxed 8-μm sections. In IF experiments, antigen retrieval was performed in citric acid buffer 2 mM pH 6 for 45 min at 96 °C and fluorescence-labeled secondary antibodies were used and nuclei stained with DAPI. IF assay for mucus phenotype observations was performed with the anti-MUC2 antibody, as described below.
Antibodies.
The following primary antibodies were used for IF: anti-MUC2 (1:500; sc-15334, Santa Cruz Biotechnology), anticlaudin-7 (1:100; ab27487 Abcam), anti-CFTR (1:50; NBP1-61572 Novus Biologicals), anti-NKCC1 (1:100; 13884–1-AP Euromedex), anti-Reg3γ (1:50; PA5-25517, ThermoFisher Scientific), and anti–Meprin-β (1:50; MEP1B, MAB28951, R&D Systems).
FISH Assay.
Unwashed duodenum, jejunum, and ileum were fixed in Carnoy and 8-μm sections were cut for FISH using microtome. Procedure used for FISH experiments are described in ref. 28. The pan-bacteria probe Eub338-Alexa555 5′-GCTGCCTCCCGTAGGAGT-3′ (90), and the specific SFB 1008-FITC probe 5′-GCGAGCTTCCCTCATTACAAGG-3′ (91) were used. DNA was stained with DAPI revealing both eukaryotic and bacterial cells.
Image Acquisition and Analyses.
Structured illumination microscopy was used to observed fluorescent signals and for photography (IX81 Olympus). The intensity of IF staining were evaluated with the software MacBiophotonics ImageJ.
Tissue-Conductance Measurements.
Segments of duodenum, jejunum, and terminal ileum were mounted in Ussing chambers (Easy Mount Physiologic Instruments) with an exposed area of 0.2 cm2. The tissues were bathed at 37 °C, pH 7.4 with carbogen-gassed Krebs-Ringer bicarbonate solution (92) containing 10 mM of glucose and mannitol in the basolateral and mucosal compartment, respectively. Electrogenic ion transport was monitored as short-circuit current (Isc) by using an automated voltage clamp apparatus (DVC 1000; WPI) linked through Lab-Trax-4/16 to a PC computer. At steady-state (30 min), potential difference and Isc were measured and total ionic conductances were calculated according to Ohm’s law. Tissues were then challenged serosally with 10 µmol/L forskolin and ΔIsc was registered.
Statistical Analysis.
Data are reported as means ± SEM. Mann–Whitney test or one-way ANOVA (Prism 5.0, GraphPad software) were used and significance was set at *P < 0.05, **P < 0.01, ***P < 0.001.
Supplementary Material
Acknowledgments
We thank Laurence Motreff for her help with the Illumina libraries preparation and the MiSeq run; Eeswari Paramalingam for animal handling and tissue preparation; Jacques Ravel for editing the manuscript; and Nathalie Bechon for her contribution during her fellowship. J.T. was in part funded by the Contrat Jeune Scientifique from the Institut National de la Recherche Agronomique (Jouy-en-Josas, France). This work was supported in part by the Société Française de Nutrition; the Fondation des Treilles created by Anne Gruner Schlumberger (www.les-treilles.com); the French Government’s Investissement d’Avenir program, Laboratoire d’Excellence “Integrative Biology of Emerging Infectious Diseases” (Grant ANR-10-LABX-62-IBEID); the European Research Council Advanced Grants 339579-DECRYPT (to P.J.S.); a Start-Up Grant from the Lee Kong Chian School of Medicine, Nanyang Technological University; and the 7th EU program TORNADO.
Footnotes
The authors declare no conflict of interest.
Data deposition: The 16S rRNA gene sequence data have been deposited into the NCBI Sequence Read Archive database, www.ncbi.nlm.nih.gov/sra (BioProject accession nos. PRJNA306818 and PRJNA340242).
This article contains supporting information online at www.pnas.org/lookup/suppl/doi:10.1073/pnas.1612559113/-/DCSupplemental.
References
- 1.Qin J, et al. MetaHIT Consortium A human gut microbial gene catalogue established by metagenomic sequencing. Nature. 2010;464(7285):59–65. doi: 10.1038/nature08821. [DOI] [PMC free article] [PubMed] [Google Scholar]
- 2.Macfarlane GT, Macfarlane S. Fermentation in the human large intestine: Its physiologic consequences and the potential contribution of prebiotics. J Clin Gastroenterol. 2011;45(Suppl):S120–S127. doi: 10.1097/MCG.0b013e31822fecfe. [DOI] [PubMed] [Google Scholar]
- 3.Frank DN, et al. Molecular-phylogenetic characterization of microbial community imbalances in human inflammatory bowel diseases. Proc Natl Acad Sci USA. 2007;104(34):13780–13785. doi: 10.1073/pnas.0706625104. [DOI] [PMC free article] [PubMed] [Google Scholar]
- 4.Moran NA, Sloan DB. The hologenome concept: Helpful or hollow? PLoS Biol. 2015;13(12):e1002311. doi: 10.1371/journal.pbio.1002311. [DOI] [PMC free article] [PubMed] [Google Scholar]
- 5.Sela DA, Mills DA. The marriage of nutrigenomics with the microbiome: The case of infant-associated bifidobacteria and milk. Am J Clin Nutr. 2014;99(3):697S–703S. doi: 10.3945/ajcn.113.071795. [DOI] [PMC free article] [PubMed] [Google Scholar]
- 6.Cherbuy C, Tomas J, Thomas M, Langella P. Interactions of the intestinal microbiota with mucosal epithelial cells. In: Eduardo J, Schiffrin PM, Brassart D, editors. Intestinal Microbiota in Health and Disease: Modern Concepts. CRC Press; Boca Raton, FL: 2014. pp. 61–88. [Google Scholar]
- 7.Carvalho FA, Aitken JD, Vijay-Kumar M, Gewirtz AT. Toll-like receptor-gut microbiota interactions: Perturb at your own risk! Annu Rev Physiol. 2012;74:177–198. doi: 10.1146/annurev-physiol-020911-153330. [DOI] [PubMed] [Google Scholar]
- 8.Wells JM, Rossi O, Meijerink M, van Baarlen P. Epithelial crosstalk at the microbiota-mucosal interface. Proc Natl Acad Sci USA. 2011;108(Suppl 1):4607–4614. doi: 10.1073/pnas.1000092107. [DOI] [PMC free article] [PubMed] [Google Scholar]
- 9.Seth A, Yan F, Polk DB, Rao RK. Probiotics ameliorate the hydrogen peroxide-induced epithelial barrier disruption by a PKC- and MAP kinase-dependent mechanism. Am J Physiol Gastrointest Liver Physiol. 2008;294(4):G1060–G1069. doi: 10.1152/ajpgi.00202.2007. [DOI] [PMC free article] [PubMed] [Google Scholar]
- 10.Zareie M, et al. Novel effects of the prototype translocating Escherichia coli, strain C25 on intestinal epithelial structure and barrier function. Cell Microbiol. 2005;7(12):1782–1797. doi: 10.1111/j.1462-5822.2005.00595.x. [DOI] [PubMed] [Google Scholar]
- 11.Sperandio B, Fischer N, Sansonetti PJ. Mucosal physical and chemical innate barriers: Lessons from microbial evasion strategies. Semin Immunol. 2015;27(2):111–118. doi: 10.1016/j.smim.2015.03.011. [DOI] [PubMed] [Google Scholar]
- 12.Vaishnava S, Behrendt CL, Ismail AS, Eckmann L, Hooper LV. Paneth cells directly sense gut commensals and maintain homeostasis at the intestinal host-microbial interface. Proc Natl Acad Sci USA. 2008;105(52):20858–20863. doi: 10.1073/pnas.0808723105. [DOI] [PMC free article] [PubMed] [Google Scholar]
- 13.Vaishnava S, et al. The antibacterial lectin RegIIIgamma promotes the spatial segregation of microbiota and host in the intestine. Science. 2011;334(6053):255–258. doi: 10.1126/science.1209791. [DOI] [PMC free article] [PubMed] [Google Scholar]
- 14.Johansson ME, et al. Bacteria penetrate the normally impenetrable inner colon mucus layer in both murine colitis models and patients with ulcerative colitis. Gut. 2014;63(2):281–291. doi: 10.1136/gutjnl-2012-303207. [DOI] [PMC free article] [PubMed] [Google Scholar]
- 15.Johansson ME, et al. The inner of the two Muc2 mucin-dependent mucus layers in colon is devoid of bacteria. Proc Natl Acad Sci USA. 2008;105(39):15064–15069. doi: 10.1073/pnas.0803124105. [DOI] [PMC free article] [PubMed] [Google Scholar]
- 16.Keely S, et al. Activated fluid transport regulates bacterial-epithelial interactions and significantly shifts the murine colonic microbiome. Gut Microbes. 2012;3(3):250–260. doi: 10.4161/gmic.20529. [DOI] [PMC free article] [PubMed] [Google Scholar]
- 17.Farkas K, et al. New therapeutic targets in ulcerative colitis: The importance of ion transporters in the human colon. Inflamm Bowel Dis. 2011;17(4):884–898. doi: 10.1002/ibd.21432. [DOI] [PubMed] [Google Scholar]
- 18.Tomas J, et al. Early colonizing Escherichia coli elicits remodeling of rat colonic epithelium shifting toward a new homeostatic state. ISME J. 2015;9(1):46–58. doi: 10.1038/ismej.2014.111. [DOI] [PMC free article] [PubMed] [Google Scholar]
- 19.Tomas J, et al. Primocolonization is associated with colonic epithelial maturation during conventionalization. FASEB J. 2013;27(2):645–655. doi: 10.1096/fj.12-216861. [DOI] [PubMed] [Google Scholar]
- 20.Reikvam DH, et al. Depletion of murine intestinal microbiota: Effects on gut mucosa and epithelial gene expression. PLoS One. 2011;6(3):e17996. doi: 10.1371/journal.pone.0017996. [DOI] [PMC free article] [PubMed] [Google Scholar]
- 21.Gallo RL, Hooper LV. Epithelial antimicrobial defence of the skin and intestine. Nat Rev Immunol. 2012;12(7):503–516. doi: 10.1038/nri3228. [DOI] [PMC free article] [PubMed] [Google Scholar]
- 22.Denou E, et al. Defective NOD2 peptidoglycan sensing promotes diet-induced inflammation, dysbiosis, and insulin resistance. EMBO Mol Med. 2015;7(3):259–274. doi: 10.15252/emmm.201404169. [DOI] [PMC free article] [PubMed] [Google Scholar]
- 23.Nigro G, Rossi R, Commere PH, Jay P, Sansonetti PJ. The cytosolic bacterial peptidoglycan sensor Nod2 affords stem cell protection and links microbes to gut epithelial regeneration. Cell Host Microbe. 2014;15(6):792–798. doi: 10.1016/j.chom.2014.05.003. [DOI] [PubMed] [Google Scholar]
- 24.van Elburg RM, Fetter WP, Bunkers CM, Heymans HS. Intestinal permeability in relation to birth weight and gestational and postnatal age. Arch Dis Child Fetal Neonatal Ed. 2003;88(1):F52–F55. doi: 10.1136/fn.88.1.F52. [DOI] [PMC free article] [PubMed] [Google Scholar]
- 25.Jakobsson HE, et al. The composition of the gut microbiota shapes the colon mucus barrier. EMBO Rep. 2015;16(2):164–177. doi: 10.15252/embr.201439263. [DOI] [PMC free article] [PubMed] [Google Scholar]
- 26.Knoop KA, McDonald KG, McCrate S, McDole JR, Newberry RD. Microbial sensing by goblet cells controls immune surveillance of luminal antigens in the colon. Mucosal Immunol. 2015;8(1):198–210. doi: 10.1038/mi.2014.58. [DOI] [PMC free article] [PubMed] [Google Scholar]
- 27.McDole JR, et al. Goblet cells deliver luminal antigen to CD103+ dendritic cells in the small intestine. Nature. 2012;483(7389):345–349. doi: 10.1038/nature10863. [DOI] [PMC free article] [PubMed] [Google Scholar]
- 28.Pédron T, et al. A crypt-specific core microbiota resides in the mouse colon. MBio. 2012;3(3):e00116–12. doi: 10.1128/mBio.00116-12. [DOI] [PMC free article] [PubMed] [Google Scholar]
- 29.Ley RE, et al. Obesity alters gut microbial ecology. Proc Natl Acad Sci USA. 2005;102(31):11070–11075. doi: 10.1073/pnas.0504978102. [DOI] [PMC free article] [PubMed] [Google Scholar]
- 30.Daniel H, et al. High-fat diet alters gut microbiota physiology in mice. ISME J. 2014;8(2):295–308. doi: 10.1038/ismej.2013.155. [DOI] [PMC free article] [PubMed] [Google Scholar]
- 31.Everard A, et al. Intestinal epithelial MyD88 is a sensor switching host metabolism towards obesity according to nutritional status. Nat Commun. 2014;5:5648. doi: 10.1038/ncomms6648. [DOI] [PMC free article] [PubMed] [Google Scholar]
- 32.Turnbaugh PJ, Bäckhed F, Fulton L, Gordon JI. Diet-induced obesity is linked to marked but reversible alterations in the mouse distal gut microbiome. Cell Host Microbe. 2008;3(4):213–223. doi: 10.1016/j.chom.2008.02.015. [DOI] [PMC free article] [PubMed] [Google Scholar]
- 33.Burcelin R, Crivelli V, Dacosta A, Roy-Tirelli A, Thorens B. Heterogeneous metabolic adaptation of C57BL/6J mice to high-fat diet. Am J Physiol Endocrinol Metab. 2002;282(4):E834–E842. doi: 10.1152/ajpendo.00332.2001. [DOI] [PubMed] [Google Scholar]
- 34.Burcelin R, Dolci W, Thorens B. Long-lasting antidiabetic effect of a dipeptidyl peptidase IV-resistant analog of glucagon-like peptide-1. Metabolism. 1999;48(2):252–258. doi: 10.1016/s0026-0495(99)90043-4. [DOI] [PubMed] [Google Scholar]
- 35.Kong LC, et al. Dietary patterns differently associate with inflammation and gut microbiota in overweight and obese subjects. PloS One. 2014;29(10):e109434. doi: 10.1371/journal.pone.0109434. [DOI] [PMC free article] [PubMed] [Google Scholar]
- 36.Turnbaugh PJ, et al. An obesity-associated gut microbiome with increased capacity for energy harvest. Nature. 2006;444(7122):1027–1031. doi: 10.1038/nature05414. [DOI] [PubMed] [Google Scholar]
- 37.Bäckhed F, et al. The gut microbiota as an environmental factor that regulates fat storage. Proc Natl Acad Sci USA. 2004;101(44):15718–15723. doi: 10.1073/pnas.0407076101. [DOI] [PMC free article] [PubMed] [Google Scholar]
- 38.Cani PD, et al. Changes in gut microbiota control metabolic endotoxemia-induced inflammation in high-fat diet-induced obesity and diabetes in mice. Diabetes. 2008;57(6):1470–1481. doi: 10.2337/db07-1403. [DOI] [PubMed] [Google Scholar]
- 39.Cani PD, et al. Metabolic endotoxemia initiates obesity and insulin resistance. Diabetes. 2007;56(7):1761–1772. doi: 10.2337/db06-1491. [DOI] [PubMed] [Google Scholar]
- 40.Perreault M, et al. A distinct fatty acid profile underlies the reduced inflammatory state of metabolically healthy obese individuals. PLoS One. 2014;9(2):e88539. doi: 10.1371/journal.pone.0088539. [DOI] [PMC free article] [PubMed] [Google Scholar]
- 41.Everard A, et al. Cross-talk between Akkermansia muciniphila and intestinal epithelium controls diet-induced obesity. Proc Natl Acad Sci USA. 2013;110(122):9066–9071. doi: 10.1073/pnas.1219451110. [DOI] [PMC free article] [PubMed] [Google Scholar]
- 42.Serino M, et al. Metabolic adaptation to a high-fat diet is associated with a change in the gut microbiota. Gut. 2012;61(4):543–553. doi: 10.1136/gutjnl-2011-301012. [DOI] [PMC free article] [PubMed] [Google Scholar]
- 43.Hamilton MK, Boudry G, Lemay DG, Raybould HE. Changes in intestinal barrier function and gut microbiota in high-fat diet-fed rats are dynamic and region dependent. Am J Physiol Gastrointest Liver Physiol. 2015;308(310):G840–351. doi: 10.1152/ajpgi.00029.2015. [DOI] [PMC free article] [PubMed] [Google Scholar]
- 44.Petit V, et al. Chronic high-fat diet affects intestinal fat absorption and postprandial triglyceride levels in the mouse. J Lipid Res. 2007;48(2):278–287. doi: 10.1194/jlr.M600283-JLR200. [DOI] [PubMed] [Google Scholar]
- 45.Wahli W, Michalik L. PPARs at the crossroads of lipid signaling and inflammation. Trends Endocrinol Metab. 2012;23(7):351–363. doi: 10.1016/j.tem.2012.05.001. [DOI] [PubMed] [Google Scholar]
- 46.Banks MR, Farthing MJ. Fluid and electrolyte transport in the small intestine. Curr Opin Gastroenterol. 2002;18(2):176–181. doi: 10.1097/00001574-200203000-00004. [DOI] [PubMed] [Google Scholar]
- 47.Poulsen JH, Fischer H, Illek B, Machen TE. Bicarbonate conductance and pH regulatory capability of cystic fibrosis transmembrane conductance regulator. Proc Natl Acad Sci USA. 1994;91(12):5340–5344. doi: 10.1073/pnas.91.12.5340. [DOI] [PMC free article] [PubMed] [Google Scholar]
- 48.Murek M, Kopic S, Geibel J. Evidence for intestinal chloride secretion. Exp Physiol. 2010;95(4):471–478. doi: 10.1113/expphysiol.2009.049445. [DOI] [PubMed] [Google Scholar]
- 49.Lynch SV, et al. Cystic fibrosis transmembrane conductance regulator knockout mice exhibit aberrant gastrointestinal microbiota. Gut Microbes. 2013;4(1):41–47. doi: 10.4161/gmic.22430. [DOI] [PMC free article] [PubMed] [Google Scholar]
- 50.Norkina O, Burnett TG, De Lisle RC. Bacterial overgrowth in the cystic fibrosis transmembrane conductance regulator null mouse small intestine. Infect Immun. 2004;72(10):6040–6049. doi: 10.1128/IAI.72.10.6040-6049.2004. [DOI] [PMC free article] [PubMed] [Google Scholar]
- 51.Tuo B, Wen G, Seidler U. Differential activation of the HCO(3)(-) conductance through the cystic fibrosis transmembrane conductance regulator anion channel by genistein and forskolin in murine duodenum. Br J Pharmacol. 2009;158(5):1313–1321. doi: 10.1111/j.1476-5381.2009.00398.x. [DOI] [PMC free article] [PubMed] [Google Scholar]
- 52.Seidler U, et al. A functional CFTR protein is required for mouse intestinal cAMP-, cGMP- and Ca(2+)-dependent HCO3- secretion. J Physiol. 1997;505(Pt 2):411–423. doi: 10.1111/j.1469-7793.1997.411bb.x. [DOI] [PMC free article] [PubMed] [Google Scholar]
- 53.Clarke LL. A guide to Ussing chamber studies of mouse intestine. Am J Physiol Gastrointest Liver Physiol. 2009;296(6):G1151–G1166. doi: 10.1152/ajpgi.90649.2008. [DOI] [PMC free article] [PubMed] [Google Scholar]
- 54.Gustafsson JK, et al. Bicarbonate and functional CFTR channel are required for proper mucin secretion and link cystic fibrosis with its mucus phenotype. J Exp Med. 2012;209(7):1263–1272. doi: 10.1084/jem.20120562. [DOI] [PMC free article] [PubMed] [Google Scholar]
- 55.Ambort D, et al. Calcium and pH-dependent packing and release of the gel-forming MUC2 mucin. Proc Natl Acad Sci USA. 2012;109(15):5645–5650. doi: 10.1073/pnas.1120269109. [DOI] [PMC free article] [PubMed] [Google Scholar]
- 56.Quinton PM. Birth of mucus. Am J Physiol Lung Cell Mol Physiol. 2010;298(1):L13–L14. doi: 10.1152/ajplung.00358.2009. [DOI] [PMC free article] [PubMed] [Google Scholar]
- 57.Schütte A, et al. Microbial-induced meprin β cleavage in MUC2 mucin and a functional CFTR channel are required to release anchored small intestinal mucus. Proc Natl Acad Sci USA. 2014;111(134):12396–12401. doi: 10.1073/pnas.1407597111. [DOI] [PMC free article] [PubMed] [Google Scholar]
- 58.Peyrin-Biroulet L, et al. Peroxisome proliferator-activated receptor gamma activation is required for maintenance of innate antimicrobial immunity in the colon. Proc Natl Acad Sci USA. 2010;107(119):8772–8777. doi: 10.1073/pnas.0905745107. [DOI] [PMC free article] [PubMed] [Google Scholar]
- 59.Harmon GS, et al. Pharmacological correction of a defect in PPAR-gamma signaling ameliorates disease severity in Cftr-deficient mice. Nat Med. 2010;16(3):313–318. doi: 10.1038/nm.2101. [DOI] [PMC free article] [PubMed] [Google Scholar]
- 60.Dekkers JF, et al. A functional CFTR assay using primary cystic fibrosis intestinal organoids. Nat Med. 2013;19(7):939–945. doi: 10.1038/nm.3201. [DOI] [PubMed] [Google Scholar]
- 61.Ollero M, et al. Decreased expression of peroxisome proliferator activated receptor gamma in cftr-/- mice. J Cell Physiol. 2004;200(2):235–244. doi: 10.1002/jcp.20020. [DOI] [PubMed] [Google Scholar]
- 62.Linley J, Loganathan A, Kopanati S, Sandle GI, Hunter M. Evidence that two distinct crypt cell types secrete chloride and potassium in human colon. Gut. 2013;63(63):472–479. doi: 10.1136/gutjnl-2013-304695. [DOI] [PubMed] [Google Scholar]
- 63.Loonen LM, et al. REG3γ-deficient mice have altered mucus distribution and increased mucosal inflammatory responses to the microbiota and enteric pathogens in the ileum. Mucosal Immunol. 2014;7(4):939–947. doi: 10.1038/mi.2013.109. [DOI] [PubMed] [Google Scholar]
- 64.Salzman NH, et al. Enteric defensins are essential regulators of intestinal microbial ecology. Nat Immunol. 2010;11(1):76–83. doi: 10.1038/ni.1825. [DOI] [PMC free article] [PubMed] [Google Scholar]
- 65.Bevins CL, Salzman NH. Paneth cells, antimicrobial peptides and maintenance of intestinal homeostasis. Nat Rev Microbiol. 2011;9(5):356–368. doi: 10.1038/nrmicro2546. [DOI] [PubMed] [Google Scholar]
- 66.Wehkamp J, et al. Paneth cell antimicrobial peptides: Topographical distribution and quantification in human gastrointestinal tissues. FEBS Lett. 2006;580(22):5344–5350. doi: 10.1016/j.febslet.2006.08.083. [DOI] [PubMed] [Google Scholar]
- 67.Earle KA, et al. Quantitative imaging of gut microbiota spatial organization. Cell Host Microbe. 2015;18(4):478–488. doi: 10.1016/j.chom.2015.09.002. [DOI] [PMC free article] [PubMed] [Google Scholar]
- 68.Ley RE, Peterson DA, Gordon JI. Ecological and evolutionary forces shaping microbial diversity in the human intestine. Cell. 2006;124(4):837–848. doi: 10.1016/j.cell.2006.02.017. [DOI] [PubMed] [Google Scholar]
- 69.Magnusson KR, et al. Relationships between diet-related changes in the gut microbiome and cognitive flexibility. Neuroscience. 2015;300(300):128–140. doi: 10.1016/j.neuroscience.2015.05.016. [DOI] [PubMed] [Google Scholar]
- 70.Carmody RN, et al. Diet dominates host genotype in shaping the murine gut microbiota. Cell Host Microbe. 2015;17(1):72–84. doi: 10.1016/j.chom.2014.11.010. [DOI] [PMC free article] [PubMed] [Google Scholar]
- 71.Fåk F, et al. The physico-chemical properties of dietary fibre determine metabolic responses, short-chain fatty acid profiles and gut microbiota composition in rats fed low- and high-fat diets. PloS One. 2015;10(15):e0127252. doi: 10.1371/journal.pone.0127252. [DOI] [PMC free article] [PubMed] [Google Scholar]
- 72.Derrien M, Vaughan EE, Plugge CM, de Vos WM. Akkermansia muciniphila gen. nov., sp. nov., a human intestinal mucin-degrading bacterium. Int J Syst Evol Microbiol. 2004;54(Pt 5):1469–1476. doi: 10.1099/ijs.0.02873-0. [DOI] [PubMed] [Google Scholar]
- 73.Ganesh BP, Klopfleisch R, Loh G, Blaut M. Commensal Akkermansia muciniphila exacerbates gut inflammation in Salmonella Typhimurium-infected gnotobiotic mice. PLoS One. 2013;8(9):e74963. doi: 10.1371/journal.pone.0074963. [DOI] [PMC free article] [PubMed] [Google Scholar]
- 74.Harley IT, et al. Differential colonization with segmented filamentous bacteria and Lactobacillus murinus do not drive divergent development of diet-induced obesity in C57BL/6 mice. Mol Metab. 2013;2(3):171–183. doi: 10.1016/j.molmet.2013.04.004. [DOI] [PMC free article] [PubMed] [Google Scholar]
- 75.Prakash T, et al. Complete genome sequences of rat and mouse segmented filamentous bacteria, a potent inducer of th17 cell differentiation. Cell Host Microbe. 2011;10(3):273–284. doi: 10.1016/j.chom.2011.08.007. [DOI] [PubMed] [Google Scholar]
- 76.Schnupf P, Gaboriau-Routhiau V, Cerf-Bensussan N. Host interactions with segmented filamentous bacteria: An unusual trade-off that drives the post-natal maturation of the gut immune system. Semin Immunol. 2013;25(5):342–351. doi: 10.1016/j.smim.2013.09.001. [DOI] [PubMed] [Google Scholar]
- 77.Yin Y, et al. Comparative analysis of the distribution of segmented filamentous bacteria in humans, mice and chickens. ISME J. 2013;7(3):615–621. doi: 10.1038/ismej.2012.128. [DOI] [PMC free article] [PubMed] [Google Scholar]
- 78.Ivanov II, et al. Induction of intestinal Th17 cells by segmented filamentous bacteria. Cell. 2009;139(3):485–498. doi: 10.1016/j.cell.2009.09.033. [DOI] [PMC free article] [PubMed] [Google Scholar]
- 79.Johansson ME, et al. Normalization of host intestinal mucus layers requires long-term microbial colonization. Cell Host Microbe. 2015;18(5):582–592. doi: 10.1016/j.chom.2015.10.007. [DOI] [PMC free article] [PubMed] [Google Scholar]
- 80.Kundu P, et al. Absence of intestinal PPARγ aggravates acute infectious colitis in mice through a lipocalin-2-dependent pathway. PLoS Pathog. 2014;10(1):e1003887. doi: 10.1371/journal.ppat.1003887. [DOI] [PMC free article] [PubMed] [Google Scholar]
- 81.Livak KJ, Schmittgen TD. Analysis of relative gene expression data using real-time quantitative PCR and the 2(-Delta Delta C(T)) Method. Methods. 2001;25(4):402–408. doi: 10.1006/meth.2001.1262. [DOI] [PubMed] [Google Scholar]
- 82.Magoč T, Salzberg SL. FLASH: Fast length adjustment of short reads to improve genome assemblies. Bioinformatics. 2011;27(21):2957–2963. doi: 10.1093/bioinformatics/btr507. [DOI] [PMC free article] [PubMed] [Google Scholar]
- 83.Schmieder R, Edwards R. Quality control and preprocessing of metagenomic datasets. Bioinformatics. 2011;27(6):863–864. doi: 10.1093/bioinformatics/btr026. [DOI] [PMC free article] [PubMed] [Google Scholar]
- 84.Caporaso JG, et al. QIIME allows analysis of high-throughput community sequencing data. Nat Methods. 2010;7(5):335–336. doi: 10.1038/nmeth.f.303. [DOI] [PMC free article] [PubMed] [Google Scholar]
- 85.Edgar RC. Search and clustering orders of magnitude faster than BLAST. Bioinformatics. 2010;26(19):2460–2461. doi: 10.1093/bioinformatics/btq461. [DOI] [PubMed] [Google Scholar]
- 86.DeSantis TZ, et al. Greengenes, a chimera-checked 16S rRNA gene database and workbench compatible with ARB. Appl Environ Microbiol. 2006;72(7):5069–5072. doi: 10.1128/AEM.03006-05. [DOI] [PMC free article] [PubMed] [Google Scholar]
- 87.Caporaso JG, et al. PyNAST: A flexible tool for aligning sequences to a template alignment. Bioinformatics. 2010;26(2):266–267. doi: 10.1093/bioinformatics/btp636. [DOI] [PMC free article] [PubMed] [Google Scholar]
- 88.Price MN, Dehal PS, Arkin AP. FastTree: Computing large minimum evolution trees with profiles instead of a distance matrix. Mol Biol Evol. 2009;26(7):1641–1650. doi: 10.1093/molbev/msp077. [DOI] [PMC free article] [PubMed] [Google Scholar]
- 89.Lozupone C, Knight R. UniFrac: A new phylogenetic method for comparing microbial communities. Appl Environ Microbiol. 2005;71(12):8228–8235. doi: 10.1128/AEM.71.12.8228-8235.2005. [DOI] [PMC free article] [PubMed] [Google Scholar]
- 90.Amann RI, et al. Combination of 16S rRNA-targeted oligonucleotide probes with flow cytometry for analyzing mixed microbial populations. Appl Environ Microbiol. 1990;56(56):1919–1925. doi: 10.1128/aem.56.6.1919-1925.1990. [DOI] [PMC free article] [PubMed] [Google Scholar]
- 91.Snel J, et al. Comparison of 16S rRNA sequences of segmented filamentous bacteria isolated from mice, rats, and chickens and proposal of “Candidatus arthromitus”. Int J Syst Bacteriol. 1995;45(44):780–782. doi: 10.1099/00207713-45-4-780. [DOI] [PubMed] [Google Scholar]
- 92.Ducroc R, et al. Luminal leptin inhibits L-glutamine transport in rat small intestine: Involvement of ASCT2 and B0AT1. Am J Physiol Gastrointest Liver Physiol. 2010;299(1):G179–G185. doi: 10.1152/ajpgi.00048.2010. [DOI] [PMC free article] [PubMed] [Google Scholar]
Associated Data
This section collects any data citations, data availability statements, or supplementary materials included in this article.


