Abstract
A multifunctional magneto-plasmonic CoFe2O4@Au core-shell nanoparticle was developed by iterative-seeding based method. This nanocargo consists of a cobalt ferrite kernel as a core (Nk) and multiple layers of gold as a functionalizable active stratum, (named as Nk@A after fifth iteration). Nk@A helps in augmenting the physiological stability and enhancing surface plasmon resonance (SPR) property. The targeted delivery of Doxorubicin using Nk@A as a nanopayload is demonstrated in this report. The drug release profile followed first order rate kinetics optimally at pH 5.4, which is considered as an endosomal pH of cells. The cellular MR imaging showed that Nk@A is an efficient T2 contrast agent for both L6 (r2-118.08 mM−1s−1) and Hep2 (r2-217.24 mM−1s−1) cells. Microwave based magnetic hyperthermia studies exhibited an augmentation in the temperature due to the transformation of radiation energy into heat at 2.45 GHz. There was an enhancement in cancer cell cytotoxicity when hyperthermia combined with chemotherapy. Hence, this single nanoplatform can deliver 3-pronged theranostic applications viz., targeted drug-delivery, T2 MR imaging and hyperthermia.
Cancer is the second leading disease which causes major mortality and morbidity worldwide1. In cancer therapy, it is crucial to increase the drug specificity and drug efficacy to minimise or completely eradicate significant side-effects on patients2. Cancer nanotherapeutics overcome many serious drawbacks of chemotherapy such as non-specific targeting, lower efficacy, insolubility of drug moieties in water and oral bioavailability3. Accordingly, Superparamagnetic Iron Oxide Nanoparticles (SPIONs) are exploited as an important nanomaterial for cancer detection as well as therapeutics4. Such magnetic nanoparticles (NPs) gained its momentum because of their single-domain ordering along with their large surface to volume ratio (providing large surface area for attachment of biological entities). Hence, this property makes them a suitable candidate as a contrast agent, drug-carrying cargo and hyperthermal agent5. The doping of SPIONs with cobalt ions further enhances their magnetic property, thus forming CoFe2O4 nanokernels (Nks). These spinel ferrite Nks possess ca. 20–30 times higher magneto-crystalline anisotropy as compared to SPIONs; this increases the performance of materials for biomedical applications6,7,8. Specifically, these Nks are mostly used in biomedicine than any other spinel structure because of their enhanced magnetic property and large anisotropy9. The increased superparamagnetism makes them an efficient system for theranostics10,11,12.
Such superparamagnetic Nks are reactive and toxic to cells; hence, gold NPs are used for creating a shell on the magnetic core. This architecture is biocompatible and chemically inert in the physiological system13. The core-shell nanoparticles (CSNPs) possesses unique optical and magnetic properties, thus creating an efficient platform for nanomedicine14. The significant benefit of the gold nanoshell is to provide complete protection to the inner magnetic core from a plethora of environmental factors15. This coat also acts as an excellent platform for surface modifications16,17, real-time imaging and drug carrying cargos18,19.
The major hurdle in synthesising CSNPs is that there is no uniform coating of gold shell on the surface of the iron oxide core, even though the ratio between iron and gold is 1:720,21. Therefore, gold iteration is a method that improves the formation of CSNPs and controls precisely the thickness of Au shell22,23 on the magnetic core. Even though iron oxide and gold CSNPs have been explored extensively24,25 for more than two decades, there are very few reports about CoFe2O4@Au nanoparticles21,26.
Doxorubicin (Dox) is one of the potential and most widely used anti-cancer agents for various types of cancers. This drug has shown inimical side effects on healthy cells such as cardiotoxicity, mucositis and myelosuppression27,28,29. These adverse effects are minimised by targeted drug delivery which uses specific molecules such as folic acid (FA) since cancerous cells overexpress folate receptors on their surface30. Apart from synaphic delivery of drugs, the most crucial parameter is its actual release for killing the cancerous cells. The effective release is dependent on different types of stimuli such as internal (alterations in pH, temperature, redox condition as well as the enzyme activities) or external (such as a magnetic field, radiations and ultrasound)31.
Hyperthermia induced by external magnetic field is the most celebrated mechanism that enhances drug release efficiency of the system and are easiest to be used32. The synergistic action of hyperthermia and chemotherapy induces apoptosis as well as necrosis in the cancer cells followed by an enhanced immune response. There is a huge impact of hyperthermia-combined chemotherapy on the immune system of hosts since they induce both adaptive as well as innate immunity. Hence, thermo-chemosenitization is considered as the future of clinical research33.
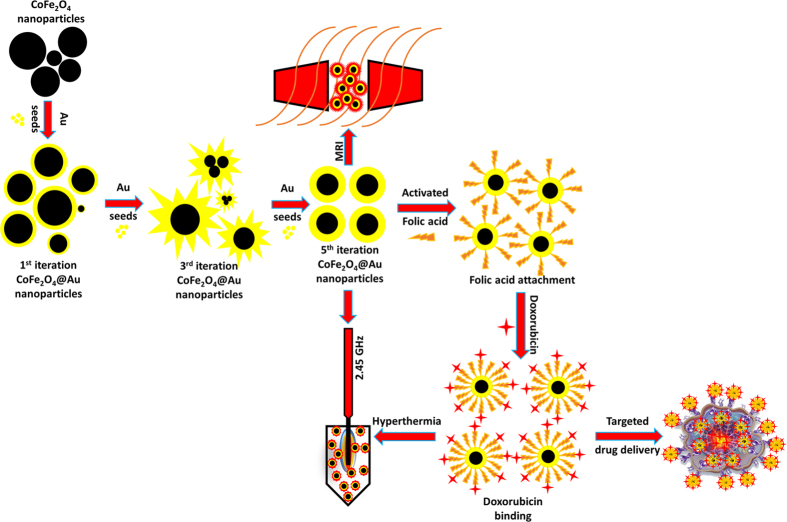
This work reports multiple iterative gold seed coated cobalt iron oxide nanokernels (Nk@A) as a tri-pronged cancer theranostic agent (Fig. 1). The attachment of FA on the surface of Nk@A was used for tethering folate receptors present on cancerous cells30. Furthermore, Dox moieties orchestrated on FA attached Nk@A were responsible for their anti-cancer activity. Hence, these nanocargos act as proficient drug delivery missiles that targets cancer cells. The drug release profiles were studied using release kinetic models. Moreover, these Nk@A also served as a T2 contrast agent for MR imaging. Finally, such a complex nanocargo was exploited for microwave based localized hyperthermia of cancer cells.
Figure 1. Schematic representation of CoFe2O4 synthesis and Au iterations from 1–5 to enhance the SPR property.
The surface is modified by attaching activated folic acid for specific targeting of cancer cells and also binding with anti-cancer drug doxorubicin for efficient chemotherapy. Finally, the whole complex is employed as MRI contrast agent and microwave based hyperthermal cargo at 2.45 GHz to track and treat cancer cells with high localization.
Results and Discussions
Characterization of Plasmonic/Magnetic NPs
XRD analysis was carried out to detect the purity and phase crystallinity of the synthesized Nk and Nk@A (Fig. 2). XRD pattern of Nk cubic spinel phase exhibited well-defined diffraction peaks that match with the CoFe2O4 structures (JCPDS card no. 22-1086)34. XRD pattern of Nk@A showed reflections that corelated well with the FCC ordering of Au (JCPDS card no. 04-0784), thus confirming the formation of a nanoshell onto Nk. In this case, only Au diffraction peaks were observed due to the heavy metal atom effect of Au18,32. The average particle sizes (Dxrd) of Nk and Nk@A were calculated by considering the most intense peaks [Nk (220), (311), (440) and Nk@A (111)]. According to Scherrer equation, the average crystalline size calculated for Nk was 9.68 nm and for Nk@A, 16.69 nm. The particle sizes obtained were well corroborated with corresponding TEM images.
Figure 2. XRD spectrum representing the formation of Nk and Nk@A.
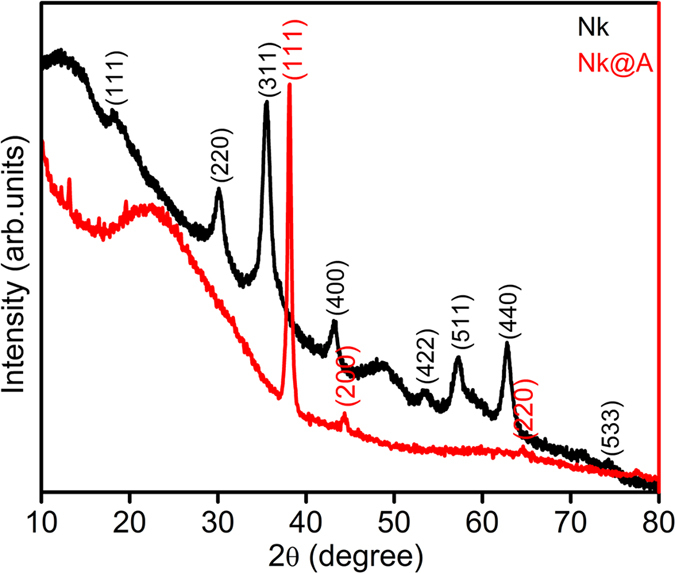
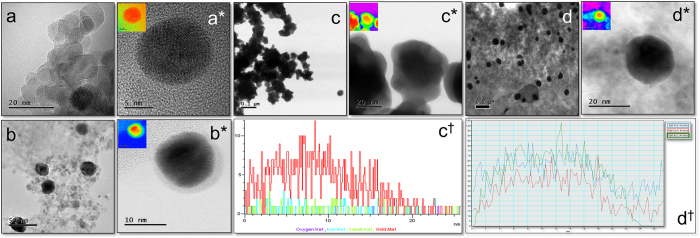
Figure 3a–d† shows TEM, HR-TEM, HAADF-STEM images and line scan of Nk and Nk@A (1st, 3rd & 5th iterations). TEM image of Nks were spherical in shape with the size range of 11–14 nm exhibiting high crystallinity with aggregation which is illustrated in Fig. 3a(a*). The crystal lattice structure of Nks were distorted on the surface due to the curvature effect. Hence, the gold shell could grow epitaxially on the surface of Nks due to a large lattice mismatch. This leads to the formation of Nk as a core and gold as a shell. As iteration increased, the size of the core-shell is also increased five times from 1st to 5th iteration with Au nanoshell. This increment was due to the continued conjugation of nanogold onto the surface of the core Nk, which lead to the formation of Nk@A. HAADF-STEM analysis clearly demonstrated the discrimination between the core and the shell. This is because this contrast is directly proportional to atomic number (Z). In the 1st iterative step, the Nk was coated with Au nanoshell of around 1–1.5 nm (Fig. 3b(b*)) without any aggregation. This proves that the Au iterations not only forms a shell but also stabilizes the nanoparticles. However, in order to enhance the SPR property, the iteration was continued; thus leading to the formation of a nanoflower, that constituted of the collective core madeof Nk encapsulated by a thick Au shell. The nanocluster showed jagged-like morphology due to non-homogeneously aggregated Nk, which leads to highly asymmetric coating of Au layer (Fig. 3c(c*))35. The thick gold nanoshell formation after multiple iterations in the Nk@A solution could be inferred from the colour change (Figure S1a in the †ESI). Figure 3c† illustrates the line scan analysis of 3rd iterated nanoflowers showing the elemental distribution of Co, Fe and Au in a single nanoparticle. The line scan confirms that Au signal is seen on the surface of Nks and Co, Fe signals are enriched in the inner core of the Nks. But as the iterations (5th iterations) continued, the Au seeds started to fill in the empty space of the knobby structures22. This resulted in the formation of separated spherical Nk@A and consecutively the shell size increased to 5–6 nm (Fig. 3d(d*)). Similar kind of NPs were obtained for Au@Fe3O4, which had a thin shell of Au36. Figure 3d† represents the corresponding line scan, which clearly shows the Co K, Fe K edges in the core and Au L edges in the shell similar to that of 3rd iterated particles. Additionally to the line scan intensities illustrated in Fig. 3c†,d†, it is interesting to define the stoichiometry represented by the Au Lα, whose ratio is higher than the core elements such as Co and Fe Kα. This proves that the Au signal is exhibited strongly than the signal from the core. Therefore, these results suggest that the formation of CSNPs expressing typical elemental composition of high Au content than the core elements, is well corroborated from XRD spectra. The colour mapping shown in Fig. 3(a* proves that the nanostructures are made up of two different metals depending on the electronic density of the atoms. This colour mapping was carried out using the Digital Micrograph 3.7.0 by Gatan software. EDS spectra was carried out to determine the composition of CSNPs for the 1st, 3rd and 5th iterations (Figure S1b,c,d in the †ESI) showing the signal of Au, Co & Fe37. The spectra clearly distinguishes the different Au iterations from 1 to 5 just by increasing order of Au signal intensity.
Figure 3.
(a(a*)) TEM, HRTEM image of Nk, TEM and HAADF-STEM image of: (b(b*)) 1st iteration consisting of very thin Au shell and depicting 2 different contrast which proves the formation of core-shell nanoparticles along CTAB layer, (c(c*)) 3rd iteration showing nanoflower formation, (d(d*)) 5th iterative Nk@A with thick Au shell around 6–7 nm (Inset representing the colour mapping of corresponding images), (c†,d†) Line scan analysis showing the distribution of Fe, Co and Au elements from a single nanoparticle.
The magnetic property of Nk@A is imperative to have an effective penetration in the cancer cell38. SQUID analysis (Fig. 4) shows a decrement in magnetic saturation (MS) from 74 to 45 emu/g, along with the diminishing hysteretic features. As temperature increased from 5 to 312 K, coercivity (HC) and remanence decreased from 146 to 32Oe and from 8 to 2 emu/g, respectively (Table S1 in the †ESI).
Figure 4. Magnetic measurements for Nk@A using SQUID at 5 K, 300 K & 312 K.
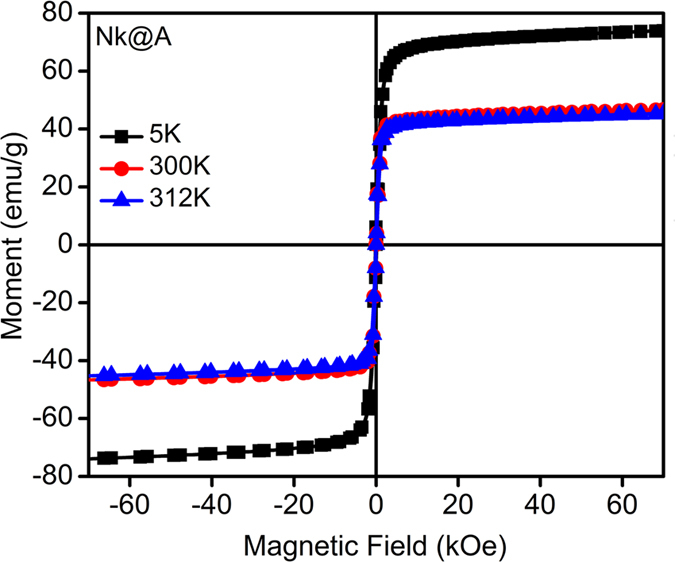
This magnetic behaviour was attributed to the thermal relaxation of the magnetic moments of the Nk@A. This behaviour was also ascribed to the re-orientation of the magnetic moments of NPs caused by the thermal energy once it surpassed the magnetic energy imposed by the applied field. Thus, the magnetic characteristics of the Nk@A can be ascribed to those expected from a soft ferromagnetic material, even at 312K. This kind of ferromagnetic character can be understood from MR imaging which showed high relaxivity values without the interference of Au nanoshell. Moreover, in the case of hyperthermia, the Nk@A showed increased heat dissipation under microwave irradiation in a short span of time.
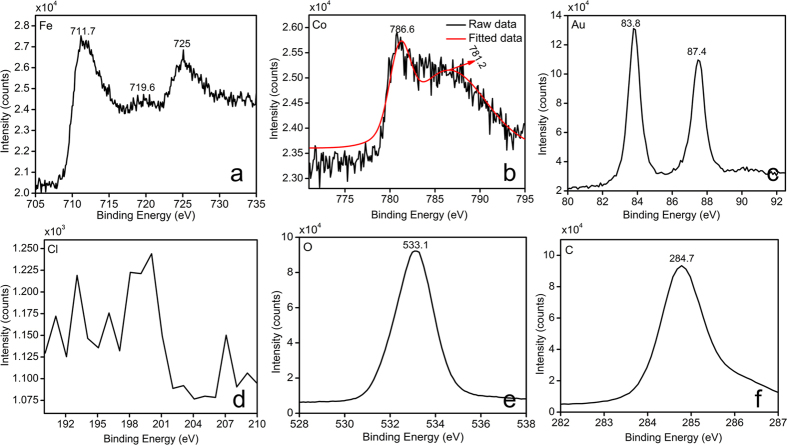
XPS measurements determined the binding energies and composition of Nk@A. The elements viz., Au, Co, Fe, C and O existed within the range from 0 to ≈1300 eV. Core level spectra were recorded and represented in Figure S3a in the †ESI. Fe2p3/2 and 2p1/2 peaks from Fig. 5a situated at around 711.7 and 725 eV respectively, were broadened due to the presence of Fe3+ ions in tetrahedral sites39,40. There is also a satellite peak of Fe3+ at 719.6 eV, which confirms the presence of Fe3+ 41. The orbitals of Co (Fig. 5b) showed that Co2p3/2 electrons exhibited binding energies at 781.2 eV, which corresponds to ions. This may be due to the substitution of Fe3+ ions with Co2+ in the tetrahedral site. There is also the existence of a peak at 786.6 eV, which again confirms the presence of Co2+. This is in accordance with the XRD data, which proves that there are no mixed phases of CoO or Fe2O3 in the Nk samples41. Figure 5c shows Au binding energies with doublet peaks at 83.8 and 87.4eV thus denoting the Au state of Au4f7/2 and Au4f5/2, respectively. This shows that gold ions are completely converted into metallic Au0, leading to the formation of CSNPs. Interestingly, the spectrum did not show any detectable Cl2p signal42 which further proved the complete reduction of Au onto the surface of Nk (Fig. 5d). The O1s peak showed in Fig. 5e confirmed the presence of oxygen atoms43. The C1s signature markers of carbon atom binding energy at 284.7 eV were taken as a reference (Fig. 5f)43. Therefore, XPS pattern was in good agreement with XRD data, TEM-EDS and line scanning results.
Figure 5. Elemental analysis of Nk@A by XPS which clearly shows the presence of elements such as Fe, Co, Au, C, O and absence of Cl.
Tethering folic acid linker and Doxorubicin molecules on Nk@A
UV-Visible absorption spectra of different iterations of Nk@A were performed as seen in Fig. 6a. As the number of gold iterations on Nk increased from one to three, there was a bathochromic shift of surface plasmon resonance peak (SPR) from 541 to 546 nm. In addition, as the iteration increased from three to five, this SPR peak further shifted from 546 to 551 nm. This bathochromic shift in the SPR peak was related to the increment in the thickness of gold shells on the surface of the magnetic core18. Moreover, as iterations increased, the charge density and the amplitude of the free electron oscillation inside the particles also increased. This may be due to the increased surface coating of CTAB, thus causing enhanced plasmonic absorption44. The spectra of Nk and Au seeds are also shown in Figure S2 in the †ESI. UV-Visible spectra of FA attached Nk@A (Fig. 6b) shows distinct peaks at 280.8 and 375.2 nm, which are signature markers of FA. Accordingly, there was a bathochromic shift in the SPR peak after FA attachment which showed a peak at 562.4 nm; this shift confirmed that FA formed a complex with Nk@A45. Dox attachment was confirmed from the peak (inset) at 490.7 nm with minor red-shift of Nk@A peak (538.9 nm) and slight blue-shift of the FA attachment (268.7 & 375.2 nm). These shifts ensured the formation of the Dox-FA-Nk@A complex, which is shown in Fig. 6c.
Figure 6.
(a) UV-Visible absorption spectra showing different iterations from 1–5 with the red shift of Au peak representing the increment of nanoshell, UV-Vis spectra of (b) FA functionalization, (c) binding of Dox onto FA-Nk@A.
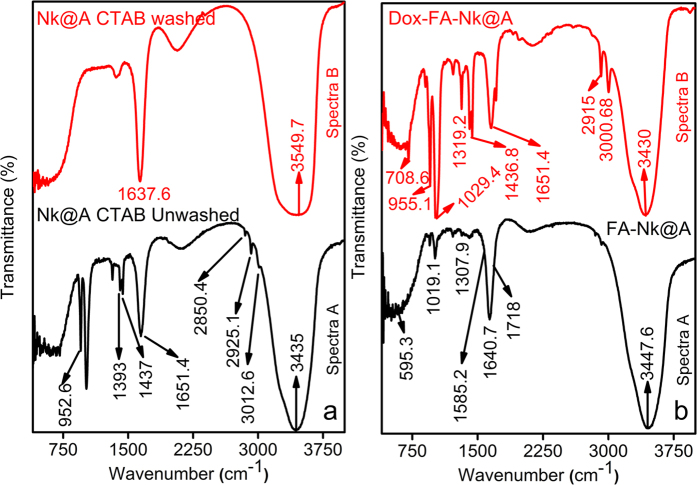
FTIR spectra of functional organic markers on the surface of Nk@A is shown in Fig. 7a. Spectra A represented only CTAB peaks (Table S2 in the †ESI)46, which proved that there was an excess amount of CTAB in the solution. However, spectra B which was analyzed after repeated centrifugation and washing the Nk@A solution, showed a minor peak of CTAB which stabilizes the Au shell (Table S2 in the †ESI). This was also demonstrated from its cytocompatibility towards L6 cells, which was evident from MTT assay and confocal microscopy studies.
Figure 7.
FTIR spectra of (a) Nk@A with CTAB before and after washing, (b) The attachment of FA and Dox onto Nk@A.
Figure 7b shows FTIR spectra of FA-Nk@A and Dox-FA-Nk@A. Spectra A represents both activated FA, which show bands at 1640.7 cm−1 and 1718 cm−1 expressing –CH stretch and –NH stretch, respectively. FA conjugation to Nk@A was confirmed from –NH and –CH stretch; while the asymmetric stretching of primary amines –NH and bending vibrations of –CO confirmed the formation of amide linkage between FA and Nk@A at 1585.2 cm−1 47. Spectra B represents the attachment of Dox moieties onto FA-Nk@A. The interaction between these molecules was via amide linkage, which involved –NH amino group of FA and –COOH carboxylic group of Dox. Bands representing these attachments were 1436.8 cm−1 that represents anhydride =CO stretch and 1651.4 cm−1 denotes amide stretch of =CO. The peak at 2915 cm−1 was a classic peak of secondary –NH2 bending, and peak at 3000.68 cm−1 corresponded to primary –NH2 bending47.
TGA analysis was carried out for all samples in the temperature range of 30–900 °C under N2 flow atmosphere and any change in % weight loss was recorded. TGA graph (Figure S3b in the †ESI) shows Nk, Nk@A, FA-Nk@A, Dox-FA-Nk@A, activated FA and Dox. Initially, activated FA and Dox showed a gradual weight loss from 30 to 100 °C. The degradation of these moieties was rapid because they are completely organic in nature. Nk showed a rapid degradation at 122 °C, which was due to the complete evaporation of water molecules. Then, there was a solid plot up to 555 °C and a drop at 728 °C followed by a slow degradation of bound chlorides and hydroxides. In the case of Nk@A, the initial weight loss from 30 to 288 °C was due to the complete desorption of water and CTAB molecules from the surface48. The second degradation, from 289 to 595 °C, was a result of the covalent interaction of CTA+ ions; the final degradation at a higher temperature, from 596 to 900 °C was most likely due to the electrostatic interaction of the ammonium group from CTAB attached to the Au NPs surface49. In FA-Nk@A complex, the weight loss in the range of 30–100 °C was due to the desorption of intercrystalline water molecules. The second degradation, in the range of 101–750 °C, was due to FA covalent attachment, which was seemingly induced by the disintegration of groups like hydroxyl, carboxyl and amino groups present in FA50. Dox-FA-Nk@A complex initially showed degradation of water moieties and weak surface interactions of hydrogen with the Nk@A. The second decomposition from 96 to 740 °C, was due to the decomposition of FA and Dox from the NPs complex and the decomposition from 741 to 900 °C is due to slow degradation of Nk@A51.
Intracellular localization of Dox & Dox-FA-Nk@A
CryoTEM analysis confirmed Nk@A internalization and endocytic cavities that contained NPs (Fig. 8a,b) with aggregation, as the pH was acidic. This observation gave an insight towards the mechansim of receptor-mediated endocytosis of Nk@A, which can be attributed to FA and folate receptor interactions52. Moreover, the cellular uptake of NPs is also dependent on the surface charge. Zeta potential (ζ) values for Nk, Nk@A, FA-Nk@A and Dox-FA-Nk@A complex were in the range of +11.9 to +12.1 mV, +33.4 to +37.7 mV, −35.9 to −38.4 mV, +16.8 to +19.4 mV, respectively (Figure S3c in the †ESI)53,54,55. This charge dependency is due to the stability of the complex, which conciliates the harsh physiological milieu, such as in the bloodstream or inside the cell. The mechanism of cellular uptake for positively charged nanoparticles is interaction of the positive moieties with the negatively charged cell surface56. Rotello and coworkers studied the effect of surface charge on the stability of amine functionalized gold nanoparticles. It was found that net positive charge caused more displacement of ligands in extracellular57 and intracellular environments58.
Figure 8.
In-vitro cellular uptake of Nk@A (a) CryoTEM image showing the uptake of Nk@A by Hep2 cells, (b) magnified view of vesicles showing the cluster of Nk@A entry by the process of endocytosis.
The tracking of Dox-FA-Nk@A inside the cells was performed using confocal microscopy. Hep2 cell lines were incubated only with Dox (without any fluorescent dye, since Dox itself is a good bioimaging agent) and it showed the internalization. Initially, Dox was distributed all over the cytoplasm (Figure S4a in the †ESI) and cellular membrane, but after 24 h of incubation, the Dox signal in nucleus was very high due to the migration of Dox to this compartment and its release promoted by internal pH changes (Figure S4b in the †ESI). This confirmed that the binding of Dox molecules to the nuclei by intercalating into DNA leads to inhibition of macromolecular biosynthesis59.
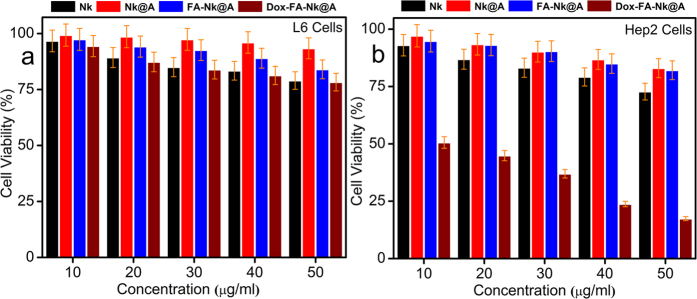
In order to assess the cell viability, MTT assay was carried out by incubating L6 and Hep2 cells with Nk, Nk@A, FA-Nk@A and Dox-FA-Nk@A for 24 h in the concentration range of 10–50 μg/mL (Fig. 9a,b). Even though the concentrations of all the above complexes increased to 50 μg/ml, there was not much cytotoxicity observed for L6 cells. Similarly, Hep2 cells also showed less cytotoxicity when exposed to Nk, Nk@A and FA-Nk@A at concentrations as high as 50 μg/ml. However, the Hep2 cell viability started decreasing rapidly when the concentration of Dox-FA-Nk@A was increased from 10 to 50 μg/ml. This may be due to the overexpression of folate receptors on the surface of Hep2 cells, which increases receptor mediated endocytosis and overall cellular uptake60.
Figure 9.
MTT assay of (a) L6 cells, (b) Hep2 cells with Nk, Nk@A, FA-Nk@A showing no apoptosis even at higher concentrations but Dox-FA-Nk@A treated L6 cells showing very negligible cell death and Hep2 cells showing more than 80% cell death at high concentrations.
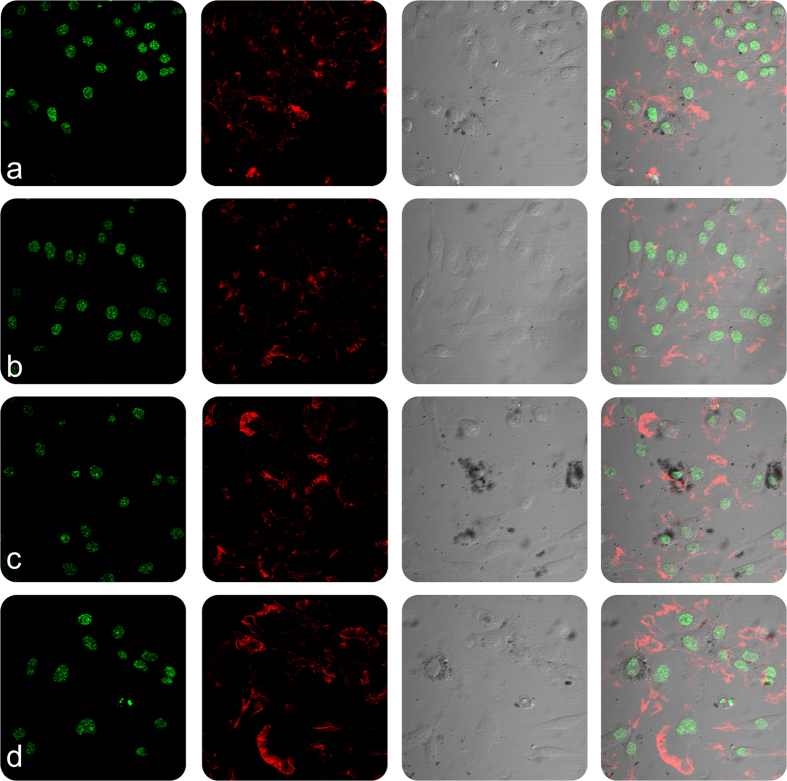
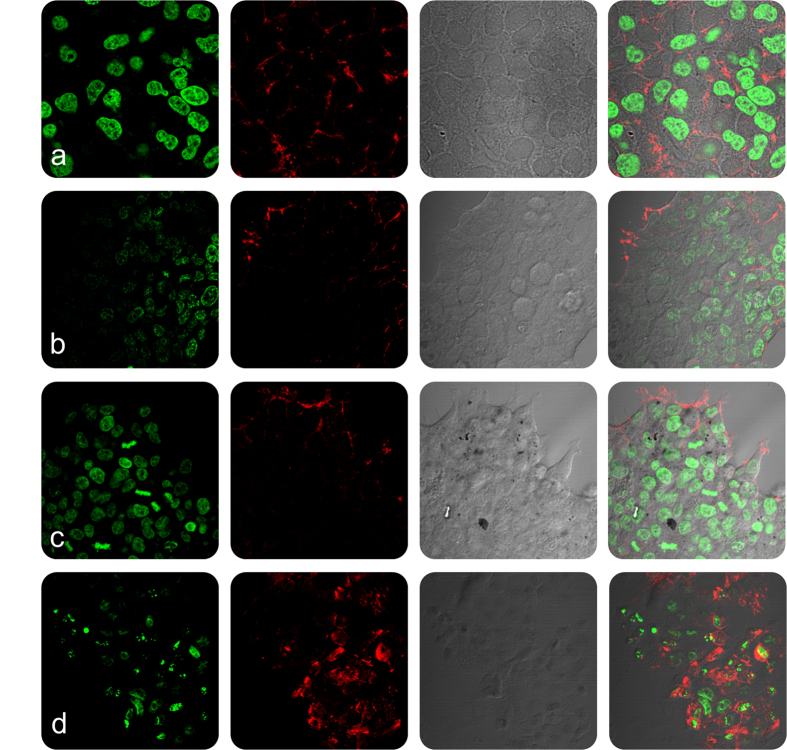
In order to evaluate the cellular and nuclear morphology of L6 and Hep2 cells on incubation with Nk, Nk@A, FA-Nk@A and Dox-FA-Nk@A, the cells were examined using confocal microscopy (Figs 10 and 11). The morphology of cells treated with Nk, Nk@A and FA-Nk@A did not show any noticeable change in both L6 and Hep2 cells. The activity of Dox-FA-Nk@A, illustrated in Fig. 10(d), showed no effect on L6 cells, while Hep2 cells [Fig. 11(d)] exhibited major apoptosis caused by disruption of nuclear membrane, which leads to total cell damage. This proved that the Dox-FA-Nk@A acted as an efficient nanocargo in delivering the Dox, which finally causes cell death. The increased cytotoxicity of Dox-FA-Nk@A can be due to the active transport of Dox by receptor-mediated endocytosis mechanism as compared to the passive diffusion of free Dox into the cells61.
Figure 10.
Confocal microscopy study representing the morphology of L6 cells treated with nanoparticles for 24 h (a) Nk, (b) Nk@A, (c) FA-Nk@A, (d) Dox-FA-Nk@A which shows no cell death even at higher concentration of nanoparticles (Scale bar-20 μm).
Figure 11.
Confocal microscopy study representing the morphology of Hep2 cells treated with nanoparticles for 24 h (a) Nk, (b) Nk@A, (c) FA-Nk@A which shows negligible cell death but (d) Dox-FA-Nk@A clearly shows the increased cell death at higher concentration of nanoparticles (Scale bar-20 μm).
In-vitro Dox release kinetics
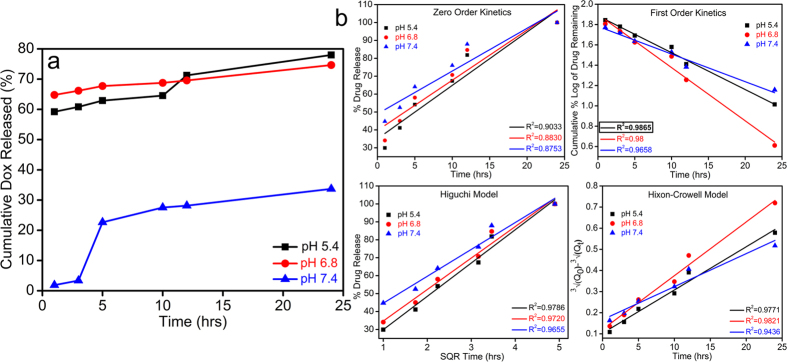
The in-vitro drug release behavior of Dox-FA-Nk@A was assessed by using 3 different pH of PBS buffers (5.4, 6.8 & 7.4) for 24 h. We determined that the NPs system was both pH dependent and site-specific; which made it as a unique drug delivery system for cancer therapy. As pH decreased in the cellular organelles, thereby increasing the release of drugs as seen in Fig. 12a. The cumulative release of Dox at 3 different pH after 24 h was 77.9% at pH 5.4, 74.6% at pH 6.8, and 33.6% at pH 7.4, thus confirming pH-dependent release mechanism. The pH 7.4 mimics normal physiological pH; hence, drug release is minimum. Moreover, the tumor microenvironment exhibits a pH of 6.862,63 where drug release is comparatively more, which occurs due to the partial dissociation of the amide bonds between FA and Dox molecules. The complex showed maximum amount of drug release at pH 5.4. This pH is a signature marker of endosomal acidic pH consequently leading to the dissociation of the drug from the complex by breaking the amide bond between FA and Dox molecules. Moreover, Dox becomes highly water-soluble as well as hydrophilic at lower pH as compared to neutral pH. Hence, Dox is in its inactive form in normal tissues at neutral pH, while it gains its activity in cancerous tissue at lower pH64.
Figure 12.
(a) Cumulative release of Dox at 3 different pH, (b) Various plots representing different fitting in kinetic models of drug release.
These results were fitted to different drug kinetic models such as zero order kinetics, first order kinetics, Higuchi model and Hixon-Crowell model (Fig. 12b). The drug release followed first order rate kinetics model which was attributed to the high regression coefficient value (R2 = 0.9865). This confirms that the drug release is pH as well as concentration dependent mechanism.
Magnetic Resonance Imaging in normal and cancerous cells
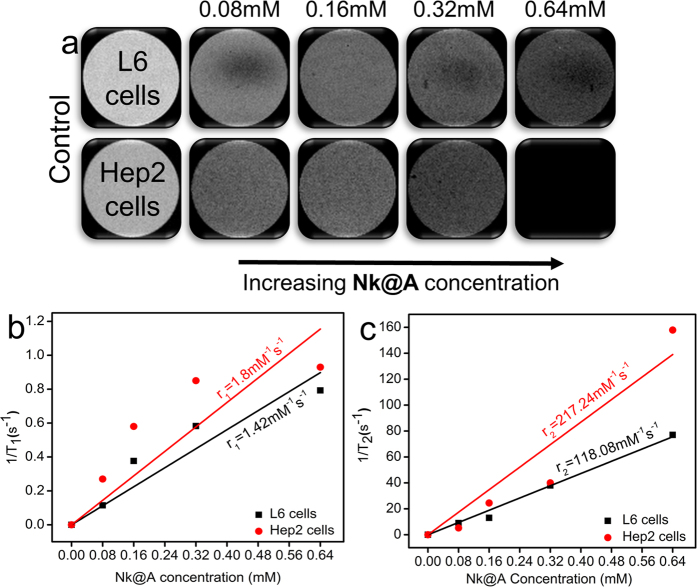
Nk@A was employed as an efficient MR imaging contrast agent. It was cultured with both L6 and Hep2 cells. The cells were harvested and then resuspended in PBS with agar gel. These agar phantoms were used to evaluate the T1 and T2-weighted images shown in Fig. 13a (only T2-weighted images). As the concentration increased from 0.08–0.64 mM of Nk@A, there was an increment in T2-weighed image, which became darker with both cells. The linear relationship was calculated in order to obtain the longitudinal relaxivity r1 and transverse relaxivity r2 of both L6 and Hep2 cells incubated with Nk@A (Fig. 13b,c). The r1/r2 and r2/r1 values were calculated and are shown in Table S3 in the †ESI. We found that the r2/r1value of L6 was 83.15 and for Hep2 it was 120.68. This was much higher than r1/r2 of both, which confirmed that Nk@A were efficient T2 contrast agent as compared to T1. But in the previous report for CoFe2O4@Au, r2/r1value was around 3321. So, we concluded that the increment in the r2/r1 value was mainly due to Au iterations.
Figure 13.
(a) T2 contrast image of Nk@A as the concentration increases the darkening effect also increases depending upon the type of cells, (b) r1, (c) r2 relaxivity values of Nk@A incubated with L6 and Hep2 cells.
The r2 value of Nk@A with L6 was 118.08 mM−1s−1 and Hep2 was 217.24 mM−1s−1. This is highly comparable to the clinically used MRI contrast agent such as Feridex 105 mM−1s−1 65, which shows noticeable changes after injecting iron oxide NPs66. Therefore this confirmed that the Au nanoshell around Nk did not play a role in Nk core spin67. But the r2 value with Hep2 cells showed significant increment when compared to L6 cells because of gold iterations. The other reason might be the uptake of gold coated magnetic NPs by cancerous cells was higher than that of normal cells68 because the electrostatic interactions of surface charge from gold coating cause more interaction with the cell69. Finally, we demonstrated that the Nk@A can be effectively used as an efficient T2 contrast agent.
Microwave based Hyperthermia therapy
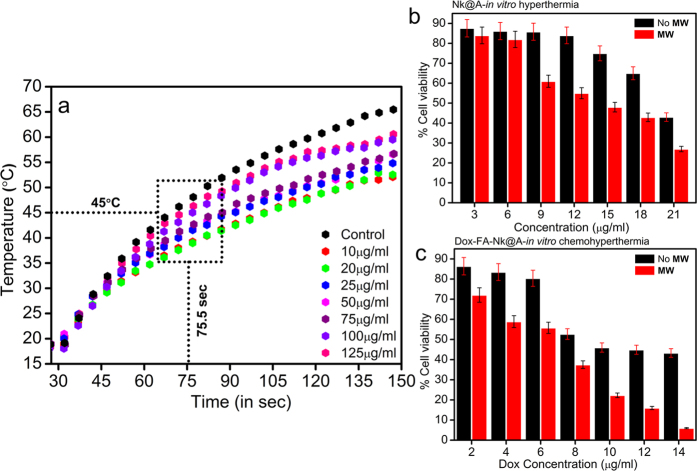
Hyperthermia therapy involves increase in the temperature of tissues or cells, so that they become more susceptible to anti-cancer drugs. Nk@A nanoparticles were tested as a hyperthermal agent under microwave (MW) irradiation by using a microcoaxial double slot antenna as an applicator. The increment of temperature as a function of time was measured under ISM (Industrial, Scientific and Medical) approved frequency of 2.45 GHz in order to induce localized hyperthermia. The applicator was inserted in the phosphate buffered saline (PBS) containing Nk@A of various concentrations (10–125 μg/ml) and the increment of temperature was measured by using noninterfering fiber optic probes. The MW was irradiated using a home-made setup70 for 150 sec at 6 W. Interestingly, the temperature increment was very rapid and reached 45 °C in around 75 sec, which was enough to kill cancer cells; the temperature raised upto 50–60 °C within 150 sec for Nk@A (Fig. 14a).
Figure 14.
(a) Plot showing increment of temperature as a function of time with the increased concentrations of Nk@A as a potential hyperthermal agent, MTT assay of Hep2 cells (24 h) subjected to hyperthermia (50 °C for 50 sec): (b) in-vitro hyperthermia where cells treated with Nk@A which represents the killing of cells as the concentration increases by producing enough heat, (c) in-vitro chemohyperthermia where cells treated with Dox-FA-Nk@A which represents the killing as the concentration increases by producing heat and also release of Dox.
The PBS was used as a control which showed maximum rise in temperature as water has the highest absorption of MW71. This temperature increment was purely based on the Au iterations on Nks. Au nanoshell as well as superparamagnetic core led to energy increment which may be due to magnetic anisotropy72 as compared to Nks in xylene at 2.45 GHz73. The temperature increment was much higher when compared with Au@γ-Fe2O3, which was around 38 °C at 2.45 GHz in water, for 10 mins at a power of 120 W74.
In-vitro Hyperthermia and Chemo-Hyperthermia therapy
Chemo-hyperthermal effect or thermo-chemosensitization is quantified by the interaction of anti-cancer drugs with cells at elevated temperature. The thermal enhancement ratio (TER) for Dox is 1 at two different temperatures (41.5 °C versus 43.5 °C, respectively)75. There is a relationship between drug-heat interactions on cell cytotoxicity. This pharmacodynamics is responsible for enhanced killing of cells. The mechanism of thermal enhancement for drug cytotoxicity includes enhanced drug uptake as well as DNA damage and retardation of DNA repair33. There are previous studies, which reported the thermal enhancement of cellular cytotoxicity when drug interaction with cells takes place at higher temperatures76. In this report, an increase in Nk@A concentration shows an increased cell mortality in addition to MW radiation exposure for 50 sec. The cells interacting with increased Nk@A concentration, but without any exposure to MW irradiation (Fig. 14b), showed comparatively lesser mortality than the exposed ones. Both Au shell and superparamagnetic core absorb MW, due to which hyperthermia is induced in the cells, thus consequently leading to cell death. The viability of Hep2 cells was suppressed more by Dox-FA-Nk@A when exposed to microwave as compared to unexposed ones (Fig. 14c). The Dox concentration was considered based on its half-maximal inhibitory concentration (IC50) value of 12.5 μg. Hence, here the Dox tethered Nk@A concentration was in the range of 2–14 μg/ml. The IC50 value of Dox-FA-Nk@A-MW was 8 μg as compared to the IC50 value of Dox-FA-Nk@A, which is 12 μg. This clearly shows thermal enhancement of Dox cytotoxicity at lower IC50 values in comparison with Dox alone. Hence, Dox orchestrated Nk@A efficiently inhibited the cell viability at elevated temperatures and very low concentrations of Dox, thus improving the therapeutic proficiency along with minimum side-effects. Concurrently, this combined therapy shows efficient synergism, thus exhibiting inimical effect on Hep2 cells.
In summary, we have developed SPR enhanced Nk@A by multiple iterative method, which proved to be a promising nanomaterial with multifunctional properties specifically in the field of cancer nanotheranostics. These multiple iterations provided a new platform for high surface functionalization. This helped in the efficient delivery of drugs, following first order rate kinetics. This Nk@A was also used as a competent MRI contrast agent and proved to be an effective T2 agent with high relaxivity values in the presence of both L6 and Hep2 cells. Finally, Nk@A was used as a hyperthermal agent. In an in-vitro study using Hep2 cells, both Nk@A and Dox-FA-Nk@A on exposure to microwave irradiation using 2.45 GHz for 50 sec showed cell mortality. It was found that there is an enhancement of cell mortality when MW based hyperthermia collates with Chemotherapy. With this efficiency, Nk@A can be used for potential applications as a single nanomaterial for 3 different uses, from tracking, diagnosing to therapeutics.
Materials and Methods
Materials
Ferric (III) chloride (FeCl3•6H2O, 97%), Cobalt (II) nitrate hexahydrate (CoN2O6•6H2O, 99.999%), sodium hydroxide (NaOH, >98%), Gold (III) chloride trihydrate (HAuCl4.3H2O, ≥99.9%), L-Ascorbic acid (AA) (C6H8O6, ≥99.0%), Dimethyl sulfoxide (DMSO) (CH3SOCH3, ≥99.9%), Sodium chloride (NaCl, ≥99.5%), Hexadecyltrimethylammonium bromide (CTAB) (CH3(CH2)15N(Br)(CH3)3, ≥99.0%), Folic acid (FA) (C19H19N7O6, ≥97%), N-Hydroxysuccinimide (NHS) (C4H5NO3, 98%), N,N′-Dicyclohexylcarbodiimide (DCC) (C6H11N=C=NC6H11, 99%), Triethylamine (TEA) ((C2H5)3N, ≥99%), Doxorubicin hydrochloride (Dox) (C27H29NO11•HCl), MTT [3-(4,5-dimethylthiazol-2-yl) 2,5-diphenyltetrazolium bromide], Hoechst Stain solution, Phalloidin–Tetramethylrhodamine B isothiocyanate, and ethanol (CH3CH2OH, ≥99.8%) were purchased from Sigma-Aldrich (Mexico). Dulbecco’s Modified Eagle Medium (DMEM), fetal bovine serum (FBS), and streptomycin were obtained from Gibco, Life Technologies. Agarose (UltraPure, Agarose) was purchased from Invitrogen, Thermo scientific. Deionized water (DI) was used for all experiments. All chemicals were used directly without any further purification.
Synthesis of Cobalt ferrite (Nk) and gold-coated Nk (Nk@A) NPs
Nk preparation
Magnetic Nk were synthesized using co-precipitation method. The precursors 0.5 M of ferric (III) chloride and 0.25 M of cobalt (II) nitrate hexahydrate were taken in the ratio of 1:0.5 and in order to avoid the precipitation of the salts, they were initially dissolved separately in 10 ml of nitrogen (N2) degassed DI water and mixed with 1.5 M solution of 40 ml NaOH, which was used as a reducing agent. The entire synthesis process was carried out under N2 atmosphere for 1.5 h at 80 °C (pH 12). The black resultant precipitate was separated using a strong magnet and it was washed 3 times with DI water. This pure Nk were further used for Nk@A formation.
Nk seed preparation
200 μl of synthesized Nk was centrifuged and dispersed in 1 ml of DI water (pH adjusted to 7). Then, 400 μl of DMSO was added and the mixture was stirred continuously under N2 atmosphere at 75 °C for 3 h to reduce the aggregation of NPs.
Preparation of gold seed solution
Au coating was carried out for 5 iterations, 5 aliquots of gold seed solution were prepared freshly by mixing 0.5 ml (1 M) of CTAB, 1 ml (50 mM) of ascorbic acid, and 100 μl (1M) of HAuCl4 solution. This solution complex mixture was sonicated for 15 mins. The golden yellow color immediately changed to a milky orange color and then to a milky white color (Figure S1b, (b*) in the †ESI).
Synthesis of Nk@A CSNPs
The seed solution of Nk and gold were used to synthesize Nk@A. In this case, the ratio of 1:5 was taken. This was because we had already optimized the ratio with 1:5, 1:7, and 1:9 and found that 1:5 was appropriate for the Nk@A. Initially, 1 part of milky white colored gold seed solution was added dropwise to the faint brown-colored Nk seed solution. This solution mixture was stirred for 2 h continuously until the brown colored solution turned into purple. Then, the gold iteration was continued for 5 times for every 2 h. Finally, a dark purple color Nk@A solution was obtained. Then, these Nk@A were magnetically separated (after each iteration) by magnetic separation technique and they were washed twice with a mixture of hexane and ethanol to obtain high purity NPs excluding excess gold NPs. The washed NPs were centrifuged again twice to remove excess CTAB from the solution.
FA Activation and attachment to Nk@A
Activated FA was used for the attachment onto the surface of Nk@A. The reason behind the activation of FA was to activate the carboxylate group. This was carried out by dissolving FA (0.25 g) into 20 ml of DMSO which was subjected for 1 h sonication to ensure complete dispersion. Later, carboxylate group present in FA was activated by mixing 0.125 gm of DCC and 0.225 gm of NHS. The complete reaction was carried out under N2 atmosphere at 30 °C for 12 h (FA/DCC/NHS molar ratio 2:1:2). The resultant product was filtered using Whatman filter paper; then it was further used for attach onto Nk@A.
Activated FA was used to attach onto the Nk@A. This attachment was carried out by mixing 1ml of activated FA and 10 ml of Nk@A under N2 atmosphere and stirring the mixture continuously for 5 h. Then, N2 atmosphere was detached and the reaction was continuously stirred for 24 h. Finally, this reaction mixture was filtered using Whatman filter paper. Then the process of dialysis was carried out to eliminate unreacted FA using a 3000 kDa dialysis membrane in PBS (pH 7.4). After centrifugation, the pellet was again dialyzed in DI water for a period of 24 h. The activated FA binding onto the surface of Nk@A was studied using UV-Vis spectroscopy analysis.
Synthesis of Dox-FA-Nk@A CSNPs complex
Anthracycline antibiotic Dox was used to kill cancerous cells using FA-Nk@A. Activated FA functionalization on Nk@A acted as an anchor for the binding of Dox. To bind Dox, 5 ml FA-Nk@A was mixed with 1ml of TEA and ml of DMSO as a solvent; finally, 400μl of 2.36 mM Dox solution were added. This mixture was purged using N2 gas under continuous stirring at 60 °C for 5 h. The final complex solution was dialyzed to remove the unbound or excess of Dox. The Dox binding was studied by characterization techniques, like FTIR and UV-Vis spectroscopy.
Dox loading efficiency and in-vitro Dox release
Before initiating the drug release studies, it was very significant to determine the Dox loading efficiency because the exact amount of Dox bound onto FA-Nk@A complex was so decisive to calculate the proper drug delivery study (in the †ESI). Dox release studies were carried out by dialysis process. Drug release study was determined at 3 different PBS at 37 °C in an incubator of pH 5.3, 6.8 and 7.4 with continuous stirring to simulate the intercellular, intracellular and external environment of cancer cells. To carry out this study, 2 ml of dialyzed Dox-FA-Nk@A complex was used. Then, 1ml of sample was withdrawn from the system every 40mins to determine the drug content. To compensate the PBS solution as soon as 1ml was drawn, it was replaced with the same equivalent volume. The amount of Dox released was determined using UV-Vis spectrophotometer at 485nm which was the signature absorbance of Dox. All the experiments were repeated thrice for all the samples. This drug release study was also explained with different drug kinetics models in order to explain the release mechanism.
Characterization
UV-Vis spectroscopy
UV-Vis spectra was obtained using Shimadzu Corporation UV-2401PC UV-Vis spectrometer.
X-Ray diffraction (XRD) measurement
The crystallinity of the Nk and Nk@A were recorded by using X’Pert PRO XRD spectrometer (PANalytical B.V., Holland) from 10 to 80° (2θ value) using Cu K-α radiation (0.15418 nm).
Fourier transform infrared (FT-IR) spectroscopy
FT-IR spectra were obtained on a Nicolet iS50 FT-IR Spectrometer (Thermo Scientific).
Thermogravimetric analysis (TGA)
Thermal analysis was carried out for liquid samples using a TGA Q50 (TA Instruments) from 30 to 900 °C under nitrogen flow with a heating rate of 10 °C/min.
High Resolution Transmission electron microscopy (HRTEM)
TEM images were taken on a HRTEM (JEOL, JEM-ARM200F) equipped with HAADF-STEM (high-angle annular dark-field scanning transmission electron microscopy) detector and Oxford XMax 80 Energy Dispersive X-Ray Spectrometer (EDS). The sample was prepared in such a way that aggregation in the grid was avoided. Then, 10 μl of sample were dispersed in 100 μl of isopropanol, which was sonicated for 30 mins; then a drop of sonicated nanoparticle dispersion was placed onto the amorphous carbon-coated 200 mesh copper grid (Ted Pella, Inc.). Finally, the sample was allowed to dry at ambient temperature before it was loaded into the microscope.
CryoTEM
The internalization of NPs inside the cells was confirmed by cryoTEM analysis. 5 μl of Nk@A nanoparticle suspensions were made into a thin liquid film which was prepared on lacy carbon grid (Pelco, USA) and then quenched into liquid ethane to freeze the sample using a Leica EM-CPC chamber. Tecnai F20 (FEI) operated at 200 kV to obtain the images which were recorded with a USC1000 slow scan CCD camera (Gatan) at 50000x.
X-Ray photoelectron spectroscopy (XPS) Analysis
XPS analysis were performed using a K-Alpha X ray Photoelectron Spectrometer (XPS) System (Surface Analysis, Thermo Scientific). Monochromated, Micro-focused Al Kα was used as an X-ray source type. The binding energy of C1s carbon at 284.7 eV was used for calibration.
Magnetic measurements
Nk and Nk@A magnetic properties were measured using a superconducting quantum interference device (SQUID), (Quantum Design, MPMS3). The magnetization hysteresis of the samples was obtained by changing H between +70 to −70 kOe at 3 different temperatures, like 5 K, 300 K and 312 K. The hysteresis of the samples was also obtained at 100 kOe using a temperature interval from 1.8 to 312 K.
Zeta potential measurements
The zeta potential values were determined by using a Zetasizer Nano ZS90 (Malvern instruments) at 25 °C at a wavelength of He-Ne laser 633 nm, Max 4 mW at a scattering angle of 90° using a Universal ‘dip’ cell kit. Data were obtained using a monomodal acquisition according to the Smoluchowski theory. The measurements were repeated 3 times. Before the analysis the samples were well sonicated for 1 h to avoid aggregation.
Magnetic Resonance Imaging (MRI) experiments
MR imaging was performed with a 7T clinical Signa HDxt scanner (Varian). T2-weighted images were acquired using the following parameters: 7T, Repetition time TR = 2000 ms, fast spin echo, FOV = 3*3 cm, Echo time TE = 15–250 ms, slice thickness = 4 mm and resolution 256 × 256 points. For T1 measurements, coronal spin-echo sequences with fixed echo time (TE) = 24 ms and varying repetition time (TR) (25 ms to 4 s) were used. Nk@A suspensions was taken at varying concentrations.
Microwave (MW) experiment setup
The setup used to apply the MW electromagnetic field to perform the experiments consisted of a generator (SML 03, Rhode & Schwarz, Germany) set to a frequency of 2.45 GHz. This signal was then amplified using an RF & MW module power amplifier (1164-BBM3Q6AHM, Empower, USA). The output power was then monitored through the use of a dual direct coupler (DC7154M, Amplifier Research, USA) and a power meter (PM2002, Amplifier Research, USA) to ensure an output power of 6W and to monitor the reflected power of the system. To adjust the standing wave ratio (SWR) to an optimal value, a coaxial stub tuner (1878C, Maury Microwave Corp., USA) was used along a network analyzer (E5071B, Agilent Technologies, USA) to measure and reduce the SWR to a minimum prior to each experiment.
Temperature Measurements
Non electromagnetic interfering optical fiber probes temperature sensors (M3300, Luxtron, USA) were used to record temperature increment. The temperature was measured inside the PBS. Each test lasted 200 sec in order to study the temperature response as a function of time. The temperatures were recorded every second during the experiments using True Temp software (Luxtron, USA).
Confocal Imaging
Z-series confocal images were collected using Zeiss LSM 700 confocal microscope fitted with a 40X oil-immersion lens. Images were processed using Zen 2012 software.
All the above analysis and characterization techniques used liquid sample (FTIR, TGA, UV-Vis spec, HRTEM, Zeta potential, Flow cytometry analysis), powder form (SQUID), and thin film (XRD).
Additional Information
How to cite this article: Ravichandran, M. et al. Plasmonic/Magnetic Multifunctional nanoplatform for Cancer Theranostics. Sci. Rep. 6, 34874; doi: 10.1038/srep34874 (2016).
Supplementary Material
Acknowledgments
We are highly obliged to CONACyT project 168577. The authors thank Rafael Lara for carrying out MRI and relaxivity measurements, Carlos Vazquez Calzada for performing confocal microscopy. We would also like to thank Dr. Sergio Armando Tomas for XPS analysis and acknowledge CONACyT Project 205733, Jaime E Lara for carrying out hyperthermia techniques, Marcela Guerrero for XRD & FTIR analysis, Alvaro Angeles Pascual for HRTEM & HAADF-STEM analysis.
Footnotes
Author Contributions M.R. and G.O. conceived and designed the experiments, M.R. performed the experiments, analysed and wrote the manuscript text, F.G.-S. evaluated the results for cytotoxicity experiments, N.B.A. performed all the cellular experiments, A.V. and L.L. interpreted hyperthermia results, M.A.G.-N. carried out SQUID analysis and interpreted them, G.O., S.V. and J.T.R. reviewed the manuscript.
References
- Parkin D. M., Pisani P. & Ferlay J. Global Cancer Statistics: 2011. CA Cancer J Clin. 49, 1,33–64 (1999). [DOI] [PubMed] [Google Scholar]
- Lévy M. et al. Magnetically induced hyperthermia: size-dependent heating power of γ-Fe2O3 nanoparticles. J. Phys. Condens. Matter 20, 204133 (2008). [DOI] [PubMed] [Google Scholar]
- Cho K., Wang X., Nie S., Chen Z. G. & Shin D. M. Therapeutic nanoparticles for drug delivery in cancer. Clin. Cancer Res. 14, 1310–1316 (2008). [DOI] [PubMed] [Google Scholar]
- Shah J. et al. Photoacoustic imaging and temperature measurement for photothermal cancer therapy. J. Biomed. Opt. 13, 034024 (2008). [DOI] [PMC free article] [PubMed] [Google Scholar]
- Zhang L., Dong W. F. & Sun H. B. Multifunctional superparamagnetic iron oxide nanoparticles: design, synthesis and biomedical photonic applications. Nanoscale 5, 7664–7684 (2013). [DOI] [PubMed] [Google Scholar]
- Beji Z. et al. Magnetic properties of Zn-substituted MnFe2O4 nanoparticles synthesized in polyol as potential heating agents for hyperthermia. Evaluation of their toxicity on endothelial cells. Chem. Mater. 22, 5420–5429 (2010). [Google Scholar]
- Yang H. et al. Water-soluble superparamagnetic manganese ferrite nanoparticles for magnetic resonance imaging. Biomaterials 31, 3667–3673 (2010). [DOI] [PubMed] [Google Scholar]
- Giri J. et al. Synthesis and characterizations of water-based ferrofluids of substituted ferrites [Fe1−xBxFe2O4, B = Mn, Co(x = 0-1)] for biomedical applications. J. Magn. Magn. Mater. 320, 724–730 (2008). [Google Scholar]
- Tung L. D. et al. Magnetic properties of ultrafine cobalt ferrite particles. J. Appl. Phys. 93, 7486 (2003). [Google Scholar]
- Ekreem N. B., Olabi A. G., Prescott T., Rafferty A. & Hashmi M. S. J. An overview of magnetostriction, its use and methods to measure these properties. J. Mater. Process. Technol. 191, 96–101 (2007). [Google Scholar]
- Baldi G. et al. Synthesis and Coating of Cobalt Ferrite Nanoparticles: A First Step toward the Obtainment of New Magnetic Nanocarriers. Langmuir 23, 4026–4028 (2007). [DOI] [PubMed] [Google Scholar]
- Pita M. et al. Synthesis of cobalt ferrite core/metallic shell nanoparticles for the development of a specific PNA/DNA biosensor. J. Colloid Interface Sci. 321, 484–492 (2008). [DOI] [PubMed] [Google Scholar]
- Goon I. Y. et al. Fabrication and dispersion of gold-shell-protected magnetite nanoparticles: Systematic control using polyethyleneimine. Chem. Mater. 21, 673–681 (2009). [Google Scholar]
- Zhang Y. et al. Facile one-step synthesis of plasmonic/magnetic core/shell nanostructures and their multifunctionality. J. Mater. Chem. 22, 10779 (2012). [Google Scholar]
- Wang L. et al. Monodispersed Core-Shell Fe3O4@Au Nanoparticles . 21593–21601 (2005). [DOI] [PubMed] [Google Scholar]
- Daniel M. C. & Astruc D. Gold Nanoparticles: Assembly, Supramolecular Chemistry, Quantum-Size-Related Properties, and Applications Toward Biology, Catalysis, and Nanotechnology. Chem. Rev. 104, 293–346 (2004). [DOI] [PubMed] [Google Scholar]
- Xia Y., Gates B., Yin Y. & Lu Y. Monodispersed colloidal spheres: Old materials with new applications. Adv. Mater. 12, 693–713 (2000). [Google Scholar]
- Wang L. et al. Iron oxide–gold core–shell nanoparticles and thin film assembly. J. Mater. Chem. 15, 1821 (2005). [Google Scholar]
- Hormes J., Modrow H., Bönnemann H. & Kumar C. S. S. R. The influence of various coatings on the electronic, magnetic, and geometric properties of cobalt nanoparticles (invited). J. Appl. Phys. 97 (2005). [Google Scholar]
- Alonso-Cristobal P., Laurenti M., Lopez-Cabarcos E. & Rubio-Retama J. Efficient synthesis of core@shell Fe3O4@Au nanoparticles. Mater. Res. Express 2, 075002 (2015). [Google Scholar]
- Gallo J., García I., Padro D., Arnáiz B. & Penadés S. Water-soluble magnetic glyconanoparticles based on metal-doped ferrites coated with gold: Synthesis and characterization. J. Mater. Chem. 20, 10010 (2010). [Google Scholar]
- Lyon J. L., Fleming D. A., Stone M. B., Schiffer P. & Williams M. E. Synthesis of Fe oxide Core/Au shell nanoparticles by iterative hydroxylamine seeding. Nano Lett. 4, 719–723 (2004). [Google Scholar]
- Zhang Q. et al. Tailored synthesis of superparamagnetic gold nanoshells with tunable optical properties. Adv. Mater. 22, 1905–1909 (2010). [DOI] [PubMed] [Google Scholar]
- Caruntu D., Cushing B. L., Caruntu G. & O’Connor C. J. Attachment of gold nanograins onto colloidal magnetite nanocrystals. Chem. Mater. 17, 3398–3402 (2005). [Google Scholar]
- Oliva B. L., Pradhan A., Caruntu D., O’Connor C. J. & Tarr M. A. Formation of gold-coated magnetic nanoparticles using TiO2 as a bridging material. J. Mater. Res. 21, 1312–1316 (2006). [Google Scholar]
- Banchelli M. et al. Magnetic nanoparticle clusters as actuators of ssDNA release. Phys. Chem. Chem. Phys. 16, 10023 (2014). [DOI] [PubMed] [Google Scholar]
- Kang Y. M. et al. In vivo efficacy of an intratumorally injected in situ-forming doxorubicin/poly(ethylene glycol)-b-polycaprolactone diblock copolymer. Biomaterials 32, 4556–4564 (2011). [DOI] [PubMed] [Google Scholar]
- Octavia Y. et al. Doxorubicin-induced cardiomyopathy: From molecular mechanisms to therapeutic strategies. J. Mol. Cell. Cardiol. 52, 1213–1225 (2012). [DOI] [PubMed] [Google Scholar]
- Molyneux G. et al. Haemotoxicity of busulphan, doxorubicin, cisplatin and cyclophosphamide in the female BALB/c mouse using a brief regimen of drug administration. Cell Biol. Toxicol. 27, 13–40 (2011). [DOI] [PubMed] [Google Scholar]
- Zwicke G. L., Mansoori G. A. & Jeffery C. J. Targeting of Cancer Nanotherapeutics. Nano Rev. 1, 1–11 (2012). [DOI] [PMC free article] [PubMed] [Google Scholar]
- Torchilin V. P. Multifunctional, stimuli-sensitive nanoparticulate systems for drug delivery. Nat. Publ. Gr. 13 (2014). [DOI] [PMC free article] [PubMed] [Google Scholar]
- Dobson J. Magnetic nanoparticles for drug delivery. Drug Dev. Res. 67, 55–60 (2006). [Google Scholar]
- Issels R. D. Hyperthermia adds to chemotherapy. European journal of cancer 44, 2546 –2554 (2008). [DOI] [PubMed] [Google Scholar]
- Bohara R. A., Thorat N. D., Yadav H. M. & Pawar S. H. One-step synthesis of uniform and biocompatible amine functionalized cobalt ferrite nanoparticles: a potential carrier for biomedical applications. New J. Chem. 38, 2979 (2014). [Google Scholar]
- Ma L. L. et al. Growth of textured thin Au coatings on iron oxide nanoparticles with near infrared absorbance. Nanotechnology 24, 025606 (2013). [DOI] [PMC free article] [PubMed] [Google Scholar]
- Jain P. K., Xiao Y., Walsworth R. & Cohen A. E. Surface plasmon resonance enhanced magneto-optics (SuPREMO): Faraday rotation enhancement in gold-coated iron oxide nanocrystals. Nano Lett. 9, 1644–1650 (2009). [DOI] [PubMed] [Google Scholar]
- Carlà F. et al. Electrochemical characterization of core@shell CoFe2O4/Au composite. J. Nanoparticle Res. 15, 1813 (2013). [Google Scholar]
- Kong S. D. et al. Magnetically Vectored Nanocapsules for Tumor Penetration and Remotely Switchable On-Demand Drug Release. Nano Lett. 10, 5088–5092 (2010). [DOI] [PubMed] [Google Scholar]
- Li P., Jiang E. Y. & Bai H. L. Fabrication of ultrathin epitaxial γ-Fe2O3 films by reactive sputtering. J. Phys. D. Appl. Phys. 44, 075003 (2011). [Google Scholar]
- Barbieri A., Weiss W., Van Hove M. A. & Somorjai G. A. Magnetite Fe3O4(111): surface structure by LEED crystallography and energetics. Surf. Sci. 302, 259–279 (1994). [Google Scholar]
- Mosivand S. & Kazeminezhad I. Synthesis of electrocrystallized cobalt ferrite nanopowders by tuning the cobalt salt concentration. RSC Adv. 5, 14796–14803 (2015). [Google Scholar]
- Shi Y. et al. Selective decoration of Au nanoparticles on monolayer MoS2 single crystals. Sci. Rep. 3, 1839 (2013). [DOI] [PMC free article] [PubMed] [Google Scholar]
- Liu B. et al. Synthesis of patterned nanogold and mesoporous CoFe2O4 nanoparticle assemblies and their application in clinical immunoassays. Nanoscale 3, 2220–2226 (2011). [DOI] [PubMed] [Google Scholar]
- Xu Z., Hou Y. & Sun S. Magnetic Core/Shell Fe3O4/Au and Fe3O4/Au/Ag Nanoparticles with Tunable Plasmonic Properties. J. AM. CHEM. SOC 129, 8698–8699 (2007). [DOI] [PubMed] [Google Scholar]
- Shi X., Thomas T. P., Myc L. A., Kotlyar A. & Baker J. R. Synthesis, characterization, and intracellular uptake of carboxyl-terminated poly(amidoamine) dendrimer-stabilized iron oxide nanoparticles. Phys. Chem. Chem. Phys. 9, 5712–5720 (2007). [DOI] [PubMed] [Google Scholar]
- Baruah B. & Kiambuthi M. Facile synthesis of silver and bimetallic silver–gold nanoparticles and their applications in surface-enhanced Raman scattering. RSC Adv. 4, 64860–64870 (2014). [Google Scholar]
- Pandey S. et al. Folic acid mediated synaphic delivery of doxorubicin using biogenic gold nanoparticles anchored to biological linkers. J. Mater. Chem. B 1, 1361 (2013). [DOI] [PubMed] [Google Scholar]
- Gordel M. et al. Post-synthesis reshaping of gold nanorods using a femtosecond laser. Phys. Chem. Chem. Phys. 16, 71–78 (2014). [DOI] [PubMed] [Google Scholar]
- Rai A., Prabhune A. & Perry C. C. Antibiotic mediated synthesis of gold nanoparticles with potent antimicrobial activity and their application in antimicrobial coatings. J. Mater. Chem. 20, 6789 (2010). [Google Scholar]
- Wortmann L. et al. Bioconjugated iron oxide nanocubes: synthesis, functionalization, and vectorization. ACS Appl. Mater. Interfaces 6, 16631–16642 (2014). [DOI] [PubMed] [Google Scholar]
- Mewada A., Pandey S., Thakur M., Jadhav D. & Sharon M. Swarming carbon dots for folic acid mediated delivery of doxorubicin and biological imaging. J. Mater. Chem. B 2, 698–705 (2014). [DOI] [PubMed] [Google Scholar]
- Mellman I. Endocytosis and Molecular Sorting. Annu. Rev. Cell Dev. Biol. 12, 575–625 (1996). [DOI] [PubMed] [Google Scholar]
- Chen H. et al. Drug loaded multilayered gold nanorods for combined photothermal and chemotherapy. Biomater. Sci. 2, 996 (2014). [DOI] [PubMed] [Google Scholar]
- Wang X. et al. Folate receptor-targeted aggregation-enhanced near-IR emitting silica nanoprobe for one-photon in vivo and two-photon ex vivo fluorescence bioimaging. Bioconjug. Chem. 22, 1438–1450 (2011). [DOI] [PMC free article] [PubMed] [Google Scholar]
- Sharon M. Surface Orchestration of Gold Nanoparticles Using Cysteamine as Linker and Folate as Navigating Molecule for Synaphic Delivery of Doxorubicin. J. Nanomedicine Res. 1 (2014). [Google Scholar]
- Sandhu K. K., McIntosh C. M., Simard J. M., Smith S. W. & Rotello V. M. Gold nanoparticle-mediated transfection of mammalian cells. Bioconjug. Chem. 13, 3–6 (2002). [DOI] [PubMed] [Google Scholar]
- Chompoosor A., Han G. & Rotello V. M. Charge dependence of ligand release and monolayer stability of gold nanoparticles by biogenic thiols. Bioconjug. Chem. 19, 1342–1345 (2008). [DOI] [PubMed] [Google Scholar]
- Rosi N. L. et al. Oligonucleotide-modified gold nanoparticles for intracellular gene regulation. Science 312, 1027–1030 (2006). [DOI] [PubMed] [Google Scholar]
- Denard B., Lee C. & Ye J. Doxorubicin blocks proliferation of cancer cells through proteolytic activation of CREB3L1. Elife 2012, 1–14 (2012). [DOI] [PMC free article] [PubMed] [Google Scholar]
- Xie M. et al. Expression of folate receptors in nasopharyngeal and laryngeal carcinoma and folate receptor-mediated endocytosis by molecular targeted nanomedicine. Int. J. Nanomedicine 8, 2443–2451 (2013). [DOI] [PMC free article] [PubMed] [Google Scholar]
- Yoo H. S., Lee K. H., Oh J. E. & Park T. G. In vitro and in vivo anti-tumor activities of nanoparticles based on doxorubicin–PLGA conjugates. J. Control. Release 68, 419–431 (2000). [DOI] [PubMed] [Google Scholar]
- Estrella V. et al. Acidity generated by the tumor microenvironment drives local invasion. Cancer Res . 73, 1524–1535 (2013). [DOI] [PMC free article] [PubMed] [Google Scholar]
- Som A., Bloch S., Ippolito J. E. & Achilefu S. Acidic extracellular pH of tumors induces octamer-binding transcription factor 4 expression in murine fibroblasts in vitro and in vivo. Sci. Rep. 6, 27803 (2016). [DOI] [PMC free article] [PubMed] [Google Scholar]
- Gurav D. D., Kulkarni A. S., Khan A. & Shinde V. S. pH-responsive targeted and controlled doxorubicin delivery using hyaluronic acid nanocarriers. Colloids Surfaces B Biointerfaces 143, 352–358 (2016). [DOI] [PubMed] [Google Scholar]
- Rohrer M., Bauer H., Mintorovitch J., Requardt M. & Weinmann H. J. Comparison of magnetic properties of MRI contrast media solutions at different magnetic field strengths. Invest. Radiol. 40, 715–724 (2005). [DOI] [PubMed] [Google Scholar]
- Reimer P. & Balzer T. Ferucarbotran (Resovist): a new clinically approved RES-specific contrast agent for contrast-enhanced MRI of the liver: properties, clinical development, and applications. Eur. Radiol. 13 (2003). [DOI] [PubMed] [Google Scholar]
- Malyutin A. G. et al. Viruslike Nanoparticles with Maghemite Cores Allow for Enhanced MRI Contrast Agents. Chem. Mater. 27, 327–335 (2015). [Google Scholar]
- Kodiha M. et al. Gold nanoparticles induce nuclear damage in breast cancer cells, which is further amplified by hyperthermia. Cell. Mol. Life Sci. 71, 4259–4273 (2014). [DOI] [PMC free article] [PubMed] [Google Scholar]
- Cho E. C., Xie J., Wurm P. A. & Xia Y. Understanding the role of surface charges in cellular adsorption versus internalization by selectively removing gold nanoparticles on the cell surface with a I2/KI etchant. Nano Lett. 9, 1080–1084 (2009). [DOI] [PubMed] [Google Scholar]
- Trujillo-Romero C. J., Garcia-Jimeno S., Vera A., Leija L. & Estelrich J. Using Nanoparticles for Enhancing the Focusing Heating Effect of an External Waveguide Applicator for Oncology Hyper-Thermia: Evaluation in Muscle and Tumor Phantoms. Prog. Electromagn. Res. 121, 343–363 (2011). [Google Scholar]
- Kim D. K. et al. Energy absorption of superparamagnetic iron oxide nanoparticles by microwave irradiation. J. Appl. Phys. 97, 10J510–10J510–3 (2005). [Google Scholar]
- Mohammad F., Balaji G., Weber A., Uppu R. M. & Kumar C. S. S. R. Influence of Gold Nanoshell on Hyperthermia of Super Paramagnetic Iron Oxide Nanoparticles (SPIONs). J. Phys. Chem. C. Nanomater. Interfaces 114, 19194–19201 (2010). [DOI] [PMC free article] [PubMed] [Google Scholar]
- Holzwarth A., Lou J., Hatton T. A. & Laibinis P. E. Enhanced Microwave Heating of Nonpolar Solvents by Dispersed Magnetic Nanoparticles. Ind. Eng. Chem. Res. 37, 2701–2706 (1998). [Google Scholar]
- Pearce J. A., Cook J. R. & Emelianov S. Y. Ferrimagnetic nanoparticles enhance microwave heating for tumor hyperthermia therapy. 2010 Annu. Int. Conf. IEEE Eng. Med. Biol. Soc. EMBC’10 2751–2754, doi: 10.1109/IEMBS.2010.5626583 (2010). [DOI] [PubMed]
- Urano M., Kuroda M. & Nishimura Y. For the clinical application of thermochemotherapy given at mild temperatures. Int. J. Hyperth. 15, 79–107 (1999). [DOI] [PubMed] [Google Scholar]
- Ramachandra Kurup Sasikala A. et al. Multifunctional Nanocarpets for Cancer Theranostics: Remotely Controlled Graphene Nanoheaters for Thermo-Chemosensitisation and Magnetic Resonance Imaging. Sci. Rep. 6, 20543 (2016). [DOI] [PMC free article] [PubMed] [Google Scholar]
Associated Data
This section collects any data citations, data availability statements, or supplementary materials included in this article.


