Abstract
Background
This study investigated how miR-21 expression is reflected in acute myocardial infarction and explored the role of miR-21 and the PTEN/VEGF signaling pathway in cardiac microvascular endothelial cells.
Material/Methods
We used an in vivo LAD rat model to simulate acute myocardial infarction. MiR-21 mimics and miR-21 inhibitors were injected and transfected into model rats in order to alter miR-21 expression. Cardiac functions were evaluated using echocardiographic measurement, ELISA, and Masson staining. In addition, lenti-PTEN and VEGF siRNA were transfected into CMEC cells using standard procedures for assessing the effect of PTEN and VEGE on cell proliferation, apoptosis, and angiogenesis. MiR-21, PTEN, and VEGF expressions were examined by RT-PCR and Western blot. The relationship between miR-21 and PTEN was determined by the luciferase activity assay.
Results
We demonstrated that miR-21 bonded with the 3′-UTR of PTEN and suppressed PTEN expressions. Established models significantly induced cardiac infarct volume and endothelial injury marker expressions as well as miR-21 and PTEN expressions (P<0.05). MiR-21 mimics exhibited significantly protective effects since they down-regulated both infarction size and injury marker expressions by increasing VEGF expression and inhibiting PTEN expression (P<0.05). In addition, results from in vitro research show that lenti-PTEN and VEGF siRNA can notably antagonize the effect of miR-21 on cell proliferation, apoptosis, and angiogenesis (P<0.05).
Conclusions
MiR-21 exerts protective effects on endothelial injury through the PTEN/VEGF pathway after acute myocardial infarction.
MeSH Keywords: Angiogenesis Inhibitors; Apoptosis; Cell Proliferation; Myocardial Infarction; PTEN Phosphohydrolase; Vascular Endothelial Growth Factor, Endocrine-Gland-Derived
Background
Acute myocardial infarction (AMI) is the most common source of cardiac injuries and greatly contributes to cardiomyocyte ischemic death [1]. AMI has emerged as a major health issue worldwide and it results in diminished blood flow to the heart [2,3]. Major risk factors of AMI include hyperlipidemia, diabetes, smoking, hypertension, sex, and age [4]. Furthermore, discovering the molecular mechanisms of AMI may provide additional information for disease management.
MicroRNAs (miRNAs) are a family of conserved, small, non-coding RNAs that regulate target gene expressions [5]. Aberrant miRNA expressions have also been documented in many diseases, especially cancer [6–9]. Increasing evidence suggests a connection between miRNAs and cardiovascular diseases. Recently, it has been verified that miR-21 is up-regulated in human peripheral blood of patients with atherosclerosis (AS) [10]. Therefore, our study specifically aimed to investigate the potential function and regulatory mechanism of miR-21 in acute myocardial infarction.
Phosphatase and tensin homolog (PTEN) encodes a phosphatase with dual activity against phospholipids and proteins [12]. PTEN is able to regulate signal transduction pathways through different mechanisms [13]. Early research indicated that PTEN is associated with the development of heart failure in mice [14,15]. Studies revealed that inhibition of PTEN gene expression up-regulated VEGF secretion, increased the migration and proliferation, and stimulated tubule development in pancreatic cancer cells [16].
Vascular endothelial growth factor (VEGF) has a substantial impact on endothelial cell proliferation, survival, and differentiation. Hence, VEGF is usually defined as a factor for endothelial-specific growth and angiogenesis [17,18]. As suggested by another study, VEGF isoforms and subtypes are differently expressed in the infarcted heart [19], suggesting the feasibility of detecting VEGF expression after myocardial infarction. Researchers used immunodeficient mice with critical limb ischemia and discovered a miR-21 signal had a negative effect on PTEN, and that VEGF expression was up-regulated [20]. All of the above evidence motivated us to carry out this study for the purpose of assessing the relationships among miR-21, PTEN, and VEGF.
Studies on miR-21/PTEN/VEGF are still being developed and few studies have been able to explain how miR-21/PTEN/VEGF affects cardiac microvascular endothelial cells in acute myocardial infarction. Therefore, this study was carried out to assess the effect of miR-21/PTEN/VEGF on angiogenesis in CMEC cells and how miR-21/PTEN/VEGF affects cardiac microvascular endothelial cells.
Material and Methods
Cell extraction and cell culture
Sprague-Dawley rats (SD rats, Laboratory Animal Center of Xiangyang Central Hospital, Affiliated Hospital of Hubei University of Arts and Science) with an average age of 2–3 months and weight of 225–350 g were obtained for establishing acute myocardial infarction (AMI) models. Bone marrow mesenchymal stem cells (BMSCs) and cardiac microvascular endothelial cells (CMECs) were isolated from these rats. All experiments were guided by the Care and Use of Laboratory Animals and all experimental procedures were approved by the National Cancer Institute Animal Care and Use Committee.
BMSCs and CMECs of rats were isolated as previously described [21,22]. All cells were cultured in Dulbecco modified Eagle’s medium (DMEM, Gibco, Carlsbad, CA) with 10% fetal bovine serum (Gibco, Carlsbad, CA) at 37°C in an incubator with 5% CO2. BMSCs and CMECs were identified by immunofluorescence.
Lenti-virus transduction
Four groups of fragments, separately containing miR-21 mimics, miR-21 inhibitors, lenti-PTEN, or VEGF siRNA were cloned into pCDH vectors. Then, pCDH vectors were transfected with other essential packaging plasmids into cells using Lipofectamine LTX kit (Invitrogen, CA) and viral particles therein were collected at 48 h after transfection.
BMSC transfection
BMSCs were infected with 3 kinds of recombinant lentivirus and 8 μg/ml polybrene, and then randomly allocated into 4 groups with different transfection substances: control group (BMSCs without transfection); NC group (BMSCs were transfected with control vector); miR-21 mimics group (BMSCs were transfected with miR-21 mimics); and miR-21 inhibitors group (BMSCs were transfected with miR-21 inhibitors).
Establishment of Animal model
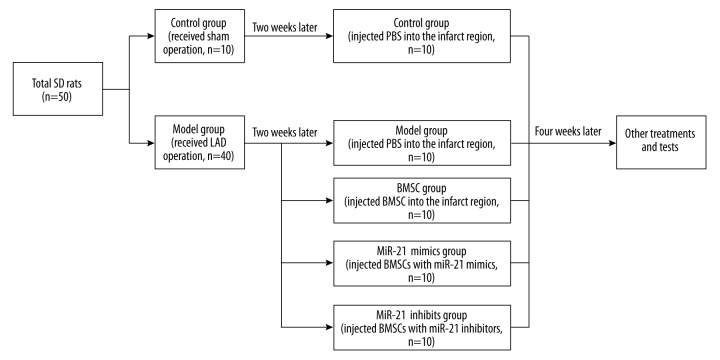
Fifty SD rats were randomly assigned into the control group (n=10) and model group (n=40). An AMI model was established by ligating the left anterior descending coronary artery (LAD) of rats, while rats in the control group were treated with a sham operation [23].
As shown in Figure 1, all rats were further allocated into 5 groups once the animal model had been established for 2 weeks: control group (10 rats with sham operation, injected PBS into the infarct region); model group (10 model rats, injected with PBS into the infarct region); BMSC group (10 model rats, injected with normal BMSC cells into the infarct region); miR-21 mimics group (10 model rats, injected with BMSC cells which were transfected with miR-21 mimics into the infarct region); and miR-21 inhibitors group (10 model rats, injected with BMSC cells transfected with miR-21 inhibitors into the infarct region). Inspection for all rats was carried out 6 weeks after the operation.
Figure 1.
Animal model establishment and grouping. SD – Sprague-Dawley; LAD – left anterior descending; PBS – phosphate buffer; BMSC – bone marrow mesenchymal stem cells.
Echocardiographic measurement and tests of endothelial injury markers
Once the operation had been established for 6 weeks, rats in each group were examined with echocardiographic measurement (ATL-HDI5000, 15MHz linear and 12-MHz sectorial scanheads). Four indexes were inspected for left ventricular ejection fractions (LVEF), fractional shortening (FS), left ventricular end-systolic volume (LVVs), and left ventricular end-diastolic volume (LVVd).
Endothelial injury markers in blood samples including cardiac troponin I (cTnI), heart-type fatty acid binding protein (H-FABP) and von Willebrand factor (vWF) were tested using double antibody sandwich enzyme-linked immunosorbent assay (R&D, USA).
Masson staining and measurement of infarct size
Six weeks after the operation, rats in each group were sacrificed by injecting xylazine hydrochloride. Sections from base, mid-LV, and apex were harvested and treated with 4% paraformaldehyde. Sections 5-μm thick were embedded with paraffin and then stained by Masson’s trichrome assay. Samples were observed under a microscope and infarct size was measured using Image J software (Olympus) at 5 random sites.
Virus transfection in CMECs
CMEC cells were divided into 6 groups: control group (cells without transfection); NC group (cells were transfected with vector); miR-21 mimics group (cells were transfected with miR-21 mimics); miR-21 inhibitors group (cells were transfected with miR-21 inhibitors); miR-21 mimics + lenti-PTEN group (cells were transfected with both miR-21 mimics and lenti-PTEN); and miR-21 mimics + VEGF siRNA group (cells were transfected with both miR-21 mimics and VEGF siRNA).
Cell proliferation and apoptosis assay
MTT [3-(4,5-dimethyl-2-thiazolyl)-2,5-diphenyl-2-H-tetrazolium bromide] assay was used to assess cell proliferation status. Cells (3×10³) were cultured in 96-well plates, incubated for 48 h, and then stained with 0.5 mg/ml MTT for 4 h. Supernatant was discarded and 200-μl dimethylsulfoxide was added to dissolve precipitate. Samples were measured at 490 nm using an ELISA reader.
Apoptosis rates of samples were calculated using flow cytometry after cells were stained using the Annexin V-FITC/PI Apoptosis Detection Kit (BD Biosciences).
Tube formation assay in vitro
Tube formation in vitro was implemented using a tube formation assay kit (Chemicon). CMEC cells were cultured in 48-well plates with 150 μl matrigel for 6–12 h. Capillary-like tube structures were identified by an inverted light microscope. Tube length and branch point were calculated at 5 random fields using Image-Pro Plus 6.0 software (IPP, CA).
Luciferase activity assay
The 3′ untranslated region (UTR) of PTEN containing miR-21 binding sites was amplified through polymerase chain reaction (PCR) and was cloned into the downstream of the psiCHECK-2 luciferase vector (Promega, USA), which was named as wt 3′ UTR. The binding site was mutated using the GeneTailor Site-Directed Mutagenesis System (Invitrogen, USA) and the resultant mutant 3′ UTR was cloned into the same vector, which was named as mut 3′ UTR.
CMEC cells maintained in 48-well plates were co-transfected with different groups of vectors: 1 group was transfected with the combination of 200ng pGL3-control luciferase reporter, 10 ng pRL-TK vector, and miR-21 vector, while miR-21 vector was replaced by the negative control vector in the other group. Transfected cells were analyzed using the Dual-Luciferase Reporter Assay System (Promega) after 48 h.
RNA isolation and RT-PCR
Total RNA from tissues or cells were extracted using TRIzol reagent (Invitrogen). ReverTra Ace qPCR RT Kit (Toyobo, Japan) was manipulated to reversely transcribe total RNA into cDNA and real-time PCR (RT-PCR) was performed using THUNDERBIRD SYBR® qPCR Mix (Toyobo, Japan) using the CFX96 Touch Real-Time PCR Detection System (Bio-Rad). Relevant primers were listed in Table 1. Target gene expression levels were normalized to those of the control gene (GAPDH) and were calculated using the 2−ΔΔCT method.
Table 1.
Primer sequences of GAPDH and miR-21 for implemention of RT-PCR.
| Gene | Primer sequence | |
|---|---|---|
| GAPDH | Sense | 5′-TGGTATCGTGGAAGGACTCAT-3′ |
|
| ||
| Antisense | 5′-GTGGGTGTCGCTGTTGAAGTC-3′ | |
|
| ||
| miR-21 | Sense | 5′-GCGCGTCGTGAAGCGTTC-3′ |
| Antisense | 5′-GTGCAGGGTCCGAGGT-3′ | |
GAPDH – glyceraldehyde phosphate dehydrogenase glyceraldehyde phosphate dehydrogenase; RT-PCR – real time-polymerase chain reaction.
Western blot
Tissues and cells were harvested and lysed by radio immunoprecipitation assay (RIPA) buffer. Total protein was separated and calculated as suggested by the Bradford method [24]. Then, total protein was denatured in boiled water and transferred onto polyvinylidene fluoride (PVDF) membranes after sodium dodecyl sulfate-polyacrylamide gel electrophoresis (SDS-PAGE) was completed. Membranes were blocked in Tris-Buffered Saline Tween (TBST) with 5% skim milk for 1 h and were then treated with primary antibodies against PTEN and VEGF (1:800 dilution, Zhongshan Biology Company, Beijing) at 4°C overnight. After membranes were washed, they were incubated with secondary antibodies (horseradish peroxidase-conjugated goat anti-goat, 1:2000 dilution, Zhongshan Biology Company, Beijing). Samples in which reduced GAPDH was set as the endogenous control were ultimately processed with enhanced chemiluminescence and were quantified using Lab Works4.5 software (Mitov Software).
Statistical analysis
All statistical analyses results were obtained using SPSS 18.0 software (Chicago, Illinois, USA). Data are presented in the form of mean ± standard deviation (SD). The two-tailed t test or one-way analysis of variance (ANOVA) was used to analyze between-group comparisons and P<0.05 was considered as the cut-off value of statistical significance.
Results
Cell extraction and cell culture
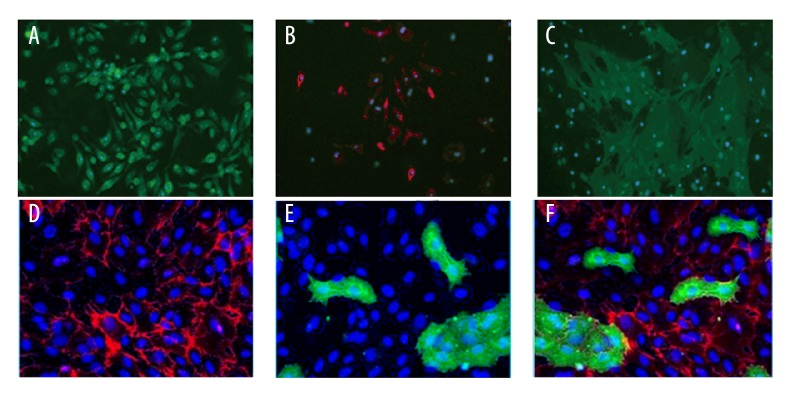
BMSCs and CMECs were isolated from cardiac tissues and then were identified with immunofluorescence staining of surface markers. Characteristic protein markers – CD44 (Figure 2A), CD29 (Figure 2B), and CD106 (Figure 2C) – were positively expressed in BMSCs. Endothelial-specific markers – CD31 (Figure 2D), PDPN (Figure 2E), and Merge (Figure 2F) – were positively expressed in CMECs.
Figure 2.
Isolation and identification of BMSCs and CMECs. (A–C) Immunocytochemistry of BMSCs for a panel of surface markers, including CD44 (A), CD29 (B), and CD106 (C). (D–F) Immunocytochemistry of CMECs for a panel of endothelial-specific markers, including CD31 (D), PDPN (E) and Merge (F).
MiR-21 regulated PTEN and VEGF expressions in BMSC cells
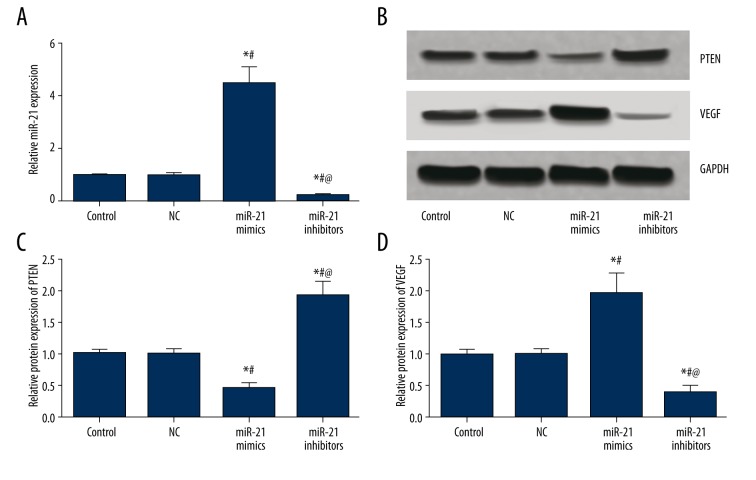
As suggested by Table 2 and Figure 3, miR-21, PTEN, and VEGF expressions exhibited no significant differences between the control and NC group (all P>0.05). Compared with the control and NC group, the miR-21 mimics group had significantly higher miR-21 and VEGF expressions and lower PTEN expressions, whereas the miR-21 inhibitors group had significantly lower miR-21 and VEGF expressions and higher PTEN expressions (all P<0.05, Table 2, Figure 3).
Table 2.
Expressions of miR-21, PTEN and VEGF in BMSC cells.
| Group | Control | NC | MiR-21 mimics | MiR-21 inhibitors |
|---|---|---|---|---|
| miR-21 | 1.00±0.07 | 0.97±0.10 | 4.44±.67*# | 0.24±0.05*#@ |
| PTEN | 1.00±0.07 | 0.99±0.09 | 0.44±0.11*# | 1.92±0.22*#@ |
| VEGF | 1.00±0.08 | 1.02±0.08 | 1.98±0.31*# | 0.41±0.10*#@ |
NC – negative control.
P<0.05 versus control group;
P<0.05 versus NC group;
P<0.05 versus miR-21 mimics group.
Figure 3.
MiR-21, PTEN, and VEGF expressions in BMSCs after transfection. (A) Semi-quantitative levels of miR-21in BMSCs among different groups (control, NC, miR-21 mimics, and miR-21 inhibitors). (B) Western blot analysis of PTEN and VEGF in BMSCs with GAPDH as internal control. (C, D) Quantitative protein level of PTEN (C) and VEGF (D) in BMSCs. Data are presented as mean ±SD for 3 independent experiments. * P<0.05 versus control group, # P<0.05 versus NC group, @ P<0.05 versus miR-21 mimics group.
Results from echocardiographic measurement and endothelial injury markers
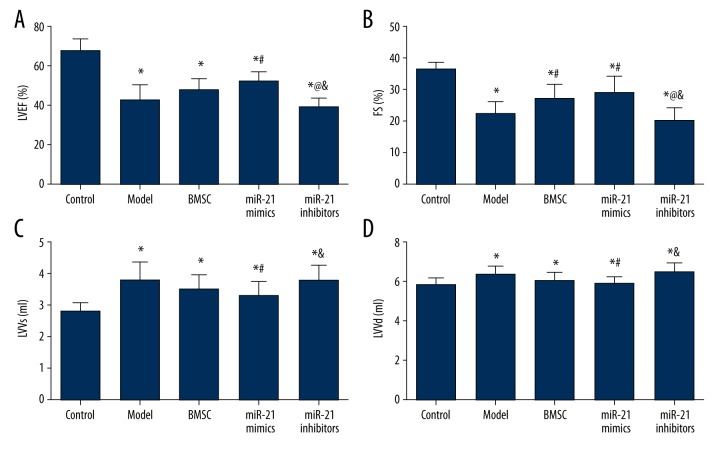
Rats in 5 groups (control, model, BMSC, miR-21 mimics, and miR-21 inhibitors) were associated with significantly lower LVEF and FS and remarkably higher LVVs and LVVd compared with the control group (all P<0.05, Table 3, Figure 4). In addition, the miR-21 mimics group had significantly higher LVEF and FS and lower LVVs and LVVd than the model group (all P<0.05, Table 3, Figure 4). The miR-21 inhibitors group also had significantly lower LVEF and FS as well as remarkably higher LVVs and LVVd than the BMSC group (all P<0.05, Table 3, Figure 4). The miR-21 inhibitors group exhibited significantly lower LVEF and FS in comparison to the miR-21 mimics group and the BMSC group exhibited significantly higher FS than the model group (all P<0.05, Table 3, Figure 4).
Table 3.
Results of echocardiographic measurement, endothelial injury marker tests and masson staining.
| Group | Control | Model | BMSC | MiR-21 mimics | MiR-21 inhibitors |
|---|---|---|---|---|---|
| LVEF, % | 67.8±6.2 | 42.9±7.8* | 47.5±6.4* | 52.3±5.2*# | 39.3±4.7*@& |
| FS, % | 36.2±2.3 | 22.2±3.9* | 26.9±4.8*# | 29.2±5.2*# | 20.2±4.2*@& |
| LVVs, ml | 2.8±0.3 | 3.8±0.6* | 3.5±0.5* | 3.3±0.5*# | 3.8±0.5*& |
| LVVd, ml | 5.2±0.7 | 6.3±0.4* | 6.0±0.4* | 5.8±0.4*# | 6.4±0.5*& |
| cTnI, pg/ml | 11.68±1.43 | 16.37±2.13* | 15.12±2.08* | 13.55±2.26# | 17.86±2.37*@& |
| h-FABP, ng/ml | 10.35±1.79 | 18.78±2.74* | 17.12±2.69* | 14.57±2.31*#@ | 23.32±3.15*#@& |
| vWF, ng/ml | 4.79±0.87 | 8.15±1.15* | 7.17±1.14*# | 5.82±0.95*#@ | 9.28±1.26*#@& |
| Fibrosis, %LV | 0±0 | 47.71±3.18* | 35.04±4.38*# | 20.36±2.39*#@ | 48.70±3.19*@& |
LVEF – left ventricular ejection fractions; FS – fractional shortening; LVVs – left ventricular end-systolic volume; LVVd – left ventricular end-diastolic volume; cTnI – cardiac troponin I; h-FABP – heart-type fatty acid binding protein; vWF – von Willebrand factor.
P<0.05 versus control group;
P<0.05 versus NC group;
P<0.05 versus BMSC group,
P<0.05 versus miR-21 mimics group.
Figure 4.
Echocardiographic measurements of LVEF (A), FS (B), LVVs (C), and LVVd (D). Data are presented as mean ±SD. LVEF – left ventricular ejection fractions; FS – fractional shortening; LVVs – left ventricular end-systolic volume; LVVd – left ventricular end-diastolic volume. * P<0.05 versus control group, # P<0.05 versus NC group, @ P<0.05 versus BMSC group, & P<0.05 versus miR-21 mimics group.
Endothelial injury markers, including cTnI, h-FABP and vWF, in the 5 groups were also evaluated and compared. Model rats had significantly higher cTnI, h-FABP, and vWF expressions, while treatment of miR-21 mimics further significantly up-regulated endothelial injury markers, especially h-FABP and vWF (all P<0.05, Table 3, Figure 5). The MiR-21 mimics group had remarkably lower expression of markers (cTnI, h-FABP, and vWF) compared with the model and miR-21 inhibitors group. Moreover, the MiR-21 mimics group exhibited significantly lower h-FABP and vWF expressions than the BMSC group (all P<0.05, Table 3, Figure 5). In addition, vWF was significantly down-regulated in the BMSC group compared to the model group (P<0.05, Table 3, Figure 5).
Figure 5.
Quantitation of cTnI (A), h-FABP (B), vWF (C) in model rats. Data are presented as mean ±SD. cTnI – cardiac troponin I; h-FABP – heart-type fatty acid binding protein; vWF – von Willebrand factor. * P<0.05 versus control group, # P<0.05 versus NC group, @ P<0.05 versus BMSC group, & P<0.05 versus miR-21 mimics group.
Masson’s staining result
By using Masson’s trichrome staining, normal myocardium tissues were stained in red while fiberized tissues were stained in blue. Then, fibrosis area in the left ventricle wall was calculated (Figure 6A–6E). Compared with the control group, the fibrosis area was significantly increased in the model, BMSC, miR-21 mimics, and miR-21 inhibitors group (all P<0.05, Table 3, Figure 6F). Treatment of BMSC or miR-21 mimics remarkably restricted the fibrosis area compared with the model and miR-21 inhibitors group, while the miR-21 mimics group exhibited smaller fibrosis area compared with the BMSC group (all P<0.05, Table 3, Figure 6F).
Figure 6.
Results of Masson staining and fibrosis area. (A–E) Masson staining of atrial tissues in the control (A), model (B), BMSC (C), miR-21 mimics (D), and miR-21 inhibitors (E) group. F – Fibrosis percentage (stained as blue) in left ventricle wall. Data are presented as mean ±SD. * P<0.05 versus control group, # P<0.05 versus NC group, @ P<0.05 versus BMSC group, & P<0.05 versus miR-21 mimics group.
MiR-21, PTEN, and VEGF expressions in cardiac tissues
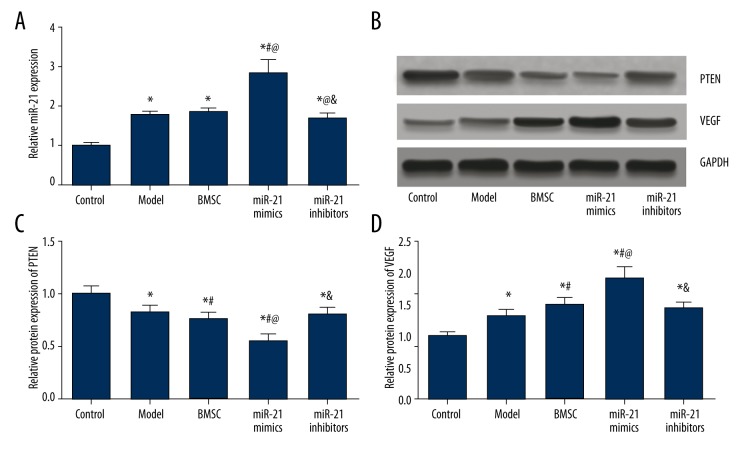
The model and miR-21 inhibitors group had significantly higher miR-21 and VEGF expressions and lower PTEN expressions than the control group (all P<0.05, Table 4, Figure 7). Treatment of miR-21 mimics significantly up-regulated miR-21 and VEGF expressions and down-regulated PTEN expressions compared with the control, model, BMSC, and miR-21 inhibitors group (all P<0.05, Table 4, Figure 7). miR-21 inhibitors exhibited remarkably lower miR-21 expressions compared with the BMSC group, while the BMSC group had significantly lower PTEN expression and higher VEGF expression than the model group (all P<0.05, Table 4, Figure 7).
Table 4.
Expression level of miR-21, PTEN and VEGF in cardiac tissue.
| Group | Control | Model | BMSC | MiR-21 mimics | MiR-21 inhibitors |
|---|---|---|---|---|---|
| miR-21 | 1.00±0.07 | 1.78±0.11* | 1.82±0.13* | 2.85±0.32*#@ | 1.69±0.12*@& |
| PTEN | 1.00±0.08 | 0.82±0.07* | 0.76±0.05*# | 0.56±0.05*#@ | 0.80±0.07*& |
| VEGF | 1.00±0.08 | 1.32±0.10* | 1.48±0.14*# | 1.92±0.19*#@ | 1.41±0.13*& |
P<0.05 versus control group;
P<0.05 versus NC group;
P<0.05 versus BMSC group;
P<0.05 versus miR-21 mimics group.
Figure 7.
MiR-21, PTEN, and VEGF expressions in model rats. (A) Quantitative levels of miR-21 in model rats among different groups (control, model, BMSC, miR-21 mimics, and miR-21 inhibitors). (B) Western blot analysis of PTEN and VEGF in cardiac tissues of rats with GAPDH as internal control. (C, D) Quantitative protein level of PTEN (C) and VEGF (D) in model rats. Data are presented as mean ±SD. * P<0.05 versus control group, # P<0.05 versus NC group, @ P<0.05 versus BMSC group, & P<0.05 versus miR-21 mimics group.
miR-21 suppressed PTEN expression by binding with the 3′ UTR
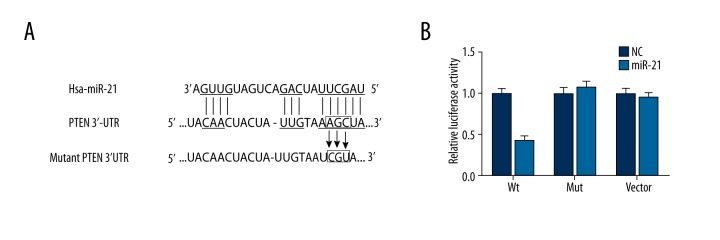
As suggested by results obtained using the miRanda software, 1 site in the 3′ UTR of PTEN was highly conserved to bind with miR-21 (Figure 8A). Luciferase activity assay confirmed a direct interaction between miR-21 and PTEN, with evidence that transfection of miR-21 could significantly restrict the relative luciferase activity in CMEC cells when miR-21 bound with the normal 3′ UTR of PTEN (P<0.05, Table 5, Figure 8B). Nonetheless, there appeared to be few differences in luciferase activities between the NC group and normal cells containing miR-21 in the control and PTEN mutation 3′ UTR group (P>0.05, Table 5, Figure 8B).
Figure 8.
Binding site prediction and results of luciferase report between miR-21 and PTEN. (A) Putative targets predicted and binding site mutation. (B) Results of luciferase report. Data are presented as mean ±SD for 3 independent experiments. * P<0.05 versus control group.
Table 5.
Relative luciferase activity in wt VEGF-A, Mut VEGF-A and vector groups.
| Relative luciferase activity | Wt | Mut | Vector |
|---|---|---|---|
| NC | 1.00±0.07 | 1.00±0.08 | 1.00±0.07 |
| Transfection group | 0.42±0.06* | 1.08±0.07 | 0.96±0.06 |
Wt – wild type; Mut – mutation; NC – negative control.
P<0.05 versus NC group.
Effects of miR-21 and PTEN/VEGF on CMEC cell proliferation and apoptosis
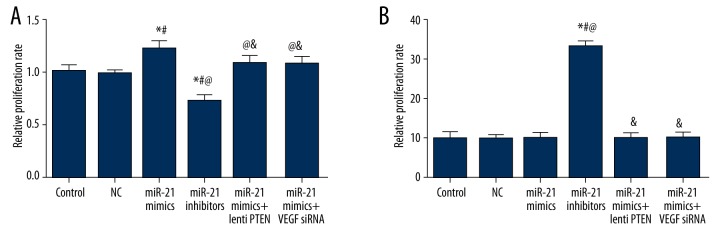
CMEC cell proliferation status was revealed by the MTT assay. Compared with the control, NC, miR-21 mimics + lenti-PTEN, and miR-21 mimics + VEGF siRNA group, the miR-21 mimics group had a significantly higher proliferation rate while the miR-21 inhibitors group had a significantly lower proliferation rate (all P<0.05, Table 6, Figure 9A).
Table 6.
Effects of miR-21, lenti PTEN and VEGF siRNA on proliferation, apoptosis and angiogenesis of CMEC cells.
| Group | Control | NC | MiR-21 mimics | MiR-21 inhibitors | MiR-21 mimics + lenti PTEN | MiR-21 mimics + VEGF siRNA |
|---|---|---|---|---|---|---|
| Proliferation | 1.00±0.06 | 0.98±0.03 | 1.21±0.08*# | 0.72±0.06*#@ | 1.08±0.07@& | 1.07±0.07@& |
| Apoptosis,% | 9.95±1.50 | 9.85±0.75 | 10.04±1.13 | 32.99±1.51*#@ | 9.87±1.48& | 10.02±1.32& |
| Tube length, mm | 13.17±0.45 | 13.82±0.60 | 22.60±0.90*# | 11.77±0.45*#@ | 17.24±0.53*#@& | 16.33±0.47*#@& |
| Branch point | 35.81±3.26 | 36.44±4.07 | 54.94±5.29*# | 29.71±4.48*#@ | 46.78±3.74*#@& | 43.25±3.64*#@& |
P<0.05 versus control group;
P<0.05 versus NC group;
P<0.05 versus miR-21 mimics group;
P<0.05 versus miR-21 inhibitors group.
Figure 9.
Quantitative data of proliferation rate (A) and apoptosis rate (B) in CMECs among different groups (control, NC, miR-21 mimics, miR-21 inhibitors, miR-21 mimics + lenti PTEN, and miR-21 mimics + VEGF siRNA). Data are presented as mean ±SD for 3 independent experiments. * P<0.05 versus control group, # P<0.05 versus NC group, @ P<0.05 versus miR-21 mimics group, & P<0.05 versus miR-21 inhibitors group.
Results from flow cytometry suggested that there was no obvious difference in cell apoptosis between the control, NC, miR-21 mimics, miR-21 mimics + lenti-PTEN, and miR-21 mimics + VEGF siRNA group (all P>0.05, Table 6, Figure 9B). Transfection of miR-21 inhibitors can remarkably elevate the apoptosis rate of CMEC cells compared with the control, NC, miR-21 mimics, miR-21 mimics + lenti-PTEN, and miR-21 mimics + VEGF siRNA group (all P<0.05, Table 6, Figure 9B).
Effects of miR-21 and PTEN/VEGF on CMEC cell angiogenesis
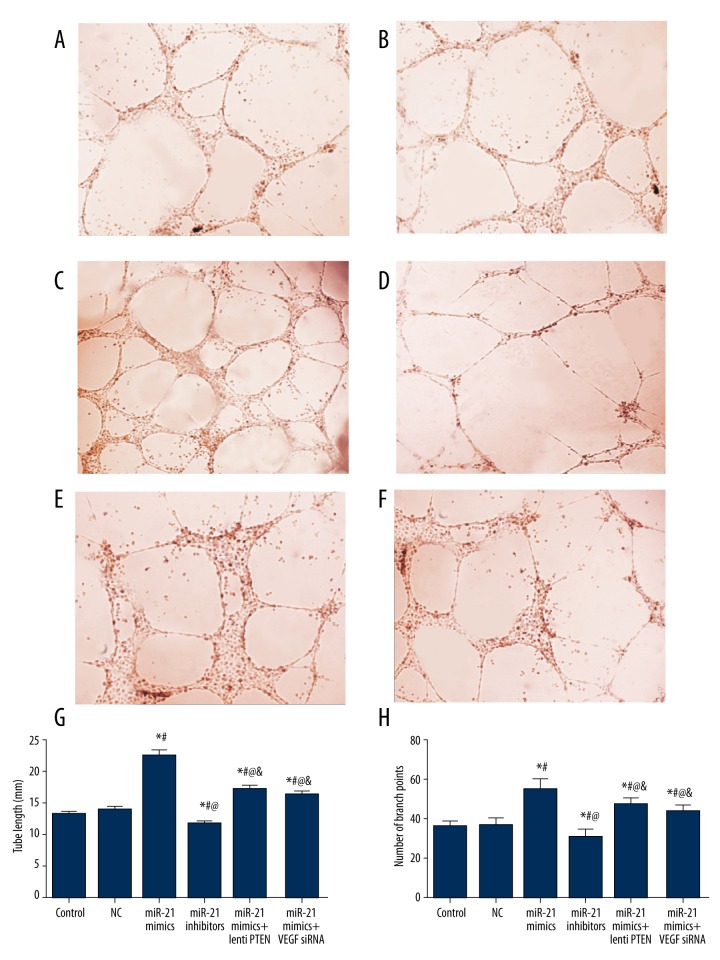
As shown in Table 6 and Figure 10, no significant difference in tube length or tube branch point was found between the control and NC group (all P>0.05). Compared with the control and NC group, the miR-21 mimics, miR-21 mimics + lenti PTEN, and miR-21 mimics + VEGF siRNA group showed obvious formation of dense cellular networks, including significantly larger tube length and more branch points, while the miR-21 inhibitors group had less obvious tube-like structures with smaller tube length and fewer branch points (all P<0.05, Table 6, Figure 10). Compared with the miR-21 mimics group, treatment of lenti PTEN or VEGF siRNA was able to down-regulate tube length and branch points, suggesting their negative effects on cell angiogenesis (all P<0.05, Table 6, Figure 10).
Figure 10.
Results of tube formation assay in CMEC cells. (A–F) Tube formation assay in vitro in the control (A), NC (B), miR-21 mimics (C), miR-21 inhibitors (D), miR-21 mimics + lenti PTEN (E), and miR-21 mimics + VEGF siRNA (F) group. (G, H) Quantitative data of tube length (G) and tube branch point (H) in CMECs. Data are presented as mean ±SD for 3 independent experiments. * P<0.05 versus control group, # P<0.05 versus NC group, @ P<0.05 versus miR-21 mimics group, & P<0.05 versus miR-21 inhibitors group.
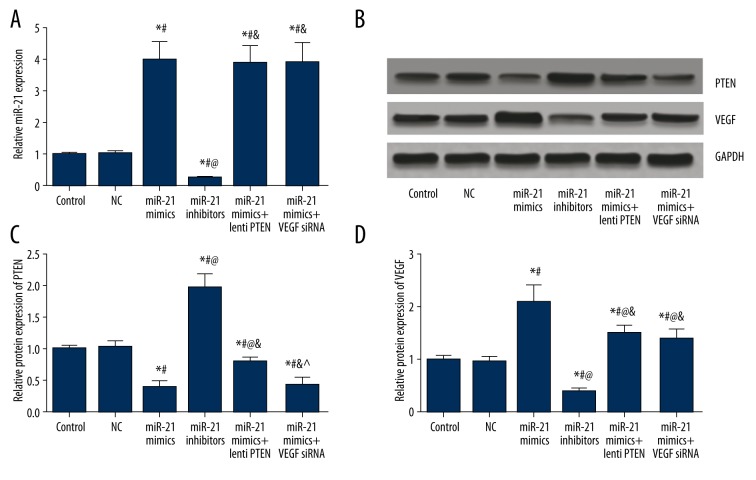
MiR-21, PTEN, and VEGF expressions in CMEC cells
As indicated by Table 7 and Figure 11, miR-21, PTEN, and VEGF expressions had no significant differences between the control and NC group (all P>0.05). Compared with of the control and NC group, the miR-21 mimics group had significantly higher miR-21 and VEGF expressions and lower PTEN expressions, whereas the miR-21 inhibitors group exhibited significantly lower miR-21 and VEGF expressions and higher PTEN expressions (all P<0.05, Table 7, Figure 11). Compared with the miR-21 mimics group, transfection of lenti-PTEN can significantly up-regulate PTEN expressions and down-regulate VEGF expressions, while transfection of VEGF siRNA is able to down-regulate VEGF expression (all P<0.05, Table 7, Figure 11).
Table 7.
Expression level of miR-21, PTEN and VEGF in CMEC cells.
| Group | Control | NC | MiR-21 mimics | MiR-21 inhibitors | MiR-21 mimics + lenti PTEN | MiR-21 mimics + VEGF siRNA |
|---|---|---|---|---|---|---|
| miR-21 | 1.00±0.06 | 1.02±0.10 | 3.98±0.59*# | 0.25±0.05*#@ | 3.88±0.57*#& | 3.93±0.62*#& |
| PTEN | 1.00±0.06 | 1.03±0.09 | 0.39±0.10*# | 1.96±0.24*#@ | 0.79±0.07*#@& | 0.42±0.11*#&^ |
| VEGF | 1.00±0.07 | 0.98±0.08 | 2.12±0.33*# | 0.38±0.09*#@ | 1.53±0.14*#@& | 1.42±0.17*#@& |
P<0.05 versus control group;
P<0.05 versus NC group;
P<0.05 versus miR-21 mimics group;
P<0.05 versus miR-21 inhibitors group;
P<0.05 versus miR-21 mimics + lenti PTEN group.
Figure 11.
MiR-21, PTEN, and VEGF expressions in CMECs after transfection. (A) Quantitative levels of miR-21in CMECs among different groups (control, NC, miR-21 mimics, miR-21 inhibitors, miR-21 mimics + lenti PTEN, and miR-21 mimics + VEGF siRNA). (B) Western blot analysis of PTEN and VEGF in CMECs with GAPDH as internal control. (C, D) Quantitative protein level of PTEN (C) and VEGF (D) CMECs. Data are presented as mean ±SD for 3 independent experiments. * P<0.05 versus control group, # P<0.05 versus NC group, @ P<0.05 versus miR-21 mimics group, & P<0.05 versus miR-21 inhibitors group, ^ P<0.05 versus miR-21 mimics + lenti PTEN group.
Discussion
As an emerging gene regulator, miRNAs are associated with cardiovascular diseases due to their participation in a wide range of processes; the importance of miRNAs has been discussed by prior studies [25]. Several studies have reported a strong relationship between miRNAs and endothelial injury because endothelial activation is an initial step in the improvement of MI [26–30]. For example, endothelium-enriched miR-92a mediates athero-susceptible endothelial cells by regulating KLF2/4 expression at the mRNA and protein levels [29,31]. Moreover, a recent study reported that Na2S exhibited a protective effect on cardiomyocytes [32]. A study conducted by Olson et al. demonstrated that up-regulation of miR-21 mediated the cardio-protective effects induced by isoflurane in the ischemia-reperfusion (I/R) injury model [33]. In our study, over-expression of miR-21 contributed to up-regulated CMEC proliferation and angiogenesis. Apart from that, over-expression of miR-21 is able to antagonize endothelial injury induced by the MI model. The above results suggest that miR-21 exerts protective roles in MI and may affect endothelial cell proliferation and angiogenesis.
VEGF is a strong angiogenesis inducer and has been suggested to be related to tumor angiogenesis in lung and prostate cancer [34,35]. VEGF is an important regulator of neovascularization and it can effectively facilitate collateral circulation in ischemic myocardium [36]. The main cause of myocardial necrosis is myocardial infarctions, which are in part caused by acute coronary artery blood supply interruption and severe myocardial tissue hypoxia. As shown in recent animal and clinical trials, VEGF expression is increased in myocardial infarction [37]. The main mechanism of VEGF expression, which facilitates angiogenesis, may be that VEGF has a special effect on vascular endothelial cells and further influences endothelial cell proliferation, sprouting, migration, and luminal formation [38]. In our study, up-regulation of VEGF expression induced by miR-21 mimics was related to less cardiac fibrosis, higher proliferation, and enhanced angiogenesis. Furthermore, interruption of VEGF expression with siRNA transfection is able to affect the protective effects of miR-21. Results from our study demonstrate that miR-21 regulates endothelial angiogenesis and exerts a protective effect through regulating VEGF expression. Interestingly, over-expression of miR-21 had no effects on cell apoptosis, while suppressing miR-21 can remarkably increase the apoptosis of CMECs. We suspect that VEGF is essential for the dynamics of CMECs, even if cell apoptosis is not affected by the over-expression of VEGF.
Some researchers reported that hypoxia-inducible factor-1 (HIF-1) plays a similar role to VEGF since the promoter region of VEGF gene contains the HIF-1 reactive element, which is active and directly induces VEGF expression under hypoxic conditions [39]. MiR-21 regulates VEGF expression by elevating HIF-1 through ERK and AKT pathways in prostate cancer cells [35]. However, PTEN, which is an antagonist of PI3K, was selected in our study as the mediator [40]. Luciferase report assay has confirmed that miR-21 suppressed PTEN expression by binding with the 3′UTR of PTEN [41]. Previous studies reported that the role of miR-21 was partly reflected by its ability to inhibit PTEN expression, while over-expression of PTEN interrupted tumor angiogenesis induced by miR-21 [42, 43]. In addition, Ma et al. reported that PTEN regulated VEGF-mediated signaling and modulated angiogenesis in human pancreatic cancer through the PI3K/Akt/VEGF pathway [16]. Another recent study provided evidence that the PTEN/VEGF signaling pathway played an important role in argonaute2-induced angiogenesis in human hepatocellular carcinoma [44]. As suggested by our study, PTEN expression is negatively associated with both miR-21 and VEGF expressions. Over-expression of PTEN can suppress the effects of miR-21 mimics on cell angiogenesis and down-regulate VEGF expression induced by miR-21. All of these conclusions provide new insights into the role of miR-21 in angiogenesis through the PTEN/VEGF signaling pathway and support our hypothesis that PTEN mediates the interaction between miR-21 and VEGF.
The present study has some limitations. For instance, the research approach in this study is not rigorous enough and we used a relatively small sample size, which may restrict the power of relevant statistical tests. Future studies should be designed and carried out to verify the representativeness and accuracy of our conclusions.
Conclusions
In conclusion, miR-21 exhibited protective effects on cell proliferation and angiogenesis both in vivo and in vitro. Additionally, miR-21 regulated CMEC proliferation and angiogenesis through targeting and suppressing PTEN expression, which further elevated VEGF expression. PTEN is the downstream target of miR-21 and it down-regulates VEGF when angiogenesis is induced by miR-21.
Footnotes
Source of support: Departmental sources
References
- 1.Horckmans M, Esfahani H, Beauloye C, et al. Loss of mouse P2Y4 nucleotide receptor protects against myocardial infarction through endothelin-1 downregulation. J Immunol. 2015;194:1874–81. doi: 10.4049/jimmunol.1401364. [DOI] [PubMed] [Google Scholar]
- 2.Jennings RB, Reimer KA. Factors involved in salvaging ischemic myocardium: Effect of reperfusion of arterial blood. Circulation. 1983;68:I25–36. [PubMed] [Google Scholar]
- 3.Gong XJ, Song XY, Wei H, et al. Serum S100A4 levels as a novel biomarker for detection of acute myocardial infarction. Eur Rev Med Pharmacol Sci. 2015;19:2221–25. [PubMed] [Google Scholar]
- 4.Crackower MA, Oudit GY, Kozieradzki I, et al. Regulation of myocardial contractility and cell size by distinct PI3K-PTEN signaling pathways. Cell. 2002;110:737–49. doi: 10.1016/s0092-8674(02)00969-8. [DOI] [PubMed] [Google Scholar]
- 5.Yu X, Li Z. Serum microRNAs as potential noninvasive biomarkers for glioma. Tumour Biol. 2015 doi: 10.1007/s13277-015-4515-7. [Epub ahead of print] [DOI] [PubMed] [Google Scholar]
- 6.Li Z, Yu X, Wang Y, et al. By downregulating TIAM1 expression, microRNA-329 suppresses gastric cancer invasion and growth. Oncotarget. 2015;6:17559–69. doi: 10.18632/oncotarget.2755. [DOI] [PMC free article] [PubMed] [Google Scholar]
- 7.Li Z, Lei H, Luo M, et al. DNA methylation downregulated mir-10b acts as a tumor suppressor in gastric cancer. Gastric Cancer. 2015;18:43–54. doi: 10.1007/s10120-014-0340-8. [DOI] [PubMed] [Google Scholar]
- 8.Yang Z, Han Y, Cheng K, et al. miR-99a directly targets the mTOR signalling pathway in breast cancer side population cells. Cell Prolif. 2014;47:587–95. doi: 10.1111/cpr.12146. [DOI] [PMC free article] [PubMed] [Google Scholar]
- 9.Niu G, Li B, Sun J, Sun L. miR-454 is down-regulated in osteosarcomas and suppresses cell proliferation and invasion by directly targeting c-Met. Cell Prolif. 2015;48:348–55. doi: 10.1111/cpr.12187. [DOI] [PMC free article] [PubMed] [Google Scholar]
- 10.Li S, Fan Q, He S, et al. MicroRNA-21 negatively regulates Treg cells through a TGF-beta1/Smad-independent pathway in patients with coronary heart disease. Cell Physiol Biochem. 2015;37:866–78. doi: 10.1159/000430214. [DOI] [PubMed] [Google Scholar]
- 11.Zhang P, Chen JH, Guo XL. New insights into PTEN regulation mechanisms and its potential function in targeted therapies. Biomed Pharmacother. 2012;66:485–90. doi: 10.1016/j.biopha.2012.04.004. [DOI] [PubMed] [Google Scholar]
- 12.Di Cristofano A, Pandolfi PP. The multiple roles of PTEN in tumor suppression. Cell. 2000;100:387–90. doi: 10.1016/s0092-8674(00)80674-1. [DOI] [PubMed] [Google Scholar]
- 13.Bermudez Brito M, Goulielmaki E, Papakonstanti EA. Focus on PTEN regulation. Front Oncol. 2015;5:166. doi: 10.3389/fonc.2015.00166. [DOI] [PMC free article] [PubMed] [Google Scholar]
- 14.Oudit GY, Kassiri Z, Zhou J, et al. Loss of PTEN attenuates the development of pathological hypertrophy and heart failure in response to biomechanical stress. Cardiovasc Res. 2008;78:505–14. doi: 10.1093/cvr/cvn041. [DOI] [PubMed] [Google Scholar]
- 15.Boosani CS, Agrawal DK. PTEN modulators: A patent review. Expert Opin Ther Pat. 2013;23:569–80. doi: 10.1517/13543776.2013.768985. [DOI] [PMC free article] [PubMed] [Google Scholar]
- 16.Ma J, Sawai H, Ochi N, et al. PTEN regulates angiogenesis through PI3K/Akt/VEGF signaling pathway in human pancreatic cancer cells. Mol Cell Biochem. 2009;331:161–71. doi: 10.1007/s11010-009-0154-x. [DOI] [PubMed] [Google Scholar]
- 17.Tahara A, Tsukada J, Tomura Y, et al. Vasopressin induces human mesangial cell growth via induction of vascular endothelial growth factor secretion. Neuropeptides. 2011;45:105–11. doi: 10.1016/j.npep.2010.12.001. [DOI] [PubMed] [Google Scholar]
- 18.Boontheekul T, Mooney DJ. Protein-based signaling systems in tissue engineering. Curr Opin Biotechnol. 2003;14:559–65. doi: 10.1016/j.copbio.2003.08.004. [DOI] [PubMed] [Google Scholar]
- 19.Zhao T, Zhao W, Chen Y, et al. Differential expression of vascular endothelial growth factor isoforms and receptor subtypes in the infarcted heart. Int J Cardiol. 2013;167:2638–45. doi: 10.1016/j.ijcard.2012.06.127. [DOI] [PMC free article] [PubMed] [Google Scholar]
- 20.Richart A, Loyer X, Neri T, et al. MicroRNA-21 coordinates human multipotent cardiovascular progenitors therapeutic potential. Stem Cells. 2014;32:2908–22. doi: 10.1002/stem.1789. [DOI] [PubMed] [Google Scholar]
- 21.Li X, Zhang Y, Qi G. Evaluation of isolation methods and culture conditions for rat bone marrow mesenchymal stem cells. Cytotechnology. 2013;65:323–34. doi: 10.1007/s10616-012-9497-3. [DOI] [PMC free article] [PubMed] [Google Scholar]
- 22.Nishida M, Carley WW, Gerritsen ME, et al. Isolation and characterization of human and rat cardiac microvascular endothelial cells. Am J Physiol. 1993;264:H639–52. doi: 10.1152/ajpheart.1993.264.2.H639. [DOI] [PubMed] [Google Scholar]
- 23.Shim TJ, Bae JW, Kim YJ, et al. Cardioprotective effects of 3-phosphoinositide-dependent protein kinase-1 on hypoxic injury in cultured neonatal rat cardiomyocytes and myocardium in a rat myocardial infarct model. Biosci Biotechnol Biochem. 2012;76:101–7. doi: 10.1271/bbb.110562. [DOI] [PubMed] [Google Scholar]
- 24.Qian X, Dong H, Hu X, et al. Analysis of the interferences in quantitation of a site-specifically PEGylated exendin-4 analog by the Bradford method. Anal Biochem. 2014;465:50–52. doi: 10.1016/j.ab.2014.06.009. [DOI] [PubMed] [Google Scholar]
- 25.Small EM, Olson EN. Pervasive roles of microRNAs in cardiovascular biology. Nature. 2011;469:336–42. doi: 10.1038/nature09783. [DOI] [PMC free article] [PubMed] [Google Scholar]
- 26.Tedgui A, Mallat Z. Cytokines in atherosclerosis: Pathogenic and regulatory pathways. Physiol Rev. 2006;86:515–81. doi: 10.1152/physrev.00024.2005. [DOI] [PubMed] [Google Scholar]
- 27.Bonauer A, Carmona G, Iwasaki M, et al. MicroRNA-92a controls angiogenesis and functional recovery of ischemic tissues in mice. Science. 2009;324:1710–13. doi: 10.1126/science.1174381. [DOI] [PubMed] [Google Scholar]
- 28.Loyer X, Potteaux S, Vion AC, et al. Inhibition of microRNA-92a prevents endothelial dysfunction and atherosclerosis in mice. Circ Res. 2014;114:434–43. doi: 10.1161/CIRCRESAHA.114.302213. [DOI] [PubMed] [Google Scholar]
- 29.Wu W, Xiao H, Laguna-Fernandez A, et al. Flow-dependent regulation of Kruppel-like factor 2 is mediated by microRNA-92a. Circulation. 2011;124:633–41. doi: 10.1161/CIRCULATIONAHA.110.005108. [DOI] [PMC free article] [PubMed] [Google Scholar]
- 30.Zhou J, Wang KC, Wu W, et al. MicroRNA-21 targets peroxisome proliferators-activated receptor-alpha in an autoregulatory loop to modulate flow-induced endothelial inflammation. Proc Natl Acad Sci USA. 2011;108:10355–60. doi: 10.1073/pnas.1107052108. [DOI] [PMC free article] [PubMed] [Google Scholar]
- 31.Fang Y, Davies PF. Site-specific microRNA-92a regulation of Kruppel-like factors 4 and 2 in atherosusceptible endothelium. Arterioscler Thromb Vasc Biol. 2012;32:979–87. doi: 10.1161/ATVBAHA.111.244053. [DOI] [PMC free article] [PubMed] [Google Scholar]
- 32.Toldo S, Das A, Mezzaroma E, et al. Induction of microRNA-21 with exogenous hydrogen sulfide attenuates myocardial ischemic and inflammatory injury in mice. Circ Cardiovasc Genet. 2014;7:311–20. doi: 10.1161/CIRCGENETICS.113.000381. [DOI] [PMC free article] [PubMed] [Google Scholar]
- 33.Olson JM, Yan Y, Bai X, et al. Up-regulation of microRNA-21 mediates isoflurane-induced protection of cardiomyocytes. Anesthesiology. 2015;122:795–805. doi: 10.1097/ALN.0000000000000567. [DOI] [PMC free article] [PubMed] [Google Scholar]
- 34.Liu B, Peng XC, Zheng XL, et al. MiR-126 restoration down-regulate VEGF and inhibit the growth of lung cancer cell lines in vitro and in vivo. Lung Cancer. 2009;66:169–75. doi: 10.1016/j.lungcan.2009.01.010. [DOI] [PubMed] [Google Scholar]
- 35.Liu LZ, Li C, Chen Q, et al. MiR-21 induced angiogenesis through AKT and ERK activation and HIF-1alpha expression. PLoS One. 2011;6:e19139. doi: 10.1371/journal.pone.0019139. [DOI] [PMC free article] [PubMed] [Google Scholar]
- 36.Kim SH, Moon HH, Kim HA, et al. Hypoxia-inducible vascular endothelial growth factor-engineered mesenchymal stem cells prevent myocardial ischemic injury. Mol Ther. 2011;19:741–50. doi: 10.1038/mt.2010.301. [DOI] [PMC free article] [PubMed] [Google Scholar]
- 37.Kranz A, Rau C, Kochs M, Waltenberger J. Elevation of vascular endothelial growth factor-A serum levels following acute myocardial infarction. Evidence for its origin and functional significance. J Mol Cell Cardiol. 2000;32:65–72. doi: 10.1006/jmcc.1999.1062. [DOI] [PubMed] [Google Scholar]
- 38.Konopka A, Janas J, Piotrowski W, Stepinska J. Concentration of vascular endothelial growth factor in patients with acute coronary syndrome. Cytokine. 2013;61:664–69. doi: 10.1016/j.cyto.2012.12.001. [DOI] [PubMed] [Google Scholar]
- 39.Nowak D, Kozlowska H, Gielecki JS, et al. Cardiomyopathy in the mouse model of Duchenne muscular dystrophy caused by disordered secretion of vascular endothelial growth factor. Med Sci Monit. 2011;17(11):BR332–38. doi: 10.12659/MSM.882043. [DOI] [PMC free article] [PubMed] [Google Scholar]
- 40.Weng LP, Smith WM, Brown JL, Eng C. PTEN inhibits insulin-stimulated MEK/MAPK activation and cell growth by blocking IRS-1 phosphorylation and IRS-1/Grb-2/Sos complex formation in a breast cancer model. Hum Mol Genet. 2001;10:605–16. doi: 10.1093/hmg/10.6.605. [DOI] [PubMed] [Google Scholar]
- 41.Meng F, Henson R, Wehbe-Janek H, et al. MicroRNA-21 regulates expression of the PTEN tumor suppressor gene in human hepatocellular cancer. Gastroenterology. 2007;133:647–58. doi: 10.1053/j.gastro.2007.05.022. [DOI] [PMC free article] [PubMed] [Google Scholar]
- 42.Harris VK, Coticchia CM, Kagan BL, et al. Induction of the angiogenic modulator fibroblast growth factor-binding protein by epidermal growth factor is mediated through both MEK/ERK and p38 signal transduction pathways. J Biol Chem. 2000;275:10802–11. doi: 10.1074/jbc.275.15.10802. [DOI] [PubMed] [Google Scholar]
- 43.Xia C, Meng Q, Cao Z, et al. Regulation of angiogenesis and tumor growth by p110 alpha and AKT1 via VEGF expression. J Cell Physiol. 2006;209:56–66. doi: 10.1002/jcp.20707. [DOI] [PubMed] [Google Scholar]
- 44.Ye ZL, Huang Y, Li LF, et al. Argonaute 2 promotes angiogenesis via the PTEN/VEGF signaling pathway in human hepatocellular carcinoma. Acta Pharmacol Sin. 2015;36:1237–45. doi: 10.1038/aps.2015.18. [DOI] [PMC free article] [PubMed] [Google Scholar]


