

Abstract
The Polycomb PRC1 plays essential roles in development and disease pathogenesis. Targeting of PRC1 to chromatin is thought to be mediated by the Cbx family proteins (Cbx2/4/6/7/8) binding to histone H3 with a K27me3 modification (H3K27me3). Despite this prevailing view, the molecular mechanisms of targeting remain poorly understood. Here, by combining live-cell single-molecule tracking (SMT) and genetic engineering, we reveal that H3K27me3 contributes significantly to the targeting of Cbx7 and Cbx8 to chromatin, but less to Cbx2, Cbx4, and Cbx6. Genetic disruption of the complex formation of PRC1 facilitates the targeting of Cbx7 to chromatin. Biochemical analyses uncover that the CD and AT-hook-like (ATL) motif of Cbx7 constitute a functional DNA-binding unit. Live-cell SMT of Cbx7 mutants demonstrates that Cbx7 is targeted to chromatin by co-recognizing of H3K27me3 and DNA. Our data suggest a novel hierarchical cooperation mechanism by which histone modifications and DNA coordinate to target chromatin regulatory complexes.
DOI: http://dx.doi.org/10.7554/eLife.17667.001
Research Organism: None
Introduction
Chemical covalent modification of histones and DNA regulates the chromatin structure states that play central roles in chromatin-templated biological processes (Jenuwein and Allis, 2001; Li et al., 2007a; Luco et al., 2011; Ruthenburg et al., 2007). This is exemplified by Polycomb group (PcG) proteins that function as histone-modifying enzymes and regulate gene expression via modulating higher order chromatin structures (Simon and Kingston, 2013). PcG proteins were initially identified as a body structure specification in Drosophila (Lewis, 1978). In mammals, PcG orthologs are essential for normal embryonic development and disease pathogenesis (Helin and Dhanak, 2013). For example, PcG subunits are frequently overexpressed or mutated in cancer, and perturbing PcG interactions can suppress cancer growth (Helin and Dhanak, 2013). Because of their clinical significance, enormous efforts have been devoted to develop drugs for targeting PcG subunits (Helin and Dhanak, 2013). However, the molecular mechanisms by which PcG proteins establish and maintain repressive Polycomb domains are still incompletely understood.
PcG proteins are generally found in one of two major protein complexes, the Polycomb repressive complex 1 or 2 (PRC1 or PRC2) (Simon and Kingston, 2013). PRC2 is a methyltransferase that catalyzes di- and tri-methylation of lysine 27 on histone H3 (H3K27me2/3) by the SET domain of Ezh2 (or Ezh1) (Cao et al., 2002; Czermin et al., 2002; Kuzmichev et al., 2002; Margueron et al., 2008; Muller et al., 2002; Shen et al., 2008). Unlike most SET domain methyltransferases, Ezh2 requires Suz12 and Eed for enzymatic activity (Cao and Zhang, 2004; Martin et al., 2006; Montgomery et al., 2005; Pasini et al., 2004). Additionally, Rbbp4 and Rbbp7 are stoichiometric subunits of PRC2 (Cao et al., 2002; Cao and Zhang, 2004; Margueron and Reinberg, 2011). In contrast, PRC1 is an ubiquitin ligase that monoubiquitylates histone H2A on lysine 119 (H2AK119ub1) (de Napoles et al., 2004; Wang et al., 2004a). PRC1 complexes form around Ring1b (or Ring1a) subunits with which one of the six Pcgf proteins (Pcgf1-6) associates (Gao et al., 2012; Gil and O'Loghlen, 2014; Tavares et al., 2012). The Ring-Pcgf2 (Mel18) or Pcgf4 (Bmi1) heterodimers are incorporated in canonical PRC1 (Cbx-PRC1; the functional homolog to Drosophila PRC1) and the other Ring-Pcgf heterodimers are assembled in variant PRC1 (vPRC1). The Cbx-PRC1 complex is composed of one of each of four different core subunits, Ring1 (Ring1a/Ring1b), Pcgf (Mel18/Bmi1), Phc (Phc1/2/3), and Cbx (Cbx2/4/6/7/8). In contrast, the vPRC1 complexes contain Rybp or Yaf instead of Cbx and Phc.
Several mechanisms underlying the targeting of PRC1 to chromatin have been documented (Blackledge et al., 2015; Simon and Kingston, 2013). Initial studies of Drosophila PcG (dPcG) proteins have suggested a mechanism of the PRC2-mediated recruitment of PRC1 (Cao et al., 2002; Min et al., 2003; Wang et al., 2004b). dPRC2 is recruited to Polycomb response elements (PRE) by its interaction with sequence-specific DNA-binding proteins and then modifies chromatin with H3K27me3 that recruits dPRC1. Consistent with the notion, genetic analyses have demonstrated that dPRC1 and dPRC2 co-regulate PcG target genes and dPRC1 is displaced from chromatin in dPRC2 mutants (Cao et al., 2002; Wang et al., 2004b). Genome-wide studies have shown that dPRC1 and dPRC2 co-occupy many PcG target genes (Schwartz et al., 2006).
In mammals, the recruitment of PRC1 is enigmatic and complicated, and has been broadly defined as H3K27me3-dependent and –independent recruitment mechanisms (Blackledge et al., 2015; Farcas et al., 2012; He et al., 2013; Tavares et al., 2012). An additional layer of complexity is added when considering that PRC1, in some cases, recruits PRC2 (Blackledge et al., 2014; Cooper et al., 2014; Kalb et al., 2014). The H3K27me3-dependent recruitment of mammalian PRC1 originates from the Drosophila model and is based on the facts that the Cbx family members and dPc both contain a conserved chromodomain (CD) (Blackledge et al., 2015). The model is consistent with studies demonstrating a link between H3K27me3 and PRC1 recruitment (Agger et al., 2007; Boyer et al., 2006; Lee et al., 2007; Mujtaba et al., 2008). Although the model for the mammalian Cbx-PRC1 recruitment is prevalent, several lines of evidence argue against the proposed model as a general mechanism of action. First, unlike to the dPc CD, the Cbx CDs have a much weaker affinity for H3K27me3 (Bernstein et al., 2006; Kaustov et al., 2011; Tardat et al., 2015). The Cbx2 CD shows preference for H3K27me3 while the Cbx4 and Cbx7 CDs exhibit preference for H3K9me3 (Bernstein et al., 2006; Kaustov et al., 2011; Tardat et al., 2015). The affinity of the Cbx6 and Cbx8 CDs for H3K27me3 is nearly undetectable (Bernstein et al., 2006; Kaustov et al., 2011). One question is whether the recognition of H3K27me3 by the Cbx CDs is required for the targeting of Cbx proteins to chromatin. Likewise, genome-wide approaches have demonstrated that H3K27me3 forms a broad domain and the binding PRC1 is sharply localized within the H3K27me3 domain, and that a subset of H3K27me3 domains corresponds to PRC1 binding sites (Ku et al., 2008). Thus, there are missing molecular links between genetic, biochemical, and genome-wide analysis for our understanding of how the Cbx-PRC1 complexes are targeted to chromatin.
Single-molecule techniques have been widely applied to study DNA- and chromatin-templated processes in vitro and provide insights into genetic information flow in vivo (Bell and Kowalczykowski, 2016; Dangkulwanich et al., 2014; Duzdevich et al., 2014; Geertsema and van Oijen, 2013; Harada et al., 2016; Herbert et al., 2008; Li et al., 2004; Ngo et al., 2015; Ren et al., 2003; Ren et al., 2006; Tatavosian et al., 2015). Recent advances in single-molecule imaging allow measuring the quantitative kinetics of gene control in living mammalian cells (Chen et al., 2014; Coleman et al., 2015; Gebhardt et al., 2013; Grimm et al., 2015; Izeddin et al., 2014; Katz et al., 2016; Knight et al., 2015; Liu et al., 2015, 2014; Mazza et al., 2012, 2013; Morisaki et al., 2014; Normanno et al., 2015; Swinstead et al., 2016; Zhang et al., 2014). Here, we combine live-cell SMT and genetic engineering to determine whether H3K27me3 is required for the targeting of Cbx proteins to chromatin and to dissect the targeting mechanisms. Single-molecule quantitative measurement is used to determine the kinetics and dynamics of the Cbx protein interactions with chromatin in living mouse embryonic stem (mES) cells. The analyses demonstrate a new functional role of the Cbx-PRC1 complex formation in the targeting of Cbx7 to chromatin and uncover the molecular mechanism underlying the targeting of Cbx7 to chromatin and fill in the knowledge gap between genetic, biochemical, and genome-wide analyses. These results contribute significantly to our quantitative understanding of kinetics and dynamics of the Cbx-PRC1 proteins in living cells, allowing us to suggest the molecular mechanisms underlying how the Cbx-PRC1 complexes are targeted to chromatin.
Results
Validation of live-cell SMT using HaloTag and histone H2A fused to HaloTag
To investigate the Cbx proteins binding dynamics at endogenous genomic loci, we performed SMT to determine diffusion and chromatin binding properties of individually fluorescently labeled Cbx molecules within living mES cells. HaloTag was fused at the N-terminus of Cbx proteins under an inducible, tetracycline response element (TRE)-tight promoter (Figure 1A). These fusion genes were stably integrated into the genome of wild-type (PGK12.1) mES cells. We used highly inclined thin illumination (HILO) to avoid stray-light reflection and to reduce background from cell auto-fluorescence (Tokunaga et al., 2008) (Figure 1B). The HaloTag ligand of the bright, photostable fluorophore Janelia Fluor 549 (JF549) allowed for visualization of single HaloTag-Cbx molecules at their basal expression level without doxycycline induction (Grimm et al., 2015) (Figure 1C).
Figure 1. The Cbx family members exhibit distinct dynamics in living mES cells.
(A) The sequences encoding the five Cbx proteins were fused with HaloTag to generate the HaloTag-Cbx fusions that were stably expressed in wild-type (PGK12.1) mES cells. The expression level of HaloTag-Cbx fusions was controlled by Tet-responsive element (TRE). HaloTag is shown in yellow, CD (chromodomain) in red, AT (AT-hook) motif in light blue; ATL (AT-hook-like) motif in cyan, and Cbox (chromobox) in emerald. (B) Schematic representation of highly inclined and laminated optical sheet (HILO) microscopy. (C) Live-cell single-molecule visualization of HaloTag-Cbx7 molecules in mES cells during a 30-ms exposure. Oval white dash circle outlines the nucleus of the cell. The individual white points represent single HaloTag-Cbx7 molecules. Scale bar, 2 µm. (D) Normalized histograms of the log maximum likelihood diffusion coefficient for H2A-HaloTag (N = 19 cells, n = 2675 trajectories) and HaloTag-NLS (N = 69 cells, n = 2087 trajectories) in wild-type mES cells. The H2A-HaloTag histogram was fitted with a three-component Gaussian and the HaloTag-NLS histogram a two-component Gaussian. The color bars indicate that the fraction of proteins in the chromatin-bound (CB, red), intermediate (ID, cyan), and fast diffusion (FD, green) population. NLS, nuclear localization sequence. (E) Normalized histograms of the log maximum likelihood diffusion coefficient for HaloTag-Cbx2 (N = 44 cells, n = 2833 trajectories), HaloTag-Cbx4 (N = 34 cells, n = 11,343 trajectories), HaloTag-Cbx6 (N = 33 cells, n = 7457 trajectories), HaloTag-Cbx7 (N = 51 cells, n = 3097 trajectories), and HaloTag-Cbx8 (N = 36 cells, n = 3351 trajectories) in wild-type mES cells. The histograms were fitted with a three-component Gaussian. (F) Fraction of the CB (red), ID (cyan), and FD (green) population for H2A-HaloTag, HaloTag-NLS, HaloTag-Cbx2, HaloTag-Cbx4, HaloTag-Cbx6, HaloTag-Cbx7, and HaloTag-Cbx8. The data were obtained from Figure 1D and E fitted with a Gaussian. Results are means ± SD.
DOI: http://dx.doi.org/10.7554/eLife.17667.002

Figure 1—figure supplement 1. Comparison of the analysis.

Figure 1—figure supplement 2. Control experiments for testing the effects of the endogenous Cbx7 protein on the kinetic fractions of the exogenous HaloTag-Cbx7 fusion.
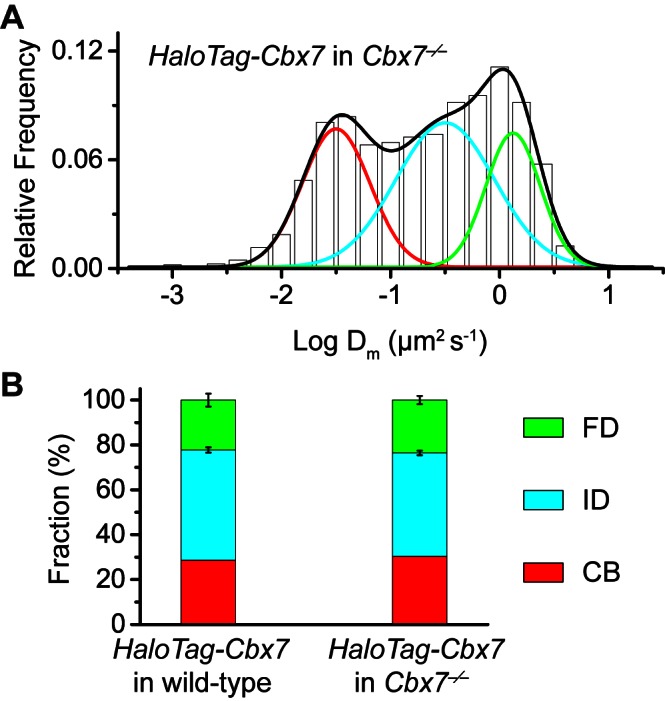
Figure 1—figure supplement 3. Control experiments for analyzing the protein level of HaloTag-Cbx7 and for testing whether HaloTag-Cbx7 occupies Polycomb target promoters.

To validate our live-cell SMT system, we investigated HaloTag-NLS (NLS, nucleus localization sequence) and H2A-HaloTag. A visual inspection of single-molecule imaging tracks showed HaloTag-NLS and H2A-HaloTag exhibited obvious differences (Video 1 and 2). The majority of H2A-HaloTag molecules were stationary while almost every HaloTag-NLS molecules were mobile. Analysis of the distributions of track length for HaloTag labelled molecules indicated that ∼15–35% of the tracks have a frame number ≤ 3 (Figure 1—figure supplement 1A). To avoid bias toward slowly moving molecules, we calculated the maximum likelihood diffusion coefficient () per track during a fixed time interval of 30 ms and constructed the distributions for HaloTag-NLS and H2A-HaloTag (Figure 1D and Figure 1—source data 1). The histograms for H2A-HaloTag were fitted with three populations (see Materials and methods): F1 (), F2 (), and F3 (). We measured F1 = (72 ± 1)% (= 0.032 ± 0.001 µm2s-1), F2 = (14 ± 2)% (= 0.50 ± 0.06 µm2s-1), and F3 = (14 ± 2)% (= 2.4 ± 0.2 µm2s-1) (Figure 1F and Supplementary file 1). The histograms for HaloTag-NLS were fitted with two populations since the fitting with a three-component Gaussian function using the fixed value = 0.032 µm2s-1 did not converge (see Materials and methods): F2 () and F3 (). We measured F2 = (71 ± 1)% (= 0.24 ± 0.03 µm2s-1) and F3 = (29 ± 2)% (= 2.5 ± 0.1 µm2s-1) (Figure 1F and Supplementary file 1). We designated the F1 component as the chromatin-bound (CB) population, whose slow motion reflects the chromosomal dynamics and measurement uncertainties, F2 as the intermediate diffusion (ID) population, whose motion reflects non-specific interaction with chromatin or confined movement, and F3 as the fast diffusion (FD) population, whose motion reflects freely diffusing molecules. Experimental evidence supports the assignment of the F1 component as the CB population because (1) the CB population of HaloTag-NLS is almost undetectable, (2) ∼70% of H2A-HaloTag molecules are incorporated into chromatin, which is consistent with the reported results from fluorescence photobleaching after recovery (Ren et al., 2008), and (3) the diffusion constant and fractional size of the CB population of H2A-HaloTag agree with recent single-molecule reports (Gebhardt et al., 2013; Mazza et al., 2012).
Video 1. H2A-HaloTag in wild-type mES cells (Fractional studies).
Video 2. HaloTag-NLS in wild-type mES cells (Fractional studies).
The above analysis involves averaging over independent pairs of the squared jump distance of a single trajectory with a 30-ms interval. Such averaging might obscure transitions between chromatin-binding, confined, and Brownian motion for the single trajectory of a particle within the observation time. To investigate whether the averaging affects resolving the kinetic fractions, we calculated based on the squared jump distance between the initial position and the first position of a single-trajectory with a 30-ms interval, and constructed the distribution (Figure 1—figure supplement 1B and Figure 1—source data 1). Counting only the first displacement of each track has been reported previously for studying of transcription factors binding to DNA (Gebhardt et al., 2013). The fractional sizes of the individual populations obtained from the analysis were comparable to those obtained from the analysis (Figure 1—figure supplement 1C). Since a typical histogram visually resolved populations better than a typical histogram (Figure 1D–E and Figure 1—figure supplement 1B), we performed our analysis using the analysis throughout the text.
Distinct chromatin-binding behaviors among the Cbx proteins
At the single-molecule level, we quantitatively measured diffusion constants and chromatin-binding levels of the Cbx proteins in mES cells (Video 3—7). We fitted the histograms with a three-component Gaussian function and calculated the diffusion constants and the fractional sizes of the individual populations (Figure 1E and Figure 1—source data 1). Since the peak centers of the CB populations for the HaloTag-Cbx proteins were almost the same as that for H2A-HaloTag, we fixed to be the value −1.5 (= 0.032 µm2s-1)(see Materials and methods). We measured F1 = (30 ± 1)%, F2 = (61 ± 1)%, and F3 = (9 ± 4)% for HaloTag-Cbx2, F1 = (10 ± 1)%, F2 = (50 ± 1)%, and F3 = (40 ± 2)% for HaloTag-Cbx4, F1 = (17 ± 1)%, F2 = (47 ± 2)%, and F3 = (36 ± 3)% for HaloTag-Cbx6, F1 = (29 ± 1)%, F2 = (49 ± 1)%, and F3 = (22 ± 3)% for HaloTag-Cbx7, and F1 = (26 ± 1)%, F2 = (50 ± 2)%, and F3 = (24 ± 4)% for HaloTag-Cbx8 (Figure 1F and Supplementary file 1). To complement the analysis, we also performed the analysis for HaloTag-Cbx7 (Figure 1—figure supplement 1B and Figure 1—source data 1). The fractional sizes obtained from the analysis were comparable to those obtained from the analysis (Figure 1—figure supplement 1C). These data provided a few novel observations: (1) the Cbx proteins exhibit distinct chromatin-associating capacities, (2) Cbx2, Cbx7, and Cbx8 exhibit the highest chromatin-bound level while Cbx4 has the lowest one, (3) the fractional sizes of the FD components are distinct among the Cbx family proteins, (4) except for Cbx2, the fractional sizes of the ID components are similar among the Cbx proteins, and (5) among the Cbx proteins, the diffusion constants are distinct for the ID components, but similar for the FD components. Altogether, our results demonstrate that the Cbx proteins employ distinct ways to interact with chromatin and to explore the nucleus.
Video 3. HaloTag-Cbx2 in wild-type mES cells (Fractional studies).
Video 4. HaloTag-Cbx4 in wild-type mES cells (Fractional studies).
Video 5. HaloTag-Cbx6 in wild-type mES cells (Fractional studies).
Video 6. HaloTag-Cbx7 in wild-type mES cells (Fractional studies).
Video 7. HaloTag-Cbx8 in wild-type mES cells (Fractional studies).
The above SMT experiments were performed in wild-type mES cells where the endogenous and exogenous (fusion) proteins co-exist. HaloTag may make the fusion proteins less-equal competition with their endogenous counterparts. Given that Cbx7 is the major Cbx protein within mES cells (Morey et al., 2013; Morey et al., 2012), we integrated HaloTag-Cbx7 to the genome of Cbx7−/− mES cells and performed SMT (Video 8). We measured F1 = (30 ± 1)%, F2 = (46 ± 1)%, and F3 = (24 ± 2)% for HaloTag-Cbx7, which are comparable to those obtained from HaloTag-Cbx7 in wild-type mES cells (Figure 1—figure supplement 2A–B, Supplementary file 1, and Figure 1—source data 1). Next, we performed biochemical analysis of Cbx7. Immunoblotting indicated that the level of HaloTag-Cbx7 protein was less than that of its endogenous counterpart (Figure 1—figure supplement 3A). Chromatin immunoprecipitation (ChIP) analysis indicated that HaloTag antibody greatly precipitated promoters of Polycomb target genes from HaloTag-Cbx7/Cbx7−/− mES cells, but much less from wild-type mES cells (Figure 1—figure supplement 3B), suggesting that the HaloTag-Cbx7 protein binds to Polycomb target genes.
Video 8. HaloTag-Cbx7 in Cbx7 KO mES cells (Fractional studies).
H3K27me3 is important for the targeting of Cbx7 and Cbx8 to chromatin, but plays a less important role for Cbx2, Cbx4, and Cbx6
To investigate if H3K27me3 is required for the targeting of Cbx proteins to chromatin within mES cells (Figure 2—figure supplement 1A), we integrated HaloTag-Cbx fusion genes into the genome of Eed−/− mES cells. Eed is a core component of PRC2 (Margueron and Reinberg, 2011). H3K27me3 was almost undetectable in Eed−/− mES cells (Figure 2E). We performed SMT of HaloTag-Cbx proteins in Eed−/− mES cells (Video 9—13). The histograms for HaloTag-Cbx2, HaloTag-Cbx4, HaloTag-Cbx6, and HaloTag-Cbx8 were fitted with three populations (Figure 2A and Figure 2—source data 1). The histograms for HaloTag-Cbx7 were fitted with two populations rather than three populations since the fitting with a three-component Gaussian function using the fixed value = 0.032 µm2s−1 did not converge (see Materials and methods). We measured F1 = (26 ± 1)%, F2 = (54 ± 1)%, and F3 = (20 ± 2)% for HaloTag-Cbx2, F1 = (14 ± 1)%, F2 = (65 ± 1)%, and F3 = (21 ± 2)% for HaloTag-Cbx4, F1 = (13 ± 1)%, F2 = (52 ± 1)%, and F3 = (35 ± 2)% for HaloTag-Cbx6, F2 = (65 ± 3)% and F3 = (35 ± 6)% for HaloTag-Cbx7, and F1 = (8 ± 2)%, F2 = (40 ± 1)% and F3 = (52 ± 1)% for HaloTag-Cbx8 (Figure 2D and Supplementary file 1). By comparing these results to those obtained from wild-type mES cells, two conclusions could be made: (1) the CB components of Cbx7 and Cbx8 are either nearly undetectable or significantly reduced, suggesting that H3K27me3 contributes significantly to the targeting of Cbx7 and Cbx8 to chromatin, and (2) the levels of the CB components for Cbx2, Cbx4, and Cbx6 are similar or slightly reduced, suggesting that in contrast to Cbx7 and Cbx8, H3K27me3 plays a less important role in the targeting of Cbx2, Cbx4, and Cbx6 to chromatin. Taken together, our results demonstrate that H3K27me3 has distinct roles in the dynamic behaviors of the Cbx proteins and is important for the targeting of Cbx7 and Cbx8 to chromatin in mES cells, but plays a less important role for Cbx2, Cbx4, and Cbx6.
Video 9. HaloTag-Cbx2 in Eed KO mES cells (Fractional studies).
Video 10. HaloTag-Cbx4 in Eed KO mES cells (Fractional studies).
Video 11. HaloTag-Cbx6 in Eed KO mES cells (Fractional studies).
Video 12. HaloTag-Cbx7 in Eed KO mES cells (Fractional studies).
Video 13. HaloTag-Cbx8 in Eed KO mES cells (Fractional studies).
Figure 2. H3K27me3 is important for the targeting of Cbx7 and Cbx8 to chromatin, but plays a less important role for Cbx2, Cbx4, and Cbx6.
(A) Normalized histograms of the log maximum likelihood diffusion coefficient for HaloTag-Cbx2 (N = 27 cells, n = 2471 trajectories), HaloTag-Cbx4 (N = 21 cells, n = 3254 trajectories), HaloTag-Cbx6 (N = 11 cells, n = 4860 trajectories), HaloTag-Cbx7 (N = 25 cells, n = 453 trajectories), and HaloTag-Cbx8 (N = 47 cells, n = 5825 trajectories) in Eed−/− mES cells. The distributions for HaloTag-Cbx2, HaloTag-Cbx4, HaloTag-Cbx6, and HaloTag-Cbx8 were fitted with three populations while the distribution for HaloTag-Cbx7 with two populations. (B) Normalized histograms of the log maximum likelihood diffusion coefficient for HaloTag-Cbx7 (N = 26 cells, n = 3874 trajectories) and HaloTag-Cbx8 (N = 42 cells, n = 9220 trajectories) in Ezh2−/− mES cells. The distributions were fitted with three components. (C) Normalized histograms of the log maximum likelihood diffusion coefficient for HaloTag-Cbx7 in Y-Eed/Eed−/− (N = 16 cells, n = 1733 trajectories) and Y-Ezh2/Ezh2−/− (N = 14 cells, n = 846 trajectories) mES cells. The histograms were fitted with a three-component Gaussian. (D) Chromatin-bound fraction for HaloTag-Cbx2, HaloTag-Cbx4, HaloTag-Cbx6, HaloTag-Cbx7, and HaloTag-Cbx8 in wild-type (red solid), Eed−/− (red strip), and Ezh2−/− (red cross-strip) mES cells, and for HaloTag-Cbx7 and HaloTag-Cbx8 in Y-Eed/Eed−/− (yellow solid) andY-Ezh2/Ezh2−/− (dark yellow solid) mES cells. The data were obtained from Figure 1E, Figure 2A–C, and Figure 2—figure supplement 1B–C fitted with a Gaussian function. Results are means ± SD. (E) Immunostaining of H3K27me3 in wild-type, Eed−/−, Ezh2−/−, Y-Eed/Eed−/−, and Y-Ezh2/Ezh2−/− mES cells by using antibody directed against H3K27me3 (green). DNA was stained with hoechst (red). Overlay images are shown. Note that H3K27me3 staining is visible in Ezh2−/− mES cells because of the redundancy of Ezh1. Scale bar is 5 µm.
DOI: http://dx.doi.org/10.7554/eLife.17667.015

Figure 2—figure supplement 1. Additional experiments for HaloTag-Cbx in Eed−/−and Ezh2−/−mES cells.

To further investigate the role of H3K27me3 in the targeting of the Cbx proteins to chromatin, we integrated HaloTag-Cbx fusion genes into the genome of Ezh2−/− mES cells. Ezh2 is the catalytic subunit of PRC2 (Margueron and Reinberg, 2011). The level of H3K27m3 was greatly reduced in Ezh2−/−mES cells in comparison with wild-type mES cells (Figure 2E). The residual level of H3K27me3 was most likely contributed by Ezh1 (Margueron et al., 2008; Shen et al., 2008). We performed SMT of HaloTag-Cbx proteins in Ezh2−/− mES cells (Video 14–18). The CB levels of HaloTag-Cbx2, HaloTag-Cbx4, and HaloTag-Cbx6 in Ezh2−/− mES cells were similar to that in wild-type mES cells (Figure 2D, Figure 2—figure supplement 1B, Supplementary file 1, and Figure 2—source data 1). The fractional sizes of the CB components for HaloTag-Cbx7 and HaloTag-Cbx8 in Ezh2−/− mES cells were greatly reduced, in comparison with that in wild-type mES cells (Figure 2B and D, Supplementary file 1, and Figure 2—source data 1). Thus, our data further suggest that H3K27me3 is important for the targeting of Cbx7 and Cbx8 to chromatin, but plays a less important role for Cbx2, Cbx4, and Cbx6.
Video 14. HaloTag-Cbx2 in Ezh2 KO mES cells (Fractional studies).
Video 15. HaloTag-Cbx4 in Ezh2 KO mES cells (Fractional studies).
Video 16. HaloTag-Cbx6 in Ezh2 KO mES cells (Fractional studies).
Video 17. HaloTag-Cbx7 in Ezh2 KO mES cells (Fractional studies).
Video 18. HaloTag-Cbx8 in Ezh2 KO mES cells (Fractional studies).
To dissect whether H3K27me3 has a direct role in the targeting of Cbx7 and Cbx8 to chromatin, we integrated HaloTag-Cbx7/YFP-Eed and HaloTag-Cbx8/YFP-Eed into the genome of Eed−/−mES cells and performed SMT of HaloTag-Cbx7 and HaloTag-Cbx8 (Video 19 and 20). The introduction of YFP-Eed fusion gene into Eed−/−mES cells restored the defective H3K27me3 level (Figure 2E). We measured F1 = (29 ± 1)% for HaloTag-Cbx7 and F1 = (27 ± 1)% for HaloTag-Cbx8, both of which are comparable to those obtained from wild-type mES cells (Figure 2C and D, Figure 2—figure supplement 1C, Supplementary file 1, and Figure 2—source data 1). Next, we integrated HaloTag-Cbx7/YFP-Ezh2 and HaloTag-Cbx8/YFP-Ezh2 into the genome of Ezh2−/−mES cells. The introduction of YFP-Ezh2 into Ezh2−/− mES cells restored both the defective H3K27me3 level and the defective CB levels of HaloTag-Cbx7 and HaloTag-Cbx8 (Figure 2C–2E, Figure 2—figure supplement 1C, Supplementary file 1, Video 21 and 22, and Figure 2—source data 1). Altogether, our results demonstrate that H3K27me3 contributes significantly to the targeting of Cbx7 and Cbx8 to chromatin in mES cells.
Video 19. HaloTag-Cbx7/Y-Eed in Eed KO mES cells (Fractional studies).
Video 20. HaloTag-Cbx8/Y-Eed in Eed KO mES cells (Fractional studies).
Video 21. HaloTag-Cbx7/Y-Ezh2 in Ezh2 KO mES cells (Fractional studies).
Video 22. HaloTag-Cbx8/Y-Ezh2 in Ezh2 KO mES cells (Fractional studies).
The Cbx7 CD contributes to, but is not efficient for the targeting of Cbx7 to chromatin
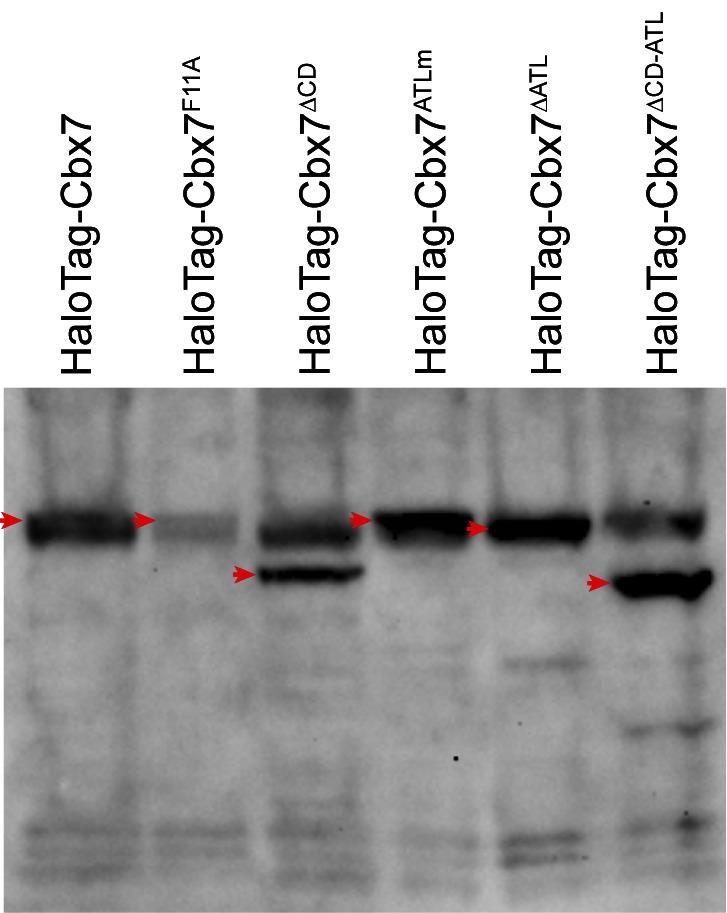
Our data indicate that among the Cbx family members, H3K27me3 is important for the targeting of Cbx7 and Cbx8 to chromatin, which seemingly does not reconcile with in vitro kinetic data where the Cbx7 CD (CDCbx7) has preference for H3K9me3 and the Cbx8 CD (CDCbx8) exhibit a weak affinity for both H3K27me3 and H3K9me3 (Bernstein et al., 2006; Kaustov et al., 2011; Tardat et al., 2015). In the following studies, we focused on the Cbx7 protein since (1) Cbx7 is smaller than Cbx8 (Figure 1A and Figure 3A); (2) Cbx7 contains three conserved domains while Cbx8 has four (Figure 1A and Figure 3A); (3) Cbx7-PRC1 is the major canonical PRC1 in mES cells (Morey et al., 2013; Morey et al., 2012); and (4) the expression of Cbx8 is nearly undetectable in mES cells (Morey et al., 2013; Morey et al., 2012). To test whether CDCbx7 binds to chromatin in living mES cells, we generated CDCbx7 fused with HaloTag (Figure 3A). The fusion was stably expressed in wild-type mES cells. We measured F1 = (8 ± 1)%, F2 = (54 ± 2)%, and F3 = (38 ± 2)% (Figure 3B and C, Video 23, Supplementary file 1, and Figure 3—source data 1). These data indicated that the fractional size of the CB component of HaloTag-CDCbx7 is below 30% of HaloTag-Cbx7, suggesting that CDCbx7 binds to chromatin less efficiently than Cbx7. Next, we generated Cbx7F11A and Cbx7△CD fused with HaloTag, respectively (Figure 3A). The F11A mutation has been shown to disrupt the interaction of CDCbx7 and H3K27me3 (Kaustov et al., 2011). The two fusions were stably and correctly expressed in wild-type mES cells (Figure 3—figure supplement 1). We measured F1 = (17 ± 1)%, F2 = (42 ± 3)%, and F3 = (41 ± 4)% for HaloTag-Cbx7F11A, and F1 = (13 ± 1)%, F2 = (44 ± 1)%, and F3 = (43 ± 2)% for Cbx7△CD (Figure 3B and C, Video 24 and 25, Supplementary file 1, and Figure 3—source data 1), indicating that the CB fractional levels of Cbx7F11A and Cbx7△CD are less than that of HaloTag-Cbx7, but more than that of CDCbx7. Taken together, our results imply that CDCbx7 is required, but not efficient for the targeting of Cbx7 to chromatin and that additional targeting mechanism(s) exist(s).
Video 23. HaloTag-CDCbx7 in wild-type mES cells (Fractional studies).
Video 24. HaloTag-Cbx7F11A in wild-type mES cells (Fractional studies).
Video 25. HaloTag-Cbx7△CD in wild-type mES cells (Fractional studies).
Figure 3. The Cbx7 CD is not efficient for the targeting of Cbx7 to chromatin.
(A) Schematic representation of Cbx7 variants. (B) Normalized histograms of the log maximum likelihood diffusion coefficient for HaloTag-Cbx7 replicated from Figure 1E and for HaloTag-CDCbx7 (N = 24 cells, n = 6600 trajectories), HaloTag-Cbx7F11A (N = 22 cells, n = 1882 trajectories), and HaloTag-Cbx7△CD (N = 15 cells, n = 5215 trajectories) in wild-type mES cells. The histograms of HaloTag-CDCbx7, HaloTag-Cbx7F11A, and HaloTag-Cbx7△CD were fitted with a three-component Gaussian. (C) Fraction of the CB, ID, and FD population for HaloTag-Cbx7 replicated from Figure 1F, HaloTag-CDCbx7, HaloTag-Cbx7F11A, and HaloTag-Cbx7△CD. The data were obtained from Figure 3B fitted with a Gaussian. Results are means ± SD.
DOI: http://dx.doi.org/10.7554/eLife.17667.033

Figure 3—figure supplement 1. Control experiments for analyzing the protein levels of the HaloTag-Cbx7 variants.
Effects of the Cbx7 CD on the residence time of Cbx7 at chromatin
To determine the binding kinetics, we measured the in vivo residence time of Cbx7 molecules bound to chromatin. To reduce the photobleaching of JF549, we performed time-lapse experiments at an integration time, τint, of 30 ms interspersed with a dark time, τd, of 170 ms (Figure 4A and Video 26). We calculated diffusion coefficients of individual HaloTag-Cbx7 molecules and considered molecules to be bound to chromatin if their was < 0.10 µm2/s. The dwell times of individual stationary Cbx7 molecules were directly measured as the lifetime of the fluorescence spots. The cumulative frequency distributions of dwell times were fitted with a two-component exponential decay function (see Materials and methods) (Figure 4B and Figure 4—source data 1), generating two populations: the transient chromatin-bound population (F1tb and τtb) and the stable chromatin-bound population (F1sb and τsb). We measured F1tb = (23.4 ± 1.1)% (τtb = 0.79 ± 0.01 s) and F1sb = (5.3 ± 0.4)% (τsb = 7.3 ± 0.1 s) (Figure 4C and 4D, Figure 4—figure supplement 1, Supplementary file 2, and Figure 4—source data 1). We then investigated the residence times of the Cbx7 variants at chromatin (Video 27–29). The residence times of the stable chromatin-bound populations were determined for HaloTag-CDCbx7 (τsb = 4.7 ± 0.1 s), HaloTag-Cbx7F11A (τsb = 5.8 ± 0.1 s), and HaloTag-Cbx7△CD (τsb = 4.7 ± 0.1 s) (Figure 4C and Supplementary file 2). Thus, the residence times of the stable chromatin-bound molecules of HaloTag-Cbx7F11A was longer than that of HaloTag-CDCbx7 and HaloTag-Cbx7△CD, but shorter than that of HaloTag-Cbx7 (Figure 4C and Supplementary file 2). The F1sb level of HaloTag-Cbx7F11A was higher than that of HaloTag-CDCbx7 and HaloTag-Cbx7△CD, but was less than that of HaloTag-Cbx7 (Figure 4D and Supplementary file 2). To allow visual comparison among Cbx7 and its variants, we plotted their survival probability in the same figure (Figure 4E and Figure 4—source data 1). We observed that HaloTag-Cbx7F11A stays a longer time at chromatin than HaloTag-CDCbx7 and HaloTag-Cbx7△CD, but a shorter time than HaloTag-Cbx7 (Figure 4E). Altogether, our results suggest that the interaction of H3K27me3 and CDCbx7 is not enough for the stabilizing of Cbx7 at chromatin.
Video 26. HaloTag-Cbx7 in wild-type mES cells (Residence time studies).
Video 27. HaloTag-CDCbx7 in wild-type mES cells (Residence time studies).
Video 28. HaloTag-Cbx7F11A in wild-type mES cells (Residence time studies).
Video 29. HaloTag-Cbx7△CD in wild-type mES cells (Residence time studies).
Figure 4. Effects of the Cbx7 CD on the residence time of Cbx7 at chromatin.
(A) Time-lapse imaging of HaloTag-Cbx7 at constant integration (τint = 30 ms) and dark (τd = 170 ms) time in wild-type mES cells. The red arrow indicates a molecule that binds to chromatin. The green arrow indicates a diffusing molecule. Molecules with < 0.10 µm2/s were selected to calculate residence time and survival probability. (B) Cumulative frequency distribution of the dwell times for HaloTag-Cbx7 (N = 17 cells, n = 2169 trajectories), HaloTag-CDCbx7 (N = 18 cells, n = 790 trajectories), HaloTag-Cbx7F11A (N = 25 cells, n = 3956 trajectories), and HaloTag-Cbx7△CD (N = 21 cells, n = 3471 trajectories) in wild-type mES cells. The histograms were fitted with a two-component exponential decay model. (C) Residence time (τsb) of the stable chromatin-bound population for HaloTag-Cbx7, HaloTag-CDCbx7, HaloTag-Cbx7F11A, and HaloTag-Cbx7△CD in wild-type mES cells. (D) Fraction (F1sb) of the stable chromatin-bound population for HaloTag-Cbx7, HaloTag-CDCbx7, HaloTag-Cbx7F11A, and HaloTag-Cbx7△CD in wild-type mES cells. (E) Survival probability for HaloTag-Cbx7, HaloTag-CDCbx7, HaloTag-Cbx7F11A, and HaloTag-Cbx7△CD in wild-type mES cells.
DOI: http://dx.doi.org/10.7554/eLife.17667.038

Figure 4—figure supplement 1. Control experiments for determine photobleaching constant of JF549.
Disruption of the complex formation of Cbx7-PRC1 facilitates the targeting of Cbx7 to chromatin
To search for factor(s) that contribute(s) to the targeting of Cbx7 to chromatin, we investigated whether individual components of Cbx7-PRC1 affect the targeting of Cbx7 to chromatin. We integrated HaloTag-Cbx7 into the genome of Ring1a−/−/Ring1b−/− mES cells. Ring1a and Ring1b are the assemblage of PRC1 complexes and the depletion of Ring1b disrupts the complex formation of PRC1 (Leeb and Wutz, 2007). The histograms indicated three components (Figure 5A, Video 30, and Figure 5—source data 1). We measured F1 = (44 ± 1)%, F2 = (32 ± 2)%, and F3 = (24 ± 2)% (Figure 5B and Supplementary file 1), indicating that the fractional size of the CB component is ∼1.5 fold of that obtained from wild-type mES cells. Ring1a and Ring1b are not only core components of Cbx-PRC1, but also core components of vPRC1 (Gao et al., 2012; Tavares et al., 2012). To disrupt the complex formation of Cbx-PRC1, we established Bmi1−/−/Mel18−/− mES cells stably expressing HaloTag-Cbx7. Bmi1 and Mel18 are assembled into the Cbx-PRC1 complexes (Gao et al., 2012). We performed SMT of HaloTag-Cbx7 in Bmi1−/−/Mel18−/− mES cells (Video 31). The histograms indicated three populations (Figure 5A and Figure 5—source data–1). We measured F1 = (40 ± 1)%, F2 = (44 ± 1)%, and F3 = (16 ± 5)% (Figure 5B and Supplementary file 1), indicating that the fractional size of the CB component is ∼1.4 fold of that obtained from wild-type mES cells. Thus, these data suggest that the disruption of the complex formation of Cbx7-PRC1 facilitates the targeting of Cbx7 to chromatin.
Video 30. HaloTag-Cbx7 in Ring1a/Ring1b dKO mES cells (Fractional studies).
Video 31. HaloTag-Cbx7 in Bmi1/Mel18 dKO mES cells (Fractional studies).
Figure 5. Disruption of the complex formation of Cbx7-PRC1 facilitates the targeting of Cbx7 to chromatin.
(A) Normalized histograms of the log maximum likelihood diffusion coefficient for HaloTag-Cbx7 in wild-type mES cells replicated from Figure 1E and for HaloTag-Cbx7 in Ring1a−/−/Ring1b−/− (N = 29 cells, n = 2600 trajectories) and Bmi1−/−/Mel18−/− (N = 27 cells, n = 6859 trajectories) mES cells. The histograms were fitted with a three-component Gaussian. (B) Fraction of the CB (red), ID (cyan), and FD (green) population for HaloTag-Cbx7 in wild-type mES cells replicated from Figure 1F and for HaloTag-Cbx7 in Ring1a−/−/Ring1b−/− and Bmi1−/−/Mel18−/− mES cells. Results are means ± SD. (C–D) Residence time (C) and fraction (D) of the stable chromatin-bound population for HaloTag-Cbx7 in wild-type mES cells replicated from Figure 4C and D and for HaloTag-Cbx7 in Ring1a−/−/Ring1b−/− (N = 18 cells, n = 4849 trajectories) and Bmi1−/−/Mel18−/− (N = 27 cells, n = 3484 trajectories) mES cells. (E) Survival probability for HaloTag-Cbx7 in wild-type mES cells replicated from Figure 4E, and for HaloTag-Cbx7 in Ring1a−/−/Ring1b−/− and Bmi1−/−/Mel18−/− mES cells.
DOI: http://dx.doi.org/10.7554/eLife.17667.045

Figure 5—figure supplement 1. Cumulative frequency distribution of the dwell times for determining the residence times of HaloTag-Cbx7 in Ring1a−/−/Ring1b−/− and Bmi1−/−/Mel18−/− mES cells.
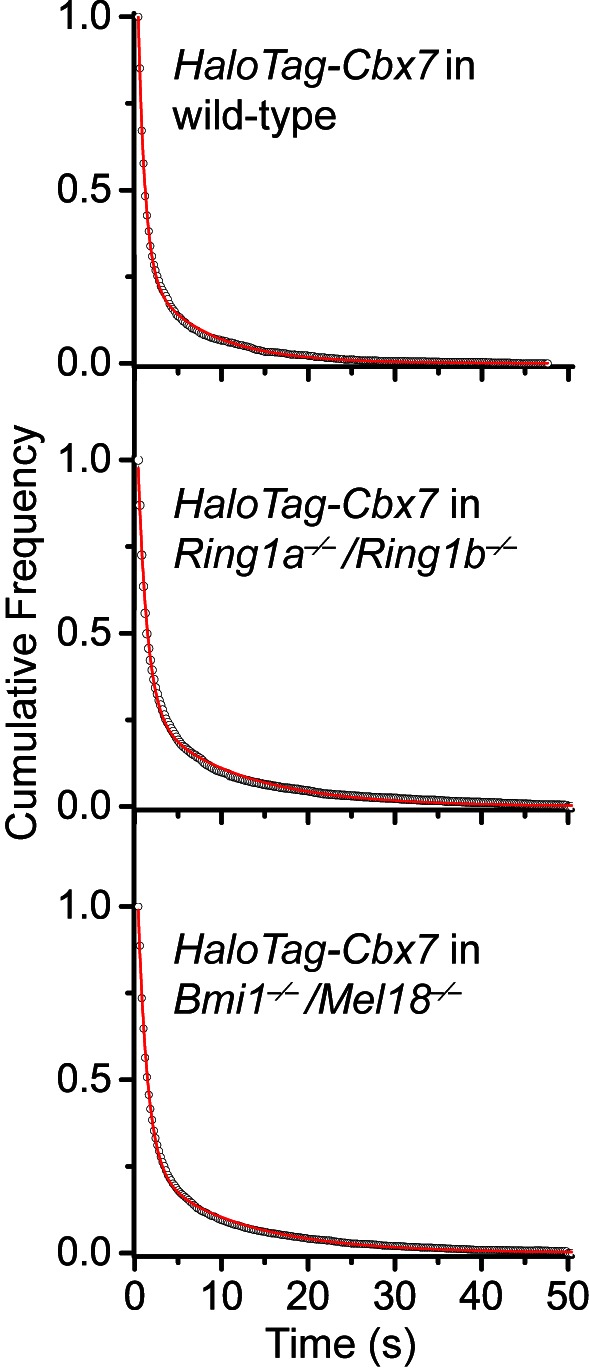
To investigate whether the increased level of Cbx7 at chromatin upon the depletion of PRC1 components is caused by the dissociation rate, we measured the residence times of HaloTag-Cbx7 in Ring1a−/−/Ring1b−/− and Bmi1−/−/Mel18−/− mES cells, respectively (Video 32 and 33). The cumulative frequency distributions of dwell times were fitted with a two-component exponential decay model (Figure 5—figure supplement 1, and Figure 5—source data 1)). We measured τtb = 1.06 ± 0.02 s and τsb = 10.6 ± 0.2 s for HaloTag-Cbx7 in Ring1a−/−/Ring1b−/− mES cells and τtb = 1.08 ± 0.02 s and τsb = 10.9 ± 0.1 s for HaloTag-Cbx7 in Bmi1−/−/Mel18−/− mES cells (Figure 5C and Supplementary file 2), indicating that HaloTag-Cbx7 stays a longer time at chromatin in Ring1a−/−/Ring1b−/−and Bmi1−/−/Mel18−/− mES cells than in wild-type mES cells. The F1tb and F1sb levels for HaloTag-Cbx7 in Ring1a−/−/Ring1b−/−and Bmi1−/−/Mel18−/− mES cells were higher than that in wild-type mES cells (Figure 5D and Supplementary file 2). A survival probability plot showed that HaloTag-Cbx7 stays a shorter time at chromatin in wild-type mES cells than in Ring1a−/−/Ring1b−/− and Bmi1−/−/Mel18−/−mES cells (Figure 5E and Figure 5—source data 1). Thus, our data demonstrate that genetic depletion of PRC1 components facilitates the stabilizing of Cbx7 at chromatin.
Video 32. HaloTag-Cbx7 in Ring1a/Ring1b dKO mES cells (Residence time studies).
Video 33. HaloTag-Cbx7 in Bmi1/Mel18 dKO mES cells (Residence time studies).
CDCbx7 and ATLCbx7 together constitute a DNA-binding unit
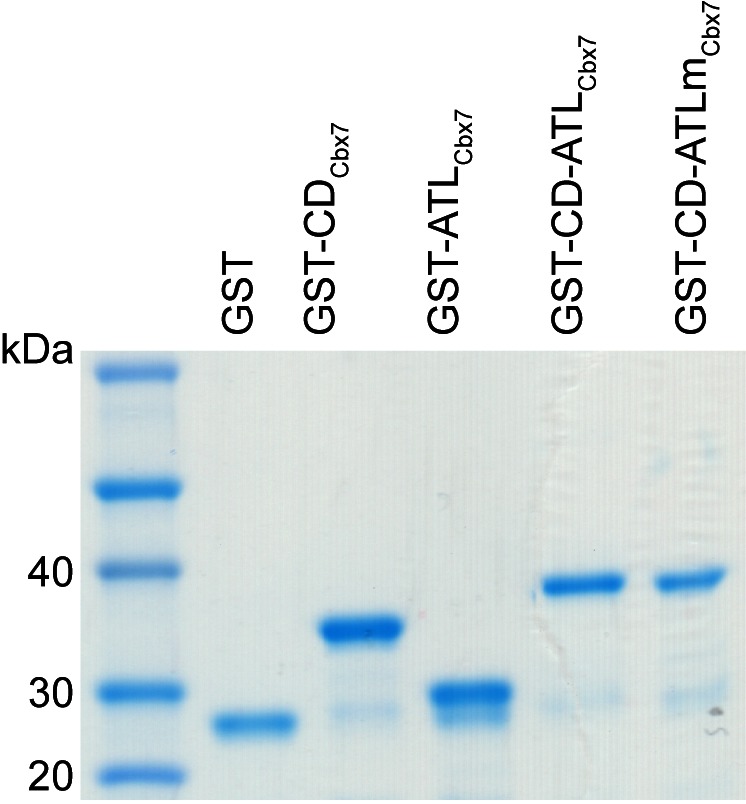
Since the Cbx-PRC1 components tested are not required for the targeting of Cbx7 to chromatin, we turned our attention into Cbx7 itself. In addition to the conserved CD, Cbx7 harbors an ATL motif adjacent to CD (Senthilkumar and Mishra, 2009) (Figure 6A). Since the Cbx7 ATL (ATLCbx7) contains 6 basic amino acids out of 16, we postulated that the ATL motif may be involved in nucleic acid-binding. To test this hypothesis, we generated Cbx7 variants (Figure 6—figure supplement 1) and performed electrophoretic mobility shift assay (EMSA) (Figure 6B). EMSA analysis indicated that CDCbx7 has no DNA-binding activity, consistent with early studies (Bernstein et al., 2006). Although ATLCbx7 contains a high content of basic amino acids, EMSA analysis demonstrated that ATLCbx7 has undetectable DNA-binding activity, consistent with previous report that ATL does not bind to DNA (Reeves and Nissen, 1990). However, under the same conditions, CD-ATLCbx7 showed clear DNA-binding activity, suggesting that the DNA-binding activity requires both CDCbx7 and ATLCbx7. To test whether the basic amino acids of ATLCbx7 affect the DNA-binding activity, we substituted these basic amino acids with alanine or glycine to generate CD-ATLmCbx7. EMSA analysis showed that the substitution abolishes the DNA-binding activity of CD-ATLCbx7. As a control, GST did not bind to DNA. The DNA-binding capacity of CD-ATLCbx7 is concentration-dependent (Figure 6C). The Kd was determined to be ∼1.0 µM, which is much smaller than the CDCbx7 binding to H3K27me3 peptide (Bernstein et al., 2006; Kaustov et al., 2011; Tardat et al., 2015).
Figure 6. CDCbx7 and ATLCbx7 together constitute a DNA-binding entity.
(A) Schematic representation of Cbx7. The sequence of amino acids of ATL motif is shown. The basic amino acids are underlined and mutated to alanine to generate ATLm. (B) EMSA for the determination of Cbx7 variants binding to dsDNA-1. dsDNA-1 was labelled with Alexa Fluor 488 dye. Left: short-time exposure. Right: long-time exposure. B: bound DNA-protein complex. F: free DNA. (C) EMSA for the determination of the dissociation constant (Kd) of the CD-ATLCbx7 cassette binding to dsDNA-1. Bottom: binding curve for the CD-ATLCbx7 cassette. (D–G) EMSA for the determination of the relative affinities for the CD-ATLCbx7 cassette binding to dsDNA-2, ssDNA, dsRNA, and ssRNA. dsDNA-1 within dsDNA-1/CD-ATLCbx7 complexes was competed with competitors, dsDNA-2 (D), ssDNA (E), dsRNA (F), and ssRNA (G), respectively. ds: double-strand. ss: single-strand.

Figure 6—figure supplement 1. Control experiments for analyzing the Cbx7 variants purified from BL21 cells by SDS-PAGE.
Previous studies have shown that CDCbx7 binds to RNA with affinity of ∼50 µM (Bernstein et al., 2006; Yap et al., 2010). To compare the relative affinity of CD-ATLCbx7 binding to DNA versus RNA, we performed competitive assays. 0.5 µM of double-stranded DNA-2 (dsDNA-2), with sequence being different from dsDNA-1, completely dissociated the fluorescently labeled dsDNA-1 (0.1 µM) from CD-ATLCbx7 (Figure 6D). At 4.0 µM, single-stranded DNA (ssDNA) could not completely dissociate dsDNA-1 from CD-ATLCbx7 (Figure 6E). Under the identical conditions, 10 µM of double-stranded RNA could not completely dissociate dsDNA-1 from CD-ATLCbx7 (Figure 6F). Likewise, 40 µM of single-stranded RNA had no noticeable effects on the association CD-ATLCbx7 with dsDNA-1 (Figure 6G). Altogether, our results demonstrate that CD-ATLCbx7 preferentially recognizes dsDNA rather than ssDNA, dsRNA and ssRNA.
CDCbx7 and ATLCbx7 together control the targeting of Cbx7 to chromatin
To investigate whether the in vitro capacity of the binding of CD-ATLCbx7 to DNA has a functional role in the targeting of Cbx7 to chromatin in vivo, we made Cbx7 variants lacking DNA-binding ability and stably expressed these variants in wild-type mES cells (Figure 7A and Figure 3—figure supplement 1). The histograms for HaloTag-Cbx7△ATL were fitted with three populations (Figure 7B, Video 34, and Figure 7—source data 1). We measured F1 = (16 ± 1)%, F2 = (44 ± 2)%, and F3 = (40 ± 3)% (Figure 7C and Supplementary file 1), indicating that the fractional size of the CB component of HaloTag-Cbx7△ATL is about half of that of HaloTag-Cbx7. The histograms for HaloTag-Cbx7ATLm indicated three components (Figure 7B, Video 35, and Figure 7—source data 1). We measured F1 = (16 ± 1)%, F2 = (60 ± 1)%, and F3 = (24 ± 3)% (Figure 7C and Supplementary file 1), indicating that the fractional size of the CB component of HaloTag-Cbx7ATLm is comparable to that of HaloTag-Cbx7△ATL. Thus, our data indicate that the ATLCbx7 motif is required for the efficient targeting of Cbx7 to chromatin.
Video 34. HaloTag-Cbx7△ATL in wild-type mES cells (Fractional studies).
Video 35. HaloTag-Cbx7ATLm in wild-type mES cells (Fractional studies).
Figure 7. CDCbx7 and ATLCbx7 together control the targeting of Cbx7 to chromatin.
(A) Schematic representation of Cbx7 variants. The underlined ATL amino acids were mutated into alanine or glycine. (B) Normalized histograms of the log maximum likelihood diffusion coefficient for HaloTag-Cbx7 replicated from Figure 1E and for HaloTag-Cbx7△ATL (N = 12 cells, n = 3065 trajectories), HaloTag-Cbx7ATLm (N = 13 cells, n = 2257 trajectories), and HaloTag-Cbx7△CD-ATL (N = 35 cells, n = 8329 trajectories) in wild-type mES cells. The histograms were fitted with a three-component Gaussian. (C) Fraction of the CB, ID, and FD population for HaloTag-Cbx7 replicated from Figure 1F, HaloTag-Cbx7△ATL, HaloTag-Cbx7ATLm, and HaloTag-Cbx7△CD-ATL. The data were obtained from Figure 7B fitted with a Gaussian. Results are means ± SD. (D–E) Residence time (D) and fraction (E) of the stable chromatin-bound population for HaloTag-Cbx7 replicated from Figure 4C and D, HaloTag-Cbx7△ATL (N = 17 cells, n = 2384 trajectories), HaloTag-Cbx7ATLm (N = 24 cells, n = 2957 trajectories), and HaloTag-Cbx7△CD-ATL (N = 22 cells, n = 4908 trajectories). Results are means ± SD. (F) Survival probability for HaloTag-Cbx7 replicated from Figure 4D, HaloTag-Cbx7△ATL, HaloTag-Cbx7ATLm, and HaloTag-Cbx7△CD-ATL.
DOI: http://dx.doi.org/10.7554/eLife.17667.054

Figure 7—figure supplement 1. Cumulative frequency distribution of the dwell times for determining the residence times of HaloTag-Cbx7△ATL, HaloTag-Cbx7ATLm, and HaloTag-Cbx7△CD-ATL in wild-type mES cells.
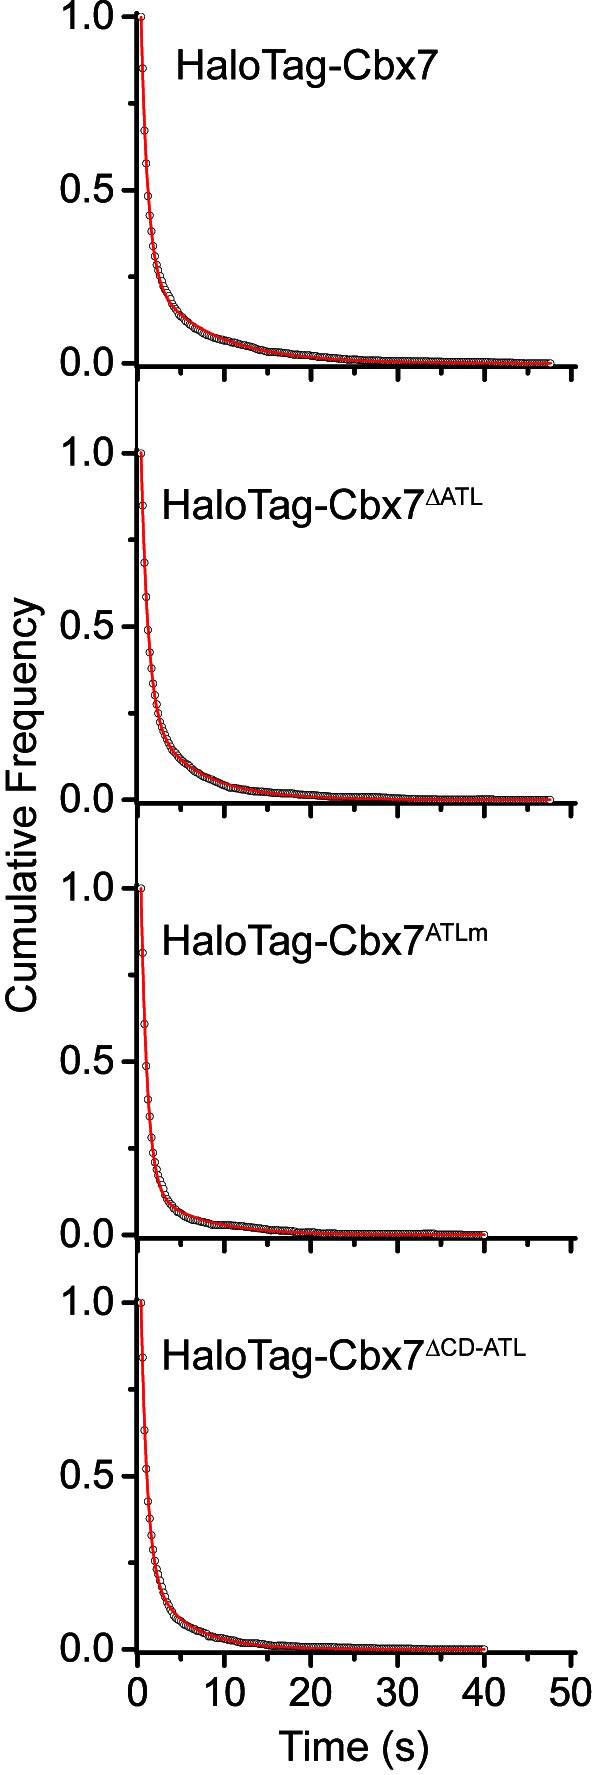
Given that CDCbx7 and ATLCbx7 constitute an H3K27me3- and DNA-binding unit, we tested the role of CD-ATLCbx7 in the targeting of Cbx7 to chromatin. We deleted both CDCbx7 and ATLCbx7 to generate HaloTag-Cbx7△CD-ATL that was stably expressed in wild-type mES cells (Figure 7A and Figure 3—figure supplement 1). The histograms for HaloTag-Cbx7△CD-ATL were fitted with three populations (Figure 7B, Video 36, and Figure 7—source data 1). We measured F1 = (8 ± 3)%, F2 = (46 ± 1)%, and F3 = (46 ± 1)% for HaloTag-Cbx7△CD-ATL (Figure 7C and Supplementary file 1), indicating that the F1 level was lower than that for HaloTag-Cbx7△CD and HaloTag-Cbx7△ATL (Supplementary file 1). Thus, our data suggest that CDCbx7 and ATLCbx7 function together as a unit to mediate the targeting of Cbx7 to chromatin.
Video 36. HaloTag-Cbx7△CD-ATL in wild-type mES cells (Fractional studies).
Next, we investigated the residence times of the Cbx7 variants at chromatin (Figure 7—figure supplement 1, Video 37–39, and Figure 7—source data 1). The residence time of the stable chromatin-bound population was reduced for HaloTag-Cbx7ALTm (τsb = 6.0 ± 0.2 s), HaloTag-Cbx7△ATL (τsb = 5.8 ± 0.1 s), and HaloTag-Cbx7△CD-ATL (τsb = 4.6 ± 0.1 s), in comparison with HaloTag-Cbx7 (τsb = 7.3 ± 0.1 s) (Figure 7D and Supplementary file 2). The F1sb levels for HaloTag-Cbx7ALTm and HaloTag-Cbx7△ATL were less than that for HaloTag-Cbx7 (Figure 7E and Supplementary file 2). The F1sb level for HaloTag-Cbx7△CD-ATL was almost undetectable (Figure 7E and Supplementary file 2). A survival probability plot demonstrated that these HaloTag-Cbx7 variants stay a shorter time period at chromatin than HaloTag-Cbx7 (Figure 7F and Figure 7—source data 1). Thus, our data demonstrate that CD-ATLCbx7 is a functional unit that regulates the targeting of Cbx7 to chromatin.
Video 37. HaloTag-Cbx7△ATL in wild-type mES cells (Residence time studies).
Video 38. HaloTag-Cbx7ATLm in wild-type mES cells (Residence time studies).
Video 39. HaloTag-Cbx7△CD-ATL in wild-type mES cells (Residence time studies).
Discussion
In this study, we have elucidated the recruitment mechanism for the Cbx-PRC1 complexes by integrating approaches from live-cell SMT, genetic engineering, and biochemistry. We have demonstrated that H3K27me3 has a central and a direct role in the recruitment of Cbx7 and Cbx8 to chromatin in vivo, while plays a less important role in the targeting of Cbx2, Cbx4, and Cbx6 to chromatin. We have identified that the CD-ATLCbx7 cassette functions as a unit that co-recognizes H3K27me3 and DNA and regulates the targeting of Cbx7 to chromatin. These results challenge the prevailing view that all Cbx family members require H3K27me3 for the targeting of them to chromatin and provide new insights into the genetic, biochemical, and genome-wide analysis for our understanding of the Cbx-PRC1 targeting mechanisms. We propose that a hierarchical cooperation between a low-affinity H3K27me3-binding CDCbx7 and a high-affinity DNA-binding CD-ATLCbx7 targets Cbx7-PRC1 to chromatin.
Targeting the Cbx family members with and without dependence on PRC2 and H3K27me3
During evolution, the number of genes encoding Cbx proteins has increased, which has resulted in structural and functional diversification (Cheng et al., 2014; Klauke et al., 2013; Morey et al., 2012; Ren and Kerppola, 2011; Ren et al., 2008; Tatavosian et al., 2015; Vincenz and Kerppola, 2008; Whitcomb et al., 2007; Zhen et al., 2014). At the single-molecule level, we quantified the kinetic fractions of the Cbx proteins within living mES cells and revealed that ∼ 30% of Cbx2, Cbx7, and Cbx8 associate with chromatin at a given time period while ∼10–15% of Cbx4 and Cbx6 bind to chromatin. The fractional sizes and diffusion constants of the ID populations among the Cbx family members are distinct, suggesting that the Cbx proteins employ distinct mechanisms to explore the nucleus of the cell.
At the single-molecule sensitivity, we demonstrated that Cbx7 and Cbx8 are displaced from chromatin in Eed−/− and Ezh2−/− mES cells. The introduction of Eed into Eed−/− mES cells and of Ezh2 into Ezh2−/− mES cells restored the Cbx7 and Cbx8 association with chromatin and the H3K27me3 level. Thus, it is likely that H3K27me3 directly controls the association of Cbx7 and Cbx8 with chromatin. Consistent with this notion, previous genome-wide ChIP-Seq analysis demonstrated that Cbx7 is displaced from chromatin in Eed−/− mES cells (Morey et al., 2013). We found that the removal of H3K27me3 has no or small effects on the association of Cbx2, Cbx4, and Cbx6 with chromatin. No effects on the Cbx6 association with chromatin is consistent with previous studies where Cbx6 does not interact with Ring1b and only 5% of Cbx6 target genes are occupied by H3K27me3 in mES cells (Morey et al., 2012). In contrast to Cbx6, Cbx2 and Cbx4 form the Cbx-PRC1 complex and overlap with H3K27me3 Polycomb domains (Gao et al., 2012; Mardaryev et al., 2016). Cbx4 is a SUMO E3 ligase and can function as the H3K27me3-dependent or –independent way (Kagey et al., 2003; Li et al., 2014; Mardaryev et al., 2016; Roscic et al., 2006). Our recent study has shown that Cbx2 is targeted to mitotic chromosomes independently of PRC1 and PRC2, and directly recruits the canonical PRC1 components to mitotic chromosomes (Zhen et al., 2014). Another study has demonstrated that Cbx2 targets the canonical PRC1 to constitutive heterochromatin by directly recognizing pericentromeric chromatin during early mouse development (Tardat et al., 2015). Additionally, in vitro study has shown that Cbx2 can directly bind to and compact reconstituted nucleosomes (Grau et al., 2011). Thus, these studies suggest additional mechanisms exist to target Cbx2, Cbx4, and Cbx6 to chromatin.
Targeting of the Cbx7 protein to chromatin by co-recognition of H3K27me3 and DNA
We observed that the level of CDCbx7 at chromatin is less than 30% of Cbx7 and that the residence time of the stable chromatin-bound population of CDCbx7 is about 65% of Cbx7. Mutational analysis demonstrated that Cbx7F11A and Cbx7△CD both remain associating with chromatin. These data imply that additional factor(s) exist(s) to target the Cbx7 protein to chromatin. Cbx7 contains two conserved domains: CD and ATL (Senthilkumar and Mishra, 2009). Consistent with previous reports, our data showed that CDCbx7 and ATLCbx7 do not bind to DNA, respectively (Bernstein et al., 2006; Reeves and Nissen, 1990). Interestingly, our results demonstrated that CDCbx7 and ATLCbx7 together function as a DNA-binding unit. CD-ATLCbx7 exhibited much higher affinity for dsDNA than for ssDNA, dsRNA, and ssRNA. The DNA-binding capacity of CD-ATLCbx7 was functionally significant. Perturbation of the DNA-binding capacity of CD-ATLCbx7 impaired the level of Cbx7 at chromatin and reduced the Cbx7 residence time. Deletion of both CDCbx7 and ATL Cbx7 results in the significantly reduced level of the stable chromatin-bound population. Thus, our data demonstrate that the co-recognition of H3K27me3 and DNA by the CD-ATLCbx7 module contributes significantly to the targeting of Cbx7 to chromatin.
Since histone-modifying enzymes typically reside in protein complexes, components within the protein complexes often contribute to targeting of them to chromatin by multivalent engagement of chromatin (Lalonde et al., 2014; Rando, 2012; Ruthenburg et al., 2007). Given that previous studies have shown that Mel18 binds DNA directly in vitro (Akasaka et al., 1996) and the Ring1b-Mel18 ubiquitin module recognizes reconstituted nucleosome (McGinty et al., 2014), we test whether subunits of the Cbx7-PRC1 complex contribute to the binding of Cbx7 to chromatin. Interestingly, our single-molecule approaches demonstrated that depletion of Ring1a/Ring1b and Bmi1/Mel18 results in the increased chromatin-bound levels and the increased residence times of Cbx7. Further studies are needed to understand whether the Cbx-PRC1 complex formation is required for the targeting specificity of Cbx7.
Hierarchical cooperation between DNA and H3K27me3
Hierarchical cooperation within chromatin regulatory proteins or complexes between unmodified DNA and histone markers is emerging as a mechanism for gene control. For example, SWR1 is recruited to promoter regions containing nucleosome free region > 50 bp and an adjoining nucleosome by the nanomolar DNA-binding affinity of Swc2, a subunit of SWR1. Once bound, the micromolar affinity of Bdf1 bromodomains for acetylated histones directs SWR1 binding to the +1 nucleosome over the -1 nucleosome (Ranjan et al., 2013). Thus, hierarchical cooperation between DNA and histone modifications could underpin the SWR1’s role in promoting H2A.Z replacement. Another example is that the Rpd3S histone deacetylase complex binds to H3K36-methylated dinucleosome with 100 pM affinity by multiple engagements of histone modifications and DNA (Huh et al., 2012; Li et al., 2007b). The DNA- and histone-binding abilities of Eaf3, a subunit of Rpd3S, are self-contained and allosterically regulated by Rco1, another subunit of Rpd3S (Ruan et al., 2015).
Our results suggest that the mechanism of targeting of Cbx7 to chromatin is dependent on hierarchical cooperation via co-recognition of DNA and H3K27me3 by the CD-ATLCbx7 entity (Figure 8). We propose that Cbx7-PRC1 is recruited to chromatin by the CDCbx7 recognition of H3K27me3. We hypothesize that the interaction between H3K27me3 and CDCbx7 triggers conformational changes of the Cbx7-PRC1 complex, which drive the high-affinity interaction between DNA and CD-ATLCbx7. This hypothesis is consistent with our observation that the removal of H3K27me3 significantly reduces the targeting of Cbx7 and Cbx8 to chromatin. Implicit in this model is that the binding of CD-ATLCbx7 to DNA is auto-inhibited by unknown mechanisms and allosterically regulated by the CDCbx7 interaction with H3K27me3. Previous studies have shown that H3K27me3 allosterically activates the methyltransferase activity of the PRC2 complex by its interaction with the C-terminus of Eed (Jiao and Liu, 2015; Margueron et al., 2009). The allosteric activation facilitates the progression of the H3K27me3 mark on chromatin. Thus, our results unite previous biochemical studies and genetic analysis and provide a novel example of control gene expression via integration of genetic DNA and histone modifications. The novel and testable hypothesis should inspire future research of PRC1 function and regulation. The experimental strategy of a combination of genetic engineering, biochemistry, and live-cell SMT should prove widely useful for mechanistic analysis of other chromatin regulatory complexes in living cells.
Figure 8. Proposed models for the targeting of Cbx-PRC1 to chromatin.
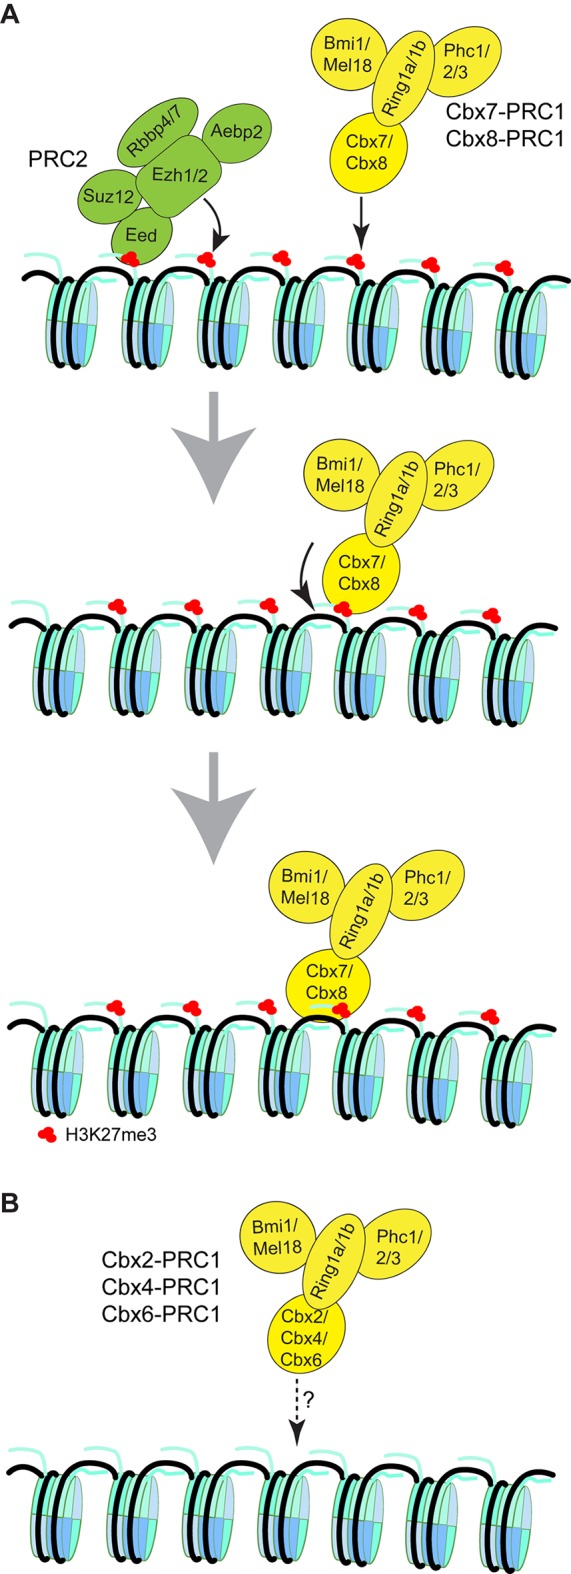
(A) The Cbx7-PRC1 and Cbx8-PRC1 complexes are targeted to chromatin by co-recognition of H3K27me3 and DNA. The Cbx7- and Cbx8-PRC1 complexes are guided to genomic loci by the CD interaction with H3K27me3. The interaction triggers conformational changes of the Cbx7- and Cbx8-PRC1 complexes and induces the CD-ATL cassette interaction with DNA. Multivalent engagement of DNA and H3K27me3 by the CD-ATL cassette stabilizes the Cbx7- and Cbx8-PRC1 complexes at chromatin. (B) Molecular mechanisms for the targeting of Cbx2-PRC1, Cbx4-PRC1, and Cbx6-PRC1 complexes to chromatin remain unknown.
Materials and methods
Cell culture
The Eed−/− (Endoh et al., 2008), Ring1a−/−/Ring1bfl/fl; Rosa26::CreERT2 (Endoh et al., 2008), Bmi1–/–/Mel18–/– (Bmi1 and Mel18 double knockout) (Elderkin et al., 2007) mES cells were obtained from Dr. Haruhiko Koseki (RIKEN Center for Integrative Medical Sciences, Japan). The Ezh2−/− mES cells (Shen et al., 2009) were obtained from Dr. Stuart Orkin (Harvard Medical School, Boston, MA). The Cbx7−/− mES cells (Cheng et al., 2014) and HEK293T cells were obtained from Dr. Tom Kerppola (University of Michigan Medical School, Ann Arbor, Michigan). The PGK12.1 (Penny et al., 1996) mES cells were obtained from Dr. Neil Brockdorff (University of Oxford, UK). The KO mES cell lines have been authenticated by immunoblotting and IF for identity. Other cell lines used in this study have not been authenticated for identity. All cell lines were tested negative for mycoplasma contamination by using DAPI DNA staining. These mES cells were maintained in mES medium (DMEM (D5796; Sigma-Aldrich, St Louis, MO) supplemented with 15% FBS (F0926; Sigma-Aldrich, St Louis, MO), 2 mM glutamine (25030–081; Life Technologies, Carlsbad, CA), 100 units/ml penicillin-streptomycin (15140–122; Life Technologies, Carlsbad, CA), 0.1 mM β-mercaptoethanol (21985–023; Life Technologies, Carlsbad, CA), 103 units/ml leukemia inhibitor factor (LIF) and 0.1 mM non-essential amino acids (1114050; Life Technologies, Carlsbad, CA)) at 37°C in 5% CO2. 4-hydroxytamoxifen (OHT; H7904; Sigma-Aldrich Inc, St Louis, MO) was administrated to deplete the Ring1b alleles of the Ring1a−/−/Ring1bfl/fl; Rosa26::CreERT2 mES cells (Tatavosian et al., 2015; Zhen et al., 2014). HEK293T cells were maintained as described previously (Tatavosian et al., 2015; Zhen et al., 2014).
Plasmids
The plasmids pTRIPZ (M)-YFP-Ezh2 and pTRIPZ (M)-YFP-Eed have been described previously (Tatavosian et al., 2015). The YFP sequence in the plasmids pTRIPZ (M)-YFP-Cbx2 (Zhen et al., 2014), pTRIPZ (M)-YFP-Cbx4 (Zhen et al., 2014), pTRIPZ (M)-YFP-Cbx6 (Zhen et al., 2014), pTRIPZ (M)-YFP-Cbx7 (Zhen et al., 2014), pTRIPZ (M)-YFP-Cbx8 (Zhen et al., 2014), and pTRIPZ (M)-YFP-H2A (Zhen et al., 2014) was replaced with the HaloTag sequence amplified from the plasmid ENTR4-HaloTag (w876-1) (Addgene), generating pTRIPZ (M)-HT-Cbx2, pTRIPZ (M)-HT-Cbx4, pTRIPZ (M)-HT-Cbx6, pTRIPZ (M)-HT-Cbx7, pTRIPZ (M)-HT-Cbx8, and pTRIPZ (M)-H2A-HT. The sequence encoding NLS (nucleus localization sequence) was chemically synthesized and inserted downstream of the HaloTag sequence, generating the pTRIPZ (M)-HT-NLS plasmid. To generate Cbx7 variants fused with HaloTag, the Cbx7 sequence in the plasmid pTRIPZ (M)-HT-Cbx7 was replaced with the Cbx7 variant sequences. The Cbx7 variants were as follows: (1) CDCbx7, amino acids 8–62; (2) Cbx7F11A, point mutation of F11 to A11; (3) Cbx7△CD, deletion of amino acids 1–62; (4) Cbx7ATLm, mutation of RKR70-72, K75, and KR77-78 to AGA70-72, A75, and AG77-78); (5) Cbx7△ATL, deletion of amino acids 66–83; and (6) Cbx7△CD-ATL, deletion of amino acids 1–83. To generate plasmids for expressing Cbx7 variants in E.coli, the sequence encoding the Cbx7 variants was amplified by PCR and inserted downstream of the GST sequence within the pGEX-6P-1-GST vector (GE Healthcare, Pittsburg, PA), generating pGEX-6P-1-GST-CDCbx7 (CDCbx7; amino acids 1–62), pGEX-6P-1-GST-ATLCbx7 (ATLCbx7; amino acids 66–81), pGEX-6P-1-GST-CD-ATLCbx7 (CD-ATLCbx7; amino acids 1–84), and pGEX-6P-1-GST-CD-ATLmCbx7 (CD-ATLmCbx7; amino acids 1–84 with mutation of RKR70-72, K75, and KR77-78 to AGA70-72, A75, and AG77-78). The sequences encoding the fusion genes have been verified by DNA sequencing and the plasmids will be deposited to Addgene (https://www.addgene.org/).
Generation of transgenic mES cell lines by lentivirus transduction
Establishing the mES cell lines stably expressing the Polycomb and H2A genes was performed as described previously (Tatavosian et al., 2015; Zhen et al., 2014). HEK293T cells at 85–90% confluency were co-transfected with 21 μg pTRIPZ (M) containing the fusion gene, 21 μg psPAX2, and 10.5 μg pMD2.G by using calcium phosphate precipitation. At the time of 12 hr after transfection, the medium was replaced with 10 ml DMEM supplemented with 10% FBS, 2 mM L-glutamine, 100 units/ml penicillin G sodium, and 0.1 mM β-mercaptoethanol. At the time of 48–50 hr after medium change, the medium was harvested to transduce mES cells in the presence of 8 µg/ml polybrene (H9268; Sigma-Aldrich, St Louis, MO) and LIF. For co-transducing multiple genes, lentiviruses were produced separately and mixed at the time of transduction. At the time of 72 hr after transduction, infected cells were selected by using 1.0–2.0 μg/ml of puromycin (P8833; Sigma-Aldrich, St Louis, MO). Unless otherwise indicated, for live-cell single-molecule imaging experiments, the fusions were expressed at the basal level without administrating doxycycline.
Producing GST-fusion proteins from E. coli
Producing GST-Cbx7 fusion proteins is described in more detail at Bio-protocol (Huynh and Ren, 2017). The pGEX-6P-1-GST plasmids encoding the Cbx7 variants were transformed into BL21 competent cells. The gene expression was induced by isopropyl-beta-D-thiogalactopyranoside (AC121; Omega Bio-Tek, Norcross, GA) for 5 hr at 37°C. After centrifugation, the cells were resuspended in cold PBS buffer containing 0.1 mM phenylmethanesulfonyl fluoride (PMSF; 93482; Sigma-Aldrich, St Louis, MO) and protease inhibitor cocktail (P8340; Sigma-Aldrich, St Louis, MO), and then lysed by sonication using Vibra-CellTM sonicator (VCX130; Newtown, CT). To the mixture, 1% Triton X-100 was added. After centrifugation, the supernatant was mixed with pre-washed Glutathione Sepharose beads (17-0756-01; GE Healthcare, Pittsburgh, PA). After 4 times washing with PBS containing 1% Triton X-100, the GST-Cbx7 variant fusion proteins were eluted by 20 mM reduced glutathione (G4251; Sigma-Aldrich, St Louis, MO). After dialysis against PBS, the purity and identity of the GST-Cbx7 variant fusions were assayed by SDS-PAGE.
EMSA
Alexa Fluor 488-labelled dsDNA-1, dsDNA-2, and ssDNA were purchased from IDT. dsRNA and ssRNA were kindly provided by Dr. Marino Resendiz (University of Colorado Denver). The GST-Cbx7 fusion proteins were mixed with Alexa Fluor 488-labelled dsDNA-1 in binding buffer (20 mM HEPES pH 7.9, 100 mM KCl, 1 mM EDTA pH 8, 5 µM DTT, 0.05 mg/ml bovine serum albumin, and 0.1% NP-40). For competitive assay, DNA and RNA were added to the reaction mixture. After incubation at room temperature for 15 min, 20% glycerol was added to the reaction. The mixtures were then loaded to the wells of Novex 10% Tris-Glycine Mini Protein Gels (EC6075BOX; Life Technologies, Carlsbad, CA). The gels were run for 90 min at 100 V and 400 mA at 4°C in the dark. The gels were imaged using ChemiDoc XRS system (Bio-Rad). The intensities of bands were quantified using ImageJ (http://imagej.nih.gov/ij/).
IF
IF was performed as described previously (Tatavosian et al., 2015; Zhen et al., 2014). Wild-type (PGK12.1), Eed−/−, Ezh2−/−, Y-Eed/Eed−/−, and Y-Ezh2/Ezh2−/− mES cells were cultured on coverslips and fixed using 2.0% paraformaldehyde. After permeabilizing with 0.2% Triton X-100, the cells were washed with basic blocking buffer (10 mM PBS pH 7.2, 0.1% Triton X-100, and 0.05% Tween 20) and then blocked with blocking buffer (the basic blocking buffer plus 3% goat serum and 3% bovine serum albumin). Anti-H3K27me3 antibody (07–449; Millipore, Billerica, MA) was incubated with the cells for 2 hr at room temperature. After washing with the basic blocking buffer, Alexa Fluor 488-labelled goat anti–rabbit antibody (A-11008; Life Technologies, Carlsbad, CA) was incubated with the cells for 1 hr. After incubating with 0.1 μg/ml hoechst, the cells were washed and then mounted on slides with ProLong Antifade reagents (P7481; Life Technologies, Carlsbad, CA). The images were taken and processed as described previously (Tatavosian et al., 2015; Zhen et al., 2014).
Immunoblotting
Immunoblotting was performed as described previously (Tatavosian et al., 2015; Zhen et al., 2014). Nuclei were lysed in buffer containing 20 mM Tris-HCl pH 7.4, 2.0% NP-40, 500 mM NaCl, 0.25 mM EDTA, 0.1 mM Na3VO4, 0.1 mM PMSF, and protease inhibitors. Proteins were resolved using NuPAGE 4–12% Bis-Tris Gel (NPO322BOX; Life Technologies, Carlsbad, CA) and transferred to 0.45 μm Immobilon-FL PVDF membrane (IPFL00010; EMD Millipore Corporation, Massachusetts, MA). Membranes were probed with anti-Cbx7 (ab21873; Abcam, MA) and anti-HaloTag (G9281; Promega, Sunnyvale, CA). After incubating with HRP-conjugated anti-rabbit antibody (NA934V; GE Healthcare, Pittsburgh, PA), proteins were detected using ECL Plus detection reagents (RPN2106; GE Healthcare, Pittsburgh, PA). Membranes were imaged using a ChemiDoc XRS system (BioRad).
ChIP
ChIP was performed as described previously (Tatavosian et al., 2015). HaloTag-Cbx7/Cbx7−/− and wild-type mES cells were crosslinked with 1.2% formaldehyde (28908; Thermo Fischer Scientific, Waltham, MA) and quenched with 125 mM glycine (G8898; Sigma-Aldrich, St Louis, MO). Nuclei were prepared and washed with LBI buffer (50 mM HEPES pH 7.9, 140 mM NaCl, 1.0 mM EDTA pH 8.0, 10% glycerol, 0.5% NP-40, and 0.25% Triton X-100), LBII buffer (10 mM Tris-HCl pH 8.0, 200 mM NaCl, and 1.5 mM EDTA pH 8.0), and LBIII buffer (10 mM Tris-HCl pH 8.0, 100 mM NaCl, 1.5 mM EDTA pH 8.0, 0.1% sodium deoxycholate, and 0.5% N-lauroylsarcosine). Chromatin was fragmented to 200–1000 bp by sonication (Sonic Vibra Cell model (VCX130)). To the sonicated mixture, 1% Triton X-100 was added. After centrifugation, chromatin was precipitated with anti-HaloTag antibody (G9281; Promega, Sunnyvale, CA). Beads were washed with the RIPA buffer (50 mM HEPES pH 7.9, 500 mM LiCl, 1.0 mM EDTA pH 8.0, 1% NP-40, and 0.7% sodium deoxycholate). The immunoprecipitated DNA were quantified using LightCycler 480 SYBR Green I Master (04707516001; Roche, Indianapolis, IN) with AB Applied Biosystem. Three qPCR replicates were performed. The sequences of the primers used for qPCR have been described previously (Cheng et al., 2014; Ren and Kerppola, 2011; Tatavosian et al., 2015).
Labelling HaloTag fusion proteins with HaloTag ligand in living cells
Labelling HaloTag Fusion Proteins is described in more detail at Bio-protocol (Duc and Ren, 2017). 24 hr prior to imaging, mES cells stably expressing HaloTag fusion proteins were seeded to gelatin-coated cover glass dish. Several concentrations (5 nM, 15 nM, and 30 nM) of Janelia Fluor 549 (JF549) HaloTag ligand were used to treat cells for 15 min at 37°C in 5% CO2. Cells were washed with the mES cell medium once and then incubated in the mES cell medium at 37°C in 5% CO2 for 30 min. After replacing with the live-cell imaging medium (A1896701, FluoroBrite DMEM, Life Technologies, Carlsbad, CA), cells were maintained at 37°C using a heater controller (TC-324; Warner Instrument, Hamden, CT) during imaging. Each dish was used for a maximum of 1.5 hr after placing them on the microscope. The number of individual fluorescent spots was typically ∼10–50 spots per nucleus by controlling the HaloTag ligand concentration.
Single-molecule optical setup and image acquisition
Live-cell single molecule tracking was conducted by using a Zeiss Axio Observer D1 Manual Microscopy (Zeiss, Germany) equipped with an Alpha Plan-Apochromatic 100×/1.46 NA Oil-immersion Objective (Zeiss, Germany) and an Evolve 512 × 512 EMCCD camera (Photometrics, Tucson, AZ). Additional magnification of 2.5× was placed on the emission pathway and thus the overall magnification was 250×. The pixel size of the EMCCD was 16 µm. A laser beam from solid state laser (Intelligent Imaging Innovations, CO) was focused on a rotating mirror, which allows to choose wild-field or inclined excitation configuration. The inclined excitation was used to avoid stray-light reflection and reduce background from cell auto-fluorescence (Tokunaga et al., 2008). JF549 was excited at 552 nm. A Brightline single-band laser filter set (Semrock; excitation filter: FF01-561/14, emission filter: FF01-609/54, and dichroic mirror: Di02-R561-25) was used to filter the excitation and emission wavelength. The microscope and the EMCCD camera were controlled by Slidebook 6.0 software. A laser power intensity of ~15 mW was used to study diffusion components and a power intensity of ~5 mW for residence times (dissociation constants).
Single-molecule localization and tracking
U-track algorithm was used for tracking and linking single particles (Jaqaman et al., 2008). Before analysis, stacks of images were visually checked and stacks with movement and drift were discarded. About two-thirds of stacks were discarded. The particle localization (x, y) was obtained through 2D Gaussian fitting based on a u-track algorithm using Matlab. A 10-pixel search radius upper limit was allowed for frame-to-frame linking. The detailed localization and tracking parameters were listed in the Supplementary file 3. A Matlab script was developed to process the output of 2D tracking from the u-track and to convert the trajectories into a matrix form.
Extraction of diffusion components
Our SMT was the 2-dimensional projection of the 3-dimensional motion of HaloTag labelled molecules. We assumed that the HaloTag-labelled molecules diffuse isotopically along the three-dimensional axes X, Y, and Z. Thus, the XY projection data reflect the 3-dimensional motion of the molecules. We performed 30-ms integration time without interval. To count labelled molecules from short tracks and to avoid bias toward slowly moving particles that remain visible for longer times, we calculated two kinds of diffusion coefficients: the maximum likelihood diffusion coefficient per track and the diffusion coefficient of the first step per track.
where and are the mean squared step size and the squared first-step size, respectively, and equals 30 ms. The underlying assumption for this analysis was that particles undergo the lateral Brownian motion. An R script was developed to calculate and diffusion coefficients from SMT data (https://gist.github.com/dododas/fb34dc8d9ee5f7d30ebc). The resulting distributions of the logarithm of diffusion coefficients were pooled from data generated from three independent imaging dishes. We assumed that the chromatin-bound HaloTag-Cbx7 molecules are stationary at chromatin. Thus, the diffusion constant of the chromatin-bound population of the HaloTag-Cbx proteins approximately equals that of the nucleosomal H2A-HaloTag. To estimate the diffusion coefficient of the chromatin-bound component of the HaloTag-Cbx proteins, the distributions of from the control H2A-HaloTag in wild-type mES cells were fitted with a three-component Gaussian function by OriginLab (OriginLab Corporation).
where is offset, is the center of the peak, is the area of the peak, and is the full width at half maximum. The diffusion coefficient of the nucleosomal H2A-HaloTag was determined to be = 0.032 µm2s-1. To systematically compare the CB levels, the subsequent distributions of the HaloTag-Cbx proteins and their variants were fitted with a three-component Gaussian function using the fixed value = 0.032 µm2s-1 while other parameters were set free. There was no convergence if the distributions for HaloTag-NLS in PGK12.1 mES cells and HaloTag-Cbx7 in Eed−/− mES cells were fitted with a three-component Gaussian function. Thus, a two-component Gaussian function was used for the two distributions. The distributions of the logarithm of diffusion coefficient have previously been used to separate individual populations and to estimate their diffusion coefficients and relative abundance (Liu et al., 2014; Normanno et al., 2015; Saxton, 1997). Fractions of diffusion components were calculated as follows.
We denoted the F1 component as the chromatin-bound (CB) population, F2 as the intermediate diffusion (ID) population, and F3 as the fast diffusion (FD) population. Errors were calculated as the s.d. of parameters obtained from fits.
Determination of residence time
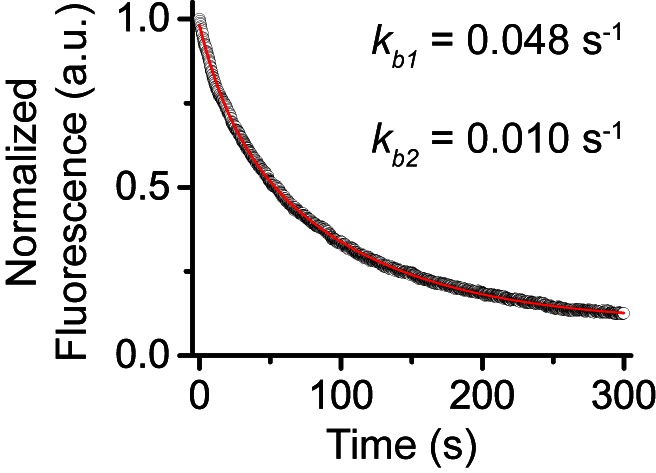
To calculate residence time and survival probability of molecules on chromatin, we performed 30-ms integration time and 170-ms dark time. The track lengths and diffusion coefficients were calculated as described above. We selected molecules for at least two consecutive frames with the maximum likelihood diffusion coefficient < 0.10 µm2/s as chromatin-bound molecules. 97% of H2A-HaloTag molecules had diffusion coefficient below this threshold. The duration of individual tracks (apparent residence time) was directly calculated based on the track length. We estimated the residence times of Cbx7 and its variants using the cumulative frequency distribution of dwell times as described in (Mazza et al., 2012; Mazza et al., 2013; Morisaki et al., 2014). To determine the photobleaching rate of JF549, mES cells stably expressing H2A-HaloTag were incubated with 500 nM JF549 as described above. Live-cell image stacks were taken using the same power and integration and dark time as that for the studying residence times. 9 curves have been obtained. The curves were normalized to 1 and averaged. The averaged curve of photobleaching decay was better described with a two-component exponential decay function based on the F-test implemented in OriginLab.
where is offset, and are amplitude, and and are photobleaching rates. The cumulative frequency distributions of dwell times were normalized for photobleaching by dividing by as described in (Mazza et al., 2012; Mazza et al., 2013; Morisaki et al., 2014). The normalized cumulative frequency distributions were better fitted with a two-component exponential decay function based the F-test implemented in OriginLab.
where is offset, B1 and B2 are amplitude, and and are residence times of the transient chromatin-bound component and the stable chromatin-bound component, respectively. Among the chromatin-bound population, fractions of the transient chromatin-bound component (F1tb) and the stable chromatin-bound component (F1sb) were calculated as follows.
where F1 is the chromatin-bound fraction obtained from fitting the distribution of the logarithm of diffusion coefficient.
Acknowledgements
We thank Dr. Haruhiko Koseki for providing Eed−/−, Ring1a−/−/Ring1bfl/fl; Rosa26::CreERT2, and Bmi1–/–/Mel18–/– mES cell lines, and Dr. Stuart Orkin and Dr. Xiaohua Shen for providing Ezh2−/− mES cell line. We thank Dr. Marino Resendiz for providing RNAs and Dr. Christopher Phiel for sharing instruments. We thank Dr. Aaron M Johnson and Dr. David Engelke for their constructive suggestion and criticism. This work was supported, in whole or in part, by the National Cancer Institute of the National Institutes of Health under Award Number R03CA191443 (to XR). This work was also supported by grants from the CU-Denver Office Research Service (to XR), the American Cancer Society Grant IRG 57-001-53 subaward (to XR), and the Howard Hughes Medical Institute (LDL and JBG).
Funding Statement
The funders had no role in study design, data collection and interpretation, or the decision to submit the work for publication.
Funding Information
This paper was supported by the following grants:
Howard Hughes Medical Institute to Jonathan B Grimm, Luke D Lavis.
National Cancer Institute R03CA191443 to Xiaojun Ren.
American Cancer Society IRG 57-001-53 to Xiaojun Ren.
University of Colorado Denver Office Research Service to Xiaojun Ren.
Additional information
Competing interests
JBG: Filed patent application on the Janelia Fluor (JF) dyes (PCT/US2015/023953).
LDL: Filed patent application on the Janelia Fluor (JF) dyes (PCT/US2015/023953).
The other authors declare that no competing interests exist.
Author contributions
CYZ, Established transgenic mES cell lines, Performed SMT, western blotting and immunofluorescence, Acquisition of data, Analysis and interpretation of data.
RT, Performed SMT and ChIP assay, Acquisition of data, Analysis and interpretation of data.
TNH, Constructed plasmids, Generated mutants, Established transgenic mES cell lines, Performed EMSA, Acquisition of data, Analysis and interpretation of data.
HND, Constructed plasmids, Established mES cell lines, Acquisition of data, Analysis and interpretation of data.
RD, Programming support.
MK, Constructed plasmids, Performed SMT, Acquisition of data, Analysis and interpretation of data.
JBG, Contributed reagents, Provided the JF549 dye.
LDL, Contributed reagents, Provided the JF549 dye.
JL, Constructed plasmids, Performed SMT, Acquisition of data, Analysis and interpretation of data.
FJM, Constructed plasmids, Performed SMT, Acquisition of data, Analysis and interpretation of data.
YL, Performed SMT, Acquisition of data.
TY, Contributed reagents.
XR, Conception and design, Acquisition of data, Analysis and interpretation of data, Drafting or revising the article.
Additional files
References
- Agger K, Cloos PA, Christensen J, Pasini D, Rose S, Rappsilber J, Issaeva I, Canaani E, Salcini AE, Helin K. UTX and JMJD3 are histone H3K27 demethylases involved in HOX gene regulation and development. Nature. 2007;449:731–734. doi: 10.1038/nature06145. [DOI] [PubMed] [Google Scholar]
- Akasaka T, Kanno M, Balling R, Mieza MA, Taniguchi M, Koseki H. A role for mel-18, a Polycomb group-related vertebrate gene, during theanteroposterior specification of the axial skeleton. Development. 1996;122:1513–1522. doi: 10.1242/dev.122.5.1513. [DOI] [PubMed] [Google Scholar]
- Bell JC, Kowalczykowski SC. Mechanics and Single-Molecule Interrogation of DNA Recombination. Annual Review of Biochemistry. 2016;85:193–226. doi: 10.1146/annurev-biochem-060614-034352. [DOI] [PubMed] [Google Scholar]
- Bernstein E, Duncan EM, Masui O, Gil J, Heard E, Allis CD. Mouse polycomb proteins bind differentially to methylated histone H3 and RNA and are enriched in facultative heterochromatin. Molecular and Cellular Biology. 2006;26: 2560–2569. doi: 10.1128/MCB.26.7.2560-2569.2006. [DOI] [PMC free article] [PubMed] [Google Scholar]
- Blackledge NP, Farcas AM, Kondo T, King HW, McGouran JF, Hanssen LL, Ito S, Cooper S, Kondo K, Koseki Y, Ishikura T, Long HK, Sheahan TW, Brockdorff N, Kessler BM, Koseki H, Klose RJ. Variant PRC1 complex-dependent H2A ubiquitylation drives PRC2 recruitment and polycomb domain formation. Cell. 2014;157:1445–1459. doi: 10.1016/j.cell.2014.05.004. [DOI] [PMC free article] [PubMed] [Google Scholar]
- Blackledge NP, Rose NR, Klose RJ. Targeting Polycomb systems to regulate gene expression: modifications to a complex story. Nature Reviews Molecular Cell Biology. 2015;16:643–649. doi: 10.1038/nrm4067. [DOI] [PMC free article] [PubMed] [Google Scholar]
- Boyer LA, Plath K, Zeitlinger J, Brambrink T, Medeiros LA, Lee TI, Levine SS, Wernig M, Tajonar A, Ray MK, Bell GW, Otte AP, Vidal M, Gifford DK, Young RA, Jaenisch R. Polycomb complexes repress developmental regulators in murine embryonic stem cells. Nature. 2006;441:349–353. doi: 10.1038/nature04733. [DOI] [PubMed] [Google Scholar]
- Cao R, Wang L, Wang H, Xia L, Erdjument-Bromage H, Tempst P, Jones RS, Zhang Y. Role of histone H3 lysine 27 methylation in Polycomb-group silencing. Science. 2002;298:1039–1043. doi: 10.1126/science.1076997. [DOI] [PubMed] [Google Scholar]
- Cao R, Zhang Y. SUZ12 is required for both the histone methyltransferase activity and the silencing function of the EED-EZH2 complex. Molecular Cell. 2004;15:57–67. doi: 10.1016/j.molcel.2004.06.020. [DOI] [PubMed] [Google Scholar]
- Chen J, Zhang Z, Li L, Chen BC, Revyakin A, Hajj B, Legant W, Dahan M, Lionnet T, Betzig E, Tjian R, Liu Z. Single-molecule dynamics of enhanceosome assembly in embryonic stem cells. Cell. 2014;156:1274–1285. doi: 10.1016/j.cell.2014.01.062. [DOI] [PMC free article] [PubMed] [Google Scholar]
- Cheng B, Ren X, Kerppola TK. KAP1 represses differentiation-inducible genes in embryonic stem cells through cooperative binding with PRC1 and derepresses pluripotency-associated genes. Molecular and Cellular Biology. 2014;34:2075–2091. doi: 10.1128/MCB.01729-13. [DOI] [PMC free article] [PubMed] [Google Scholar]
- Coleman RA, Liu Z, Darzacq X, Tjian R, Singer RH, Lionnet T. Imaging Transcription: Past, Present, and Future. Cold Spring Harbor Symposia on Quantitative Biology. 2015;80:1–8. doi: 10.1101/sqb.2015.80.027201. [DOI] [PMC free article] [PubMed] [Google Scholar]
- Cooper S, Dienstbier M, Hassan R, Schermelleh L, Sharif J, Blackledge NP, De Marco V, Elderkin S, Koseki H, Klose R, Heger A, Brockdorff N. Targeting polycomb to pericentric heterochromatin in embryonic stem cells reveals a role for H2AK119u1 in PRC2 recruitment. Cell Reports. 2014;7:1456–1470. doi: 10.1016/j.celrep.2014.04.012. [DOI] [PMC free article] [PubMed] [Google Scholar]
- Czermin B, Melfi R, McCabe D, Seitz V, Imhof A, Pirrotta V. Drosophila enhancer of Zeste/ESC complexes have a histone H3 methyltransferase activity that marks chromosomal Polycomb sites. Cell. 2002;111:185–196. doi: 10.1016/S0092-8674(02)00975-3. [DOI] [PubMed] [Google Scholar]
- Dangkulwanich M, Ishibashi T, Bintu L, Bustamante C. Molecular mechanisms of transcription through single-molecule experiments. Chemical Reviews. 2014;114:3203–3223. doi: 10.1021/cr400730x. [DOI] [PMC free article] [PubMed] [Google Scholar]
- de Napoles M, Mermoud JE, Wakao R, Tang YA, Endoh M, Appanah R, Nesterova TB, Silva J, Otte AP, Vidal M, Koseki H, Brockdorff N. Polycomb group proteins Ring1A/B link ubiquitylation of histone H2A to heritable gene silencing and X inactivation. Developmental Cell. 2004;7:663–676. doi: 10.1016/j.devcel.2004.10.005. [DOI] [PubMed] [Google Scholar]
- Duc H, Ren X. Labelling HaloTag Fusion Proteins with HaloTag Ligand in Living Cells. BIO-PROTOCOL. 2017;7:e2526. doi: 10.21769/BioProtoc.2526. [DOI] [PMC free article] [PubMed] [Google Scholar]
- Duzdevich D, Redding S, Greene EC. DNA dynamics and single-molecule biology. Chemical Reviews. 2014;114:3072–3086. doi: 10.1021/cr4004117. [DOI] [PMC free article] [PubMed] [Google Scholar]
- Elderkin S, Maertens GN, Endoh M, Mallery DL, Morrice N, Koseki H, Peters G, Brockdorff N, Hiom K. A phosphorylated form of Mel-18 targets the Ring1B histone H2A ubiquitin ligase to chromatin. Molecular Cell. 2007;28:107–120. doi: 10.1016/j.molcel.2007.08.009. [DOI] [PubMed] [Google Scholar]
- Endoh M, Endo TA, Endoh T, Fujimura Y, Ohara O, Toyoda T, Otte AP, Okano M, Brockdorff N, Vidal M, Koseki H. Polycomb group proteins Ring1A/B are functionally linked to the core transcriptional regulatory circuitry to maintain ES cell identity. Development. 2008;135:1513–1524. doi: 10.1242/dev.014340. [DOI] [PubMed] [Google Scholar]
- Farcas AM, Blackledge NP, Sudbery I, Long HK, McGouran JF, Rose NR, Lee S, Sims D, Cerase A, Sheahan TW, Koseki H, Brockdorff N, Ponting CP, Kessler BM, Klose RJ. KDM2B links the Polycomb Repressive Complex 1 (PRC1) to recognition of CpG islands. eLife. 2012;1:e00205. doi: 10.7554/eLife.00205. [DOI] [PMC free article] [PubMed] [Google Scholar]
- Gao Z, Zhang J, Bonasio R, Strino F, Sawai A, Parisi F, Kluger Y, Reinberg D. PCGF homologs, CBX proteins, and RYBP define functionally distinct PRC1 family complexes. Molecular Cell. 2012;45:344–356. doi: 10.1016/j.molcel.2012.01.002. [DOI] [PMC free article] [PubMed] [Google Scholar]
- Gebhardt JC, Suter DM, Roy R, Zhao ZW, Chapman AR, Basu S, Maniatis T, Xie XS. Single-molecule imaging of transcription factor binding to DNA in live mammalian cells. Nature Methods. 2013;10:421–426. doi: 10.1038/nmeth.2411. [DOI] [PMC free article] [PubMed] [Google Scholar]
- Geertsema HJ, van Oijen AM. A single-molecule view of DNA replication: the dynamic nature of multi-protein complexes revealed. Current Opinion in Structural Biology. 2013;23:788–793. doi: 10.1016/j.sbi.2013.06.018. [DOI] [PubMed] [Google Scholar]
- Gil J, O'Loghlen A. PRC1 complex diversity: where is it taking us? Trends in Cell Biology. 2014;24:632–641. doi: 10.1016/j.tcb.2014.06.005. [DOI] [PubMed] [Google Scholar]
- Grau DJ, Chapman BA, Garlick JD, Borowsky M, Francis NJ, Kingston RE. Compaction of chromatin by diverse Polycomb group proteins requires localized regions of high charge. Genes & Development. 2011;25:2210–2221. doi: 10.1101/gad.17288211. [DOI] [PMC free article] [PubMed] [Google Scholar]
- Grimm JB, English BP, Chen J, Slaughter JP, Zhang Z, Revyakin A, Patel R, Macklin JJ, Normanno D, Singer RH, Lionnet T, Lavis LD, Zhang Z, Lionnet T, Lavis LD. A general method to improve fluorophores for live-cell and single-molecule microscopy. Nature Methods. 2015;12:244–250. doi: 10.1038/nmeth.3256. [DOI] [PMC free article] [PubMed] [Google Scholar]
- Harada BT, Hwang WL, Deindl S, Chatterjee N, Bartholomew B, Zhuang X. Stepwise nucleosome translocation by RSC remodeling complexes. eLife. 2016;5:e10051. doi: 10.7554/eLife.10051. [DOI] [PMC free article] [PubMed] [Google Scholar]
- He J, Shen L, Wan M, Taranova O, Wu H, Zhang Y. Kdm2b maintains murine embryonic stem cell status by recruiting PRC1 complex to CpG islands of developmental genes. Nature Cell Biology. 2013;15:373–384. doi: 10.1038/ncb2702. [DOI] [PMC free article] [PubMed] [Google Scholar]
- Helin K, Dhanak D. Chromatin proteins and modifications as drug targets. Nature. 2013;502:480–488. doi: 10.1038/nature12751. [DOI] [PubMed] [Google Scholar]
- Herbert KM, Greenleaf WJ, Block SM. Single-molecule studies of RNA polymerase: motoring along. Annual Review of Biochemistry. 2008;77:149–176. doi: 10.1146/annurev.biochem.77.073106.100741. [DOI] [PMC free article] [PubMed] [Google Scholar]
- Huh JW, Wu J, Lee CH, Yun M, Gilada D, Brautigam CA, Li B. Multivalent di-nucleosome recognition enables the Rpd3S histone deacetylase complex to tolerate decreased H3K36 methylation levels. The EMBO Journal. 2012;31:3564–3574. doi: 10.1038/emboj.2012.221. [DOI] [PMC free article] [PubMed] [Google Scholar]
- Huynh T, Ren X. Producing GST-Cbx7 Fusion Proteins from Escherichia coli. BIO-PROTOCOL. 2017;7:e2333. doi: 10.21769/BioProtoc.2333. [DOI] [PMC free article] [PubMed] [Google Scholar]
- Izeddin I, Récamier V, Bosanac L, Cissé II, Boudarene L, Dugast-Darzacq C, Proux F, Bénichou O, Voituriez R, Bensaude O, Dahan M, Darzacq X. Single-molecule tracking in live cells reveals distinct target-search strategies of transcription factors in the nucleus. eLife. 2014;3:02230. doi: 10.7554/eLife.02230. [DOI] [PMC free article] [PubMed] [Google Scholar]
- Jaqaman K, Loerke D, Mettlen M, Kuwata H, Grinstein S, Schmid SL, Danuser G. Robust single-particle tracking in live-cell time-lapse sequences. Nature Methods. 2008;5:695–702. doi: 10.1038/nmeth.1237. [DOI] [PMC free article] [PubMed] [Google Scholar]
- Jenuwein T, Allis CD. Translating the histone code. Science. 2001;293:1074–1080. doi: 10.1126/science.1063127. [DOI] [PubMed] [Google Scholar]
- Jiao L, Liu X. Structural basis of histone H3K27 trimethylation by an active polycomb repressive complex 2. Science. 2015;350:aac4383. doi: 10.1126/science.aac4383. [DOI] [PMC free article] [PubMed] [Google Scholar]
- Kagey MH, Melhuish TA, Wotton D. The polycomb protein Pc2 is a SUMO E3. Cell. 2003;113:127–137. doi: 10.1016/S0092-8674(03)00159-4. [DOI] [PubMed] [Google Scholar]
- Kalb R, Latwiel S, Baymaz HI, Jansen PW, Müller CW, Vermeulen M, Müller J. Histone H2A monoubiquitination promotes histone H3 methylation in Polycomb repression. Nature Structural & Molecular Biology. 2014;21:569–571. doi: 10.1038/nsmb.2833. [DOI] [PubMed] [Google Scholar]
- Katz ZB, English BP, Lionnet T, Yoon YJ, Monnier N, Ovryn B, Bathe M, Singer RH. Mapping translation 'hot-spots' in live cells by tracking single molecules of mRNA and ribosomes. eLife. 2016;5:e10415. doi: 10.7554/eLife.10415. [DOI] [PMC free article] [PubMed] [Google Scholar]
- Kaustov L, Ouyang H, Amaya M, Lemak A, Nady N, Duan S, Wasney GA, Li Z, Vedadi M, Schapira M, Min J, Arrowsmith CH. Recognition and specificity determinants of the human cbx chromodomains. Journal of Biological Chemistry. 2011;286:521–529. doi: 10.1074/jbc.M110.191411. [DOI] [PMC free article] [PubMed] [Google Scholar]
- Klauke K, Radulović V, Broekhuis M, Weersing E, Zwart E, Olthof S, Ritsema M, Bruggeman S, Wu X, Helin K, Bystrykh L, de Haan G. Polycomb Cbx family members mediate the balance between haematopoietic stem cell self-renewal and differentiation. Nature Cell Biology. 2013;15:353–362. doi: 10.1038/ncb2701. [DOI] [PubMed] [Google Scholar]
- Knight SC, Xie L, Deng W, Guglielmi B, Witkowsky LB, Bosanac L, Zhang ET, El Beheiry M, Masson JB, Dahan M, Liu Z, Doudna JA, Tjian R. Dynamics of CRISPR-Cas9 genome interrogation in living cells. Science. 2015;350:823–826. doi: 10.1126/science.aac6572. [DOI] [PubMed] [Google Scholar]
- Ku M, Koche RP, Rheinbay E, Mendenhall EM, Endoh M, Mikkelsen TS, Presser A, Nusbaum C, Xie X, Chi AS, Adli M, Kasif S, Ptaszek LM, Cowan CA, Lander ES, Koseki H, Bernstein BE. Genomewide analysis of PRC1 and PRC2 occupancy identifies two classes of bivalent domains. PLoS Genetics. 2008;4:e1000242. doi: 10.1371/journal.pgen.1000242. [DOI] [PMC free article] [PubMed] [Google Scholar]
- Kuzmichev A, Nishioka K, Erdjument-Bromage H, Tempst P, Reinberg D. Histone methyltransferase activity associated with a human multiprotein complex containing the Enhancer of Zeste protein. Genes & Development. 2002;16:2893–2905. doi: 10.1101/gad.1035902. [DOI] [PMC free article] [PubMed] [Google Scholar]
- Lalonde ME, Cheng X, Côté J. Histone target selection within chromatin: an exemplary case of teamwork. Genes & Development. 2014;28:1029–1041. doi: 10.1101/gad.236331.113. [DOI] [PMC free article] [PubMed] [Google Scholar]
- Lee MG, Villa R, Trojer P, Norman J, Yan KP, Reinberg D, Di Croce L, Shiekhattar R. Demethylation of H3K27 regulates polycomb recruitment and H2A ubiquitination. Science. 2007;318:447–450. doi: 10.1126/science.1149042. [DOI] [PubMed] [Google Scholar]
- Leeb M, Wutz A. Ring1B is crucial for the regulation of developmental control genes and PRC1 proteins but not X inactivation in embryonic cells. Journal of Cell Biology. 2007;178:219–229. doi: 10.1083/jcb.200612127. [DOI] [PMC free article] [PubMed] [Google Scholar]
- Lewis EB. A gene complex controlling segmentation in Drosophila. Nature. 1978;276:565–570. doi: 10.1038/276565a0. [DOI] [PubMed] [Google Scholar]
- Li B, Carey M, Workman JL. The role of chromatin during transcription. Cell. 2007a;128:707–719. doi: 10.1016/j.cell.2007.01.015. [DOI] [PubMed] [Google Scholar]
- Li B, Gogol M, Carey M, Lee D, Seidel C, Workman JL. Combined action of PHD and chromo domains directs the Rpd3S HDAC to transcribed chromatin. Science. 2007b;316:1050–1054. doi: 10.1126/science.1139004. [DOI] [PubMed] [Google Scholar]
- Li H, Ren X, Ying L, Balasubramanian S, Klenerman D. Measuring single-molecule nucleic acid dynamics in solution by two-color filtered ratiometric fluorescence correlation spectroscopy. PNAS. 2004;101:14425–14430. doi: 10.1073/pnas.0404295101. [DOI] [PMC free article] [PubMed] [Google Scholar]
- Li J, Xu Y, Long XD, Wang W, Jiao HK, Mei Z, Yin QQ, Ma LN, Zhou AW, Wang LS, Yao M, Xia Q, Chen GQ. Cbx4 governs HIF-1α to potentiate angiogenesis of hepatocellular carcinoma by its SUMO E3 ligase activity. Cancer Cell. 2014;25:118–131. doi: 10.1016/j.ccr.2013.12.008. [DOI] [PubMed] [Google Scholar]
- Liu Z, Lavis LD, Betzig E. Imaging live-cell dynamics and structure at the single-molecule level. Molecular Cell. 2015;58:644–659. doi: 10.1016/j.molcel.2015.02.033. [DOI] [PubMed] [Google Scholar]
- Liu Z, Legant WR, Chen B-C, Li L, Grimm JB, Lavis LD, Betzig E, Tjian R. 3D imaging of Sox2 enhancer clusters in embryonic stem cells. eLife. 2014b;3:e04236. doi: 10.7554/eLife.04236. [DOI] [PMC free article] [PubMed] [Google Scholar]
- Luco RF, Allo M, Schor IE, Kornblihtt AR, Misteli T. Epigenetics in alternative pre-mRNA splicing. Cell. 2011;144:16–26. doi: 10.1016/j.cell.2010.11.056. [DOI] [PMC free article] [PubMed] [Google Scholar]
- Mardaryev AN, Liu B, Rapisarda V, Poterlowicz K, Malashchuk I, Rudolf J, Sharov AA, Jahoda CA, Fessing MY, Benitah SA, Xu GL, Botchkarev VA. Cbx4 maintains the epithelial lineage identity and cell proliferation in the developing stratified epithelium. The Journal of Cell Biology. 2016;212:77–89. doi: 10.1083/jcb.201506065. [DOI] [PMC free article] [PubMed] [Google Scholar]
- Margueron R, Justin N, Ohno K, Sharpe ML, Son J, Drury WJ, Voigt P, Martin SR, Taylor WR, De Marco V, Pirrotta V, Reinberg D, Gamblin SJ. Role of the polycomb protein EED in the propagation of repressive histone marks. Nature. 2009;461:762–767. doi: 10.1038/nature08398. [DOI] [PMC free article] [PubMed] [Google Scholar]
- Margueron R, Li G, Sarma K, Blais A, Zavadil J, Woodcock CL, Dynlacht BD, Reinberg D. Ezh1 and Ezh2 maintain repressive chromatin through different mechanisms. Molecular Cell. 2008;32:503–518. doi: 10.1016/j.molcel.2008.11.004. [DOI] [PMC free article] [PubMed] [Google Scholar]
- Margueron R, Reinberg D. The Polycomb complex PRC2 and its mark in life. Nature. 2011;469:343–349. doi: 10.1038/nature09784. [DOI] [PMC free article] [PubMed] [Google Scholar]
- Martin C, Cao R, Zhang Y. Substrate preferences of the EZH2 histone methyltransferase complex. Journal of Biological Chemistry. 2006;281:8365–8370. doi: 10.1074/jbc.M513425200. [DOI] [PubMed] [Google Scholar]
- Mazza D, Abernathy A, Golob N, Morisaki T, McNally JG. A benchmark for chromatin binding measurements in live cells. Nucleic Acids Research. 2012;40:e119. doi: 10.1093/nar/gks701. [DOI] [PMC free article] [PubMed] [Google Scholar]
- Mazza D, Ganguly S, McNally JG. Monitoring dynamic binding of chromatin proteins in vivo by single-molecule tracking. Methods in Molecular Biology. 2013;1042:117–137. doi: 10.1007/978-1-62703-526-2_9. [DOI] [PubMed] [Google Scholar]
- McGinty RK, Henrici RC, Tan S. Crystal structure of the PRC1 ubiquitylation module bound to the nucleosome. Nature. 2014;514:591–596. doi: 10.1038/nature13890. [DOI] [PMC free article] [PubMed] [Google Scholar]
- Min J, Zhang Y, Xu RM. Structural basis for specific binding of Polycomb chromodomain to histone H3 methylated at Lys 27. Genes & Development. 2003;17:1823–1828. doi: 10.1101/gad.269603. [DOI] [PMC free article] [PubMed] [Google Scholar]
- Montgomery ND, Yee D, Chen A, Kalantry S, Chamberlain SJ, Otte AP, Magnuson T. The murine polycomb group protein Eed is required for global histone H3 lysine-27 methylation. Current Biology. 2005;15:942–947. doi: 10.1016/j.cub.2005.04.051. [DOI] [PubMed] [Google Scholar]
- Morey L, Aloia L, Cozzuto L, Benitah SA, Di Croce L. RYBP and Cbx7 define specific biological functions of polycomb complexes in mouse embryonic stem cells. Cell Reports. 2013;3:60–69. doi: 10.1016/j.celrep.2012.11.026. [DOI] [PubMed] [Google Scholar]
- Morey L, Pascual G, Cozzuto L, Roma G, Wutz A, Benitah SA, Di Croce L. Nonoverlapping functions of the Polycomb group Cbx family of proteins in embryonic stem cells. Cell Stem Cell. 2012;10:47–62. doi: 10.1016/j.stem.2011.12.006. [DOI] [PubMed] [Google Scholar]
- Morisaki T, Müller WG, Golob N, Mazza D, McNally JG. Single-molecule analysis of transcription factor binding at transcription sites in live cells. Nature Communications. 2014;5:4456. doi: 10.1038/ncomms5456. [DOI] [PMC free article] [PubMed] [Google Scholar]
- Mujtaba S, Manzur KL, Gurnon JR, Kang M, Van Etten JL, Zhou MM. Epigenetic transcriptional repression of cellular genes by a viral SET protein. Nature Cell Biology. 2008;10:1114–1122. doi: 10.1038/ncb1772. [DOI] [PMC free article] [PubMed] [Google Scholar]
- Müller J, Hart CM, Francis NJ, Vargas ML, Sengupta A, Wild B, Miller EL, O'Connor MB, Kingston RE, Simon JA. Histone methyltransferase activity of a Drosophila Polycomb group repressor complex. Cell. 2002;111:197–208. doi: 10.1016/S0092-8674(02)00976-5. [DOI] [PubMed] [Google Scholar]
- Ngo TT, Zhang Q, Zhou R, Yodh JG, Ha T. Asymmetric unwrapping of nucleosomes under tension directed by DNA local flexibility. Cell. 2015;160:1135–1144. doi: 10.1016/j.cell.2015.02.001. [DOI] [PMC free article] [PubMed] [Google Scholar]
- Normanno D, Boudarène L, Dugast-Darzacq C, Chen J, Richter C, Proux F, Bénichou O, Voituriez R, Darzacq X, Dahan M. Probing the target search of DNA-binding proteins in mammalian cells using TetR as model searcher. Nature Communications. 2015;6 doi: 10.1038/ncomms8357. [DOI] [PMC free article] [PubMed] [Google Scholar]
- Pasini D, Bracken AP, Jensen MR, Lazzerini Denchi E, Helin K, Denchi EL. Suz12 is essential for mouse development and for EZH2 histone methyltransferase activity. The EMBO Journal. 2004;23:4061–4071. doi: 10.1038/sj.emboj.7600402. [DOI] [PMC free article] [PubMed] [Google Scholar]
- Penny GD, Kay GF, Sheardown SA, Rastan S, Brockdorff N. Requirement for Xist in X chromosome inactivation. Nature. 1996;379:131–137. doi: 10.1038/379131a0. [DOI] [PubMed] [Google Scholar]
- Rando OJ. Combinatorial complexity in chromatin structure and function: revisiting the histone code. Current Opinion in Genetics & Development. 2012;22:148–155. doi: 10.1016/j.gde.2012.02.013. [DOI] [PMC free article] [PubMed] [Google Scholar]
- Ranjan A, Mizuguchi G, FitzGerald PC, Wei D, Wang F, Huang Y, Luk E, Woodcock CL, Wu C. Nucleosome-free region dominates histone acetylation in targeting SWR1 to promoters for H2A.Z replacement. Cell. 2013;154:1232–1245. doi: 10.1016/j.cell.2013.08.005. [DOI] [PMC free article] [PubMed] [Google Scholar]
- Reeves R, Nissen MS. The A.T-DNA-binding domain of mammalian high mobility group I chromosomal proteins. A novel peptide motif for recognizing DNA structure. The Journal of Biological Chemistry. 1990;265:8573–8582. [PubMed] [Google Scholar]
- Ren X, Gavory G, Li H, Ying L, Klenerman D, Balasubramanian S. Identification of a new RNA.RNA interaction site for human telomerase RNA (hTR): structural implications for hTR accumulation and a dyskeratosis congenita point mutation. Nucleic Acids Research. 2003;31:6509–6515. doi: 10.1093/nar/gkg871. [DOI] [PMC free article] [PubMed] [Google Scholar]
- Ren X, Kerppola TK. REST interacts with Cbx proteins and regulates polycomb repressive complex 1 occupancy at RE1 elements. Molecular and Cellular Biology. 2011;31:2100–2110. doi: 10.1128/MCB.05088-11. [DOI] [PMC free article] [PubMed] [Google Scholar]
- Ren X, Li H, Clarke RW, Alves DA, Ying L, Klenerman D, Balasubramanian S. Analysis of human telomerase activity and function by two color single molecule coincidence fluorescence spectroscopy. Journal of the American Chemical Society. 2006;128:4992–5000. doi: 10.1021/ja056613z. [DOI] [PMC free article] [PubMed] [Google Scholar]
- Ren X, Vincenz C, Kerppola TK. Changes in the distributions and dynamics of polycomb repressive complexes during embryonic stem cell differentiation. Molecular and Cellular Biology. 2008;28:2884–2895. doi: 10.1128/MCB.00949-07. [DOI] [PMC free article] [PubMed] [Google Scholar]
- Roscic A, Möller A, Calzado MA, Renner F, Wimmer VC, Gresko E, Lüdi KS, Schmitz ML, Ludi KS. Phosphorylation-dependent control of Pc2 SUMO E3 ligase activity by its substrate protein HIPK2. Molecular Cell. 2006;24:77–89. doi: 10.1016/j.molcel.2006.08.004. [DOI] [PubMed] [Google Scholar]
- Ruan C, Lee CH, Cui H, Li S, Li B. Nucleosome contact triggers conformational changes of Rpd3S driving high-affinity H3K36me nucleosome engagement. Cell Reports. 2015;10:204–215. doi: 10.1016/j.celrep.2014.12.027. [DOI] [PMC free article] [PubMed] [Google Scholar]
- Ruthenburg AJ, Li H, Patel DJ, Allis CD. Multivalent engagement of chromatin modifications by linked binding modules. Nature Reviews. Molecular Cell Biology. 2007;8:983–994. doi: 10.1038/nrm2298. [DOI] [PMC free article] [PubMed] [Google Scholar]
- Saxton MJ. Single-particle tracking: the distribution of diffusion coefficients. Biophysical Journal. 1997;72:1744–1753. doi: 10.1016/S0006-3495(97)78820-9. [DOI] [PMC free article] [PubMed] [Google Scholar]
- Schwartz YB, Kahn TG, Nix DA, Li XY, Bourgon R, Biggin M, Pirrotta V. Genome-wide analysis of Polycomb targets in Drosophila melanogaster. Nature Genetics. 2006;38:700–705. doi: 10.1038/ng1817. [DOI] [PubMed] [Google Scholar]
- Senthilkumar R, Mishra RK. Novel motifs distinguish multiple homologues of Polycomb in vertebrates: expansion and diversification of the epigenetic toolkit. BMC Genomics. 2009;10:549. doi: 10.1186/1471-2164-10-549. [DOI] [PMC free article] [PubMed] [Google Scholar]
- Shen X, Kim W, Fujiwara Y, Simon MD, Liu Y, Mysliwiec MR, Yuan GC, Lee Y, Orkin SH. Jumonji modulates polycomb activity and self-renewal versus differentiation of stem cells. Cell. 2009;139:1303–1314. doi: 10.1016/j.cell.2009.12.003. [DOI] [PMC free article] [PubMed] [Google Scholar]
- Shen X, Liu Y, Hsu YJ, Fujiwara Y, Kim J, Mao X, Yuan GC, Orkin SH. EZH1 mediates methylation on histone H3 lysine 27 and complements EZH2 in maintaining stem cell identity and executing pluripotency. Molecular Cell. 2008;32:491–502. doi: 10.1016/j.molcel.2008.10.016. [DOI] [PMC free article] [PubMed] [Google Scholar]
- Simon JA, Kingston RE. Occupying chromatin: Polycomb mechanisms for getting to genomic targets, stopping transcriptional traffic, and staying put. Molecular Cell. 2013;49:808–824. doi: 10.1016/j.molcel.2013.02.013. [DOI] [PMC free article] [PubMed] [Google Scholar]
- Swinstead EE, Miranda TB, Paakinaho V, Baek S, Goldstein I, Hawkins M, Karpova TS, Ball D, Mazza D, Lavis LD, Grimm JB, Morisaki T, Grøntved L, Presman DM, Hager GL. Steroid Receptors Reprogram FoxA1 Occupancy through Dynamic Chromatin Transitions. Cell. 2016;165:593–605. doi: 10.1016/j.cell.2016.02.067. [DOI] [PMC free article] [PubMed] [Google Scholar]
- Tardat M, Albert M, Kunzmann R, Liu Z, Kaustov L, Thierry R, Duan S, Brykczynska U, Arrowsmith CH, Peters AH. Cbx2 targets PRC1 to constitutive heterochromatin in mouse zygotes in a parent-of-origin-dependent manner. Molecular Cell. 2015;58:157–171. doi: 10.1016/j.molcel.2015.02.013. [DOI] [PubMed] [Google Scholar]
- Tatavosian R, Zhen CY, Duc HN, Balas MM, Johnson AM, Ren X. Distinct Cellular Assembly Stoichiometry of Polycomb Complexes on Chromatin Revealed by Single-molecule Chromatin Immunoprecipitation Imaging. Journal of Biological Chemistry. 2015;290:28038–28054. doi: 10.1074/jbc.M115.671115. [DOI] [PMC free article] [PubMed] [Google Scholar]
- Tavares L, Dimitrova E, Oxley D, Webster J, Poot R, Demmers J, Bezstarosti K, Taylor S, Ura H, Koide H, Wutz A, Vidal M, Elderkin S, Brockdorff N. RYBP-PRC1 complexes mediate H2A ubiquitylation at polycomb target sites independently of PRC2 and H3K27me3. Cell. 2012;148:664–678. doi: 10.1016/j.cell.2011.12.029. [DOI] [PMC free article] [PubMed] [Google Scholar]
- Tokunaga M, Imamoto N, Sakata-Sogawa K. Highly inclined thin illumination enables clear single-molecule imaging in cells. Nature Methods. 2008;5:159–161. doi: 10.1038/nmeth1171. [DOI] [PubMed] [Google Scholar]
- Vincenz C, Kerppola TK. Different polycomb group CBX family proteins associate with distinct regions of chromatin using nonhomologous protein sequences. PNAS. 2008;105:16572–16577. doi: 10.1073/pnas.0805317105. [DOI] [PMC free article] [PubMed] [Google Scholar]
- Wang H, Wang L, Erdjument-Bromage H, Vidal M, Tempst P, Jones RS, Zhang Y. Role of histone H2A ubiquitination in Polycomb silencing. Nature. 2004a;431:873–878. doi: 10.1038/nature02985. [DOI] [PubMed] [Google Scholar]
- Wang L, Brown JL, Cao R, Zhang Y, Kassis JA, Jones RS. Hierarchical recruitment of polycomb group silencing complexes. Molecular Cell. 2004b;14:637–646. doi: 10.1016/j.molcel.2004.05.009. [DOI] [PubMed] [Google Scholar]
- Whitcomb SJ, Basu A, Allis CD, Bernstein E. Polycomb Group proteins: an evolutionary perspective. Trends in Genetics. 2007;23:494–502. doi: 10.1016/j.tig.2007.08.006. [DOI] [PubMed] [Google Scholar]
- Yap KL, Li S, Muñoz-Cabello AM, Raguz S, Zeng L, Mujtaba S, Gil J, Walsh MJ, Zhou MM. Molecular interplay of the noncoding RNA ANRIL and methylated histone H3 lysine 27 by polycomb CBX7 in transcriptional silencing of INK4a. Molecular Cell. 2010;38:662–674. doi: 10.1016/j.molcel.2010.03.021. [DOI] [PMC free article] [PubMed] [Google Scholar]
- Zhang Z, Revyakin A, Grimm JB, Lavis LD, Tjian R. Single-molecule tracking of the transcription cycle by sub-second RNA detection. eLife. 2014;3:e01775. doi: 10.7554/eLife.01775. [DOI] [PMC free article] [PubMed] [Google Scholar]
- Zhen CY, Duc HN, Kokotovic M, Phiel CJ, Ren X. Cbx2 stably associates with mitotic chromosomes via a PRC2- or PRC1-independent mechanism and is needed for recruiting PRC1 complex to mitotic chromosomes. Molecular Biology of the Cell. 2014;25:3726–3739. doi: 10.1091/mbc.E14-06-1109. [DOI] [PMC free article] [PubMed] [Google Scholar]