Abstract
This article reports the deposition and characterization of nanostructured calcium phosphate (nCaP) on magnesium–yttrium alloy substrates and their cytocompatibility with bone marrow derived mesenchymal stem cells (BMSCs). The nCaP coatings were deposited on magnesium and magnesium–yttrium alloy substrates using proprietary transonic particle acceleration process for the dual purposes of modulating substrate degradation and BMSC adhesion. Surface morphology and feature size were analyzed using scanning electron microscopy and quantitative image analysis tools. Surface elemental compositions and phases were analyzed using energy dispersive X-ray spectroscopy and X-ray diffraction, respectively. The deposited nCaP coatings showed a homogeneous particulate surface with the dominant feature size of 200–500 nm in the long axis and 100–300 nm in the short axis, and a Ca/P atomic ratio of 1.5–1.6. Hydroxyapatite was the major phase identified in the nCaP coatings. The modulatory effects of nCaP coatings on the sample degradation and BMSC behaviors were dependent on the substrate composition and surface conditions. The direct culture of BMSCs in vitro indicated that multiple factors, including surface composition and topography, and the degradation-induced changes in media composition, influenced cell adhesion directly on the sample surface, and indirect adhesion surrounding the sample in the same culture. The alkaline pH, the indicator of Mg degradation, played a role in BMSC adhesion and morphology, but not the sole factor. Additional studies are necessary to elucidate BMSC responses to each contributing factor.
1 Introduction
1.1 Magnesium and magnesium–yttrium alloy for biodegradable implant applications
Magnesium (Mg) and its alloys have attracted increasing interest for use as biodegradable implants, such as fixation devices for orthopedic and craniomaxillofacial surgeries, due to their promising mechanical and biological properties, as well as their ability to degrade and resorb in the body. A second surgical procedure is often required for removal of currently used non-degradable implants. The degradability of Mg in physiological fluids eliminates the need for additional surgeries for implant removal. In addition to biodegradability, Mg possesses many advantages over the current metallic materials (e.g., titanium alloys, cobalt–chromium alloys) used for implants. Mechanically, Mg-based implants have similar elastic modulus and density as natural bone, thus reducing stress-shielding effects on bone [1–4]. Biologically, Mg is osteoconductive, [1, 5] which promotes osteointegration, a key requirement for the success of implants. Mg is also naturally present in the human body with almost 50 % stored in bone [1, 6]. The degradation products of Mg (mainly Mg2+ and OH− ions) are non-toxic, efficiently excreted through kidneys, and released in urine [3].
Mg reacts with water to produce a layer of magnesium hydroxide [Mg(OH)2] precipitates on the surface, and hydrogen gas (H2). The following reactions describe Mg degradation [7–9].
| (1a) |
| (1b) |
This precipitated porous layer only somewhat protects the metallic substrate from further degradation. Chloride ions (Cl− ions) in the physiological fluid cause Mg to undergo pitting corrosion [10, 11], which leads to accelerated degradation and loss of mechanical strength prematurely [7, 12]. Galvanic reactions and mechanical stress also induce Mg degradation [13].
The key challenge that hinders clinical translation of Mg-based implants is their rapid degradation rate in the body fluids containing abundant Cl− ions [14]. Rapid degradation of Mg leads to undesirable outcomes for most medical implants, including accumulation of hydrogen gas that leads to cavities [3, 6, 15–17], local alkaline pH due to the release of hydroxide (OH−) ions during degradation [3, 6, 18, 19], and pre-mature mechanical failure before bone tissue heals. The clinical requirement for Mg-based implants is to retain mechanical stability during tissue healing (typically 12 weeks for bone) and then gradually degrade afterwards. Therefore, it is crucial to control the degradation rate of Mg in the physiological environment.
Alloying elements, such as yttrium (Y), are often incorporated into Mg to reduce corrosion under certain conditions [8, 20], and improve mechanical properties such as strength [21, 22], hardness [21], and ductility [23]. However, depending on the alloy composition, processing, microstructure, and surface condition, as well as physiological environment (e.g., fluid composition and flow), Y can either promote or inhibit Mg corrosion (or degradation) [4]. The addition of Y to Mg can protect Mg from rapid degradation by the formation of Y2O3 oxide layer, which acts as a passivation layer on the surface of Mg, and impedes corrosion reactions [4]. Y can also decrease the grain size of Mg matrix, which is beneficial for decreasing the degradation rate. Conversely, Y can induce or even accelerate degradation through micro galvanic coupling by acting as a cathode to the α phase. Thus, it is interesting to investigate the degradation and cytocompatiblity of magnesium–yttrium (MgY) alloys with different surfaces.
1.2 Nanostructured calcium phosphate coatings for MG-based biodegradable implants
It is well established that surface coatings can impede the degradation of Mg substrate [24–29]. Calcium phosphate (CaP) coatings were reported to delay the penetration of water and other ions to the Mg substrate, and thus decrease the degradation rate and reduce the alkalinity of the surrounding fluid. Importantly, the phosphate ions (PO43−) assist in the precipitation of magnesium phosphates that delay pitting corrosion, and thereby slow down Mg degradation [7, 10, 30]. Moreover, CaP, the mineral phase of natural bone, is an excellent coating material for bone interface due to its ability to enhance bone integration [31, 32]. In addition to improving degradation properties of Mg, CaP-based bioceramics have been previously explored as coating materials to improve osteoblast responses, and enhance early bone integration with the implant [1, 15, 30, 33, 34].
Additionally, nanostructured calcium phosphate (nCaP) not only mimics the chemistry of natural bone, but also provides nano-scale surface features that can further enhance bone tissue regeneration. Natural bone is a nanostructured material composed of 70 % hydroxyapatite [HA, Ca10(PO4)6(OH)2] of approximately 5 nm in diameter and 50 nm in length [35], a derivative of CaP [36]. Naturally, bone marrow derived cells are customized to interact with nanostructured materials. Moreover, previous studies have shown significantly greater osteoblast adhesion on nanostructured HA surfaces than on conventional micron-sized HA after 4 h of culture in vitro [37, 38]. Likewise, osteoblast proliferation increased significantly on nanostructured HA than on micron-sized HA after 3 and 5 days of culture [38]. Therefore, nCaP coatings on Mg not only can reduce the biodegradation rate to meet the clinical requirements for orthopedic and craniomaxillofacial implants, but also provide a biomimetic interface to enhance osteointegration.
1.3 Research objective
A successful biodegradable implant should have controllable degradation rate, and possess surface properties that improve implant-bone integration. Mg degradation alters its surface microstructure, chemistry, mechanical properties, and ultimately, its interactions with adjacent cells. The surface conditions (presence vs. absence of oxide layer on Mg or Mg alloy substrate) influence the coating-substrate interface and degradation rate [14]. Thus, nCaP coatings were deposited and characterized on both types of surfaces for Mg and MgY alloys. Bone marrow derived mesenchymal stem cells (BMSCs) play an important role in bone-implant integration [39]. Therefore, to mimic the in vivo physiological environment for implants, BMSCs were used as the model cells to evaluate cytocompatibility of nCaP-coated Mg and MgY alloy samples in this study. BMSCs were directly cultured on the respective nCaP-coated or non-coated Mg and MgY samples with metallic or oxidized surfaces to examine the factors affecting BMSC adhesion and morphology.
2 Materials and methods
2.1 Fabrication of nCaP-coated Mg and MgY samples
Pure (99.9 %) Mg (as-rolled 250 μm thick sheets, Good-fellow Inc., Oakdale, PA, USA) and magnesium-4 wt% yttrium (MgY) alloy were used in this study. MgY alloy was prepared in a protected environment by melting pure Mg with 4 wt% Y and casted as an ingot. A wire electric discharge machine (AgieCharmilles, Agiecut 200 VHP) was used to cut the MgY ingot into 250 μm thick sheets. The pure Mg and MgY sheets of 250 μm thick were then cut into 10 mm × 10 mm squares for coating deposition and cell culture. Both pure Mg and MgY alloy sheets had a thermal oxide layer on their surface, which were termed as Mg_O and MgY_O, respectively, in this study. Some substrates were subsequently ground with 600, 800, 1200 grit silicon carbide abrasive paper to remove the oxide layer, and were termed as Mg_P and MgY_P, respectively.
Each sample was ultrasonically cleaned with ethanol for 10 min before the nCaP deposition process. HA [Ca10(-PO4)6(OH)2] nanoparticles (Himed, Old Bethpage, NY) were deposited on both sides of the Mg and MgY substrates using the transonic particle acceleration (TPA) deposition process, also known as IonTite®. TPA is a proprietary in-house coating process at N2 Biomedical (formerly Spire Biomedical Inc.) for depositing thin films of ceramics and other materials onto surfaces at low temperature and under precisely controlled conditions [40]. The non-coated Mg_P, Mg_O, MgY_P, and MgY_O substrates were prepared as the controls.
2.2 Surface characterization
Surface morphology and elemental compositions of the nCaP-coated and non-coated Mg_P, Mg_O, MgY_P, and MgY_O samples were characterized using scanning electron microscopy (SEM; Philips XL30) and attached energy dispersive X-ray spectroscopy (EDS; EDAX® Genesis), respectively, at an accelerating voltage of 10–20 kV and a spot size of 3. EDS was performed at a magnification of ×2500 for analyzing a larger area. For clear visualization of individual particles, the SEM images of the nCaP coating surfaces at a higher magnification of ×10,000–×25,000 were used to determine the particle size and distribution using ImageJ quantitative image analysis tools. The number of particles within each size range divided by the total number of particles provides the respective frequency of each particle size range.
The cross section of the nCaP-coated MgY samples was exposed by cutting, mounted on a 90° SEM holder (Ted Pella) using double-sided copper tape, sputter coated with platinum/palladium at 20 mA for 60 s, and then imaged using a scanning electron microscope (SEM; Nova Nano-SEM 450, FEI Inc.) at an accelerating voltage of 5 kV and a spot size of 4.5. The coating thickness was measured on the cross-section images using the ImageJ analysis tools.
The phases present in the nCaP before and after coating deposition were examined using X-ray diffraction (XRD; Empyrean, PANalytical) at 45 kV and 40 mA with 2θ angles from 10° to 80° at a step size of 0.01°. The diffraction peaks were identified based on the international center for diffraction data (ICDD) database using HighS-core software (PANAlytical).
2.3 In vitro cytocompatibility study with BMSC
2.3.1 Isolation and culture of BMSCs
The BMSCs were harvested from the femur and tibia of a single 19 day-old male Sprague–Dawley rat weanling following euthanasia by CO2, using an approved protocol by the Institutional Animal Care and Use Committee (IACUC) at the University of California at Riverside. Under standard sterile conditions, the ends of the femur and tibia bones were severed and bone marrow was flushed out of the bone cavity using a syringe containing Dulbecco’s modified Eagle medium (DMEM, Invitrogen) supplemented with 10 % fetal bovine serum (FBS, Invitrogen) and 1 % penicillin–streptomycin (P/S, Invitrogen). The collected bone marrow was filtered through a 70-μm nylon strainer, to remove tissue debris and cell aggregates. The filtered cells were then cultured with the supplemented DMEM in a T75 tissue culture treated flasks (BD Falcon) in an incubator under standard cell culture conditions (37 °C, 95/5 % air/CO2, a sterile and humidified environment) until the BMSCs reached confluency.
2.3.2 Direct culture of BMSCs with nCaP coated and non-coated Mg and MgY samples
The cell culture experiments were conducted on nCaP-coated and non-coated Mg and MgY samples with metallic or oxide surface. Prior to BMSC seeding, the nCaP-coated and non-coated Mg_P, Mg_O, MgY_P, and MgY_O samples were cleaned by soaking in anhydrous ethanol (200 proof, Koptec) for 30 min, dried in air at room temperature for at least 2 h, and then weighed to establish the initial mass of each sample. Subsequently, the samples were disinfected under ultraviolet (UV) radiation for 24 h. To record the change of surface appearance, the samples were photographed before and after cell culture. When the BMSCs reached 90 % confluency, they were detached from the flask using trypsin, and seeded at a density of 10,000 cells/cm2 onto the nCaP-coated and non-coated Mg and MgY samples in a 12 well polystyrene tissue culture (PSTC) plate. After seeding, the culture plates were incubated in DMEM supplemented with 10 % FBS and 1 % P/S, under standard cell culture conditions, for 24 h. The culture period of 24 h was selected mainly because Mg_P, Mg_O, MgY_P, and MgY_O samples caused the most significant pH increase in DMEM within the first 24 h as compared with the later time points [4, 41]. Moreover, Mg-based metallic materials were previously reported to have the most significant effects on BMSC behaviors within the first 24 h [42]. Additionally, the in vitro culture of the first 24 h resembles the in vivo BMSC responses to implants within the first 24 h of post-operation, a critical period for patient recovery.
After 24 h of culture, the media were collected to measure the pH. Phosphate buffered saline (PBS) was used to wash away non-adhered cells after the 24-h culture. The adherent cells were fixed with 4 % paraformaldehyde, stained with 4′,6-diamidino-2-phenylindole (DAPI; Life Technologies) nucleic acid stain and Alexa Flour® 488 Phalloidin (Life Technologies) F-actin stain, and then imaged using a fluorescence microscope (Nikon Eclipse Ti). Subsequently, the samples were dried in air at room temperature for at least 24 h until they reached constant mass, and then weighed to determine the final mass of each sample. The sample mass change was calculated as final mass/initial mass.
The BMSCs adhered on each sample surface were counted and called direct adhesion, because they were in direct contact with the sample surface. The BMSCs on the PSTC plate surface surrounding each sample were also quantified and called indirect adhesion, because they were not directly attached onto the sample surface, but in the same culture. At least six or more random fields were imaged, and the stained cell nuclei were counted in each image manually. ImageJ analysis tools were used to verify the manual counting. Cell adhesion density (cells per cm2) was calculated as the average number of cells per unit area. The percentage of attached cells were calculated by dividing the cell adhesion density by the initial seeding density. The DMEM with the cells only (without any Mg-based samples) and DMEM alone (without cells and samples) were used as controls. Quantitative data were analyzed using the Games–Howell test, after taking the log of the data to acquire a normal distribution. Statistical significance was considered at P < 0.05 (n = 6).
3 Results and discussion
3.1 Surface characterization before cell culture studies
3.1.1 Surface microstructure and composition of the nCaP-coated and non-coated Mg and MgY samples
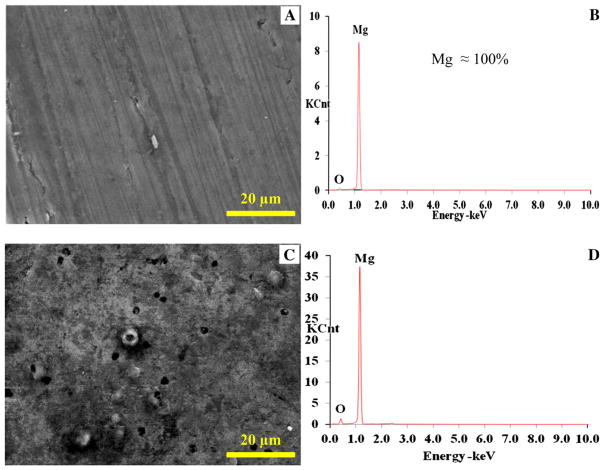
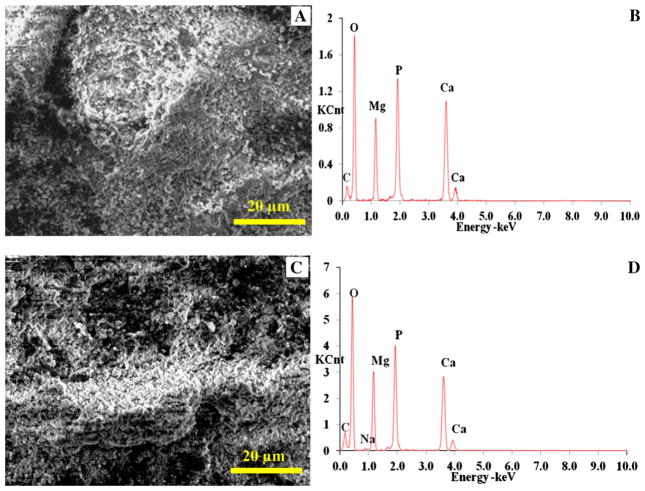
The scanning electron micrographs (SEM) and EDS analyses showed that the Mg_P and Mg_O surfaces had very different surface topography and elemental composition. The Mg_P surface appeared to be metallic with traces of polishing marks before coating (Fig. 1a), and EDS analysis confirmed it was Mg (Fig. 1b; Table 1). In contrast, the Mg_O surface appeared rough with micron-sized pores (Fig. 1c), and EDS analysis clearly confirmed presence of oxygen (O) (Fig. 1d; Table 1). The nCaP coatings deposited on both the Mg_P (Fig. 2a) and Mg_O (Fig. 2c) surface were uniform with a particulate-like microstructure, typical for nCaP coating deposited by TPA process. The nCaP coatings contain Ca, P, and O, which were all observed in the EDS spectra for both the coated Mg_P and Mg_O samples (Fig. 2b, d, respectively; Table 2). Figure 2d shows the trace of sodium (Na) with the smallest peak. Since Na is most likely a contaminant, it was excluded in quantitative EDS analyses. Mg peaks from the Mg substrates were observed due to the porous nature of the nCaP coating; however, the percentage of Mg in the nCaP-coated samples significantly decreased when compared with the non-coated Mg substrates according to EDS quantification (Tables 1, 2). This reduction confirmed the coating coverage. The EDS quantification showed the coating on the Mg_P and Mg_O samples had a Ca/P atomic ratio of 1.6 (Table 2), close to the nCaP powder used for deposition. Crystalline stoichiometric HA has a Ca/P atomic ratio of 1.67.
Fig. 1.
a, c SEM images and b, d EDS analyses of a, b Mg_P and c, d Mg_O samples before surface coating. Scale bar 20 μm. Original magnification × 2500
Table 1.
The surface elemental compositions of non-coated Mg and MgY samples in atomic (at.%) and weight percentage (wt%) before BMSC culture
| Element | Non-coated
|
|||||||
|---|---|---|---|---|---|---|---|---|
| Mg_P
|
Mg_O
|
MgY_P
|
MgY_O
|
|||||
| wt% | at.% | wt% | at.% | wt% | at.% | wt% | at.% | |
| Mg | 100 | 100 | 91 | 86 | 94 | 94 | 57 | 48 |
| O | Trace | Trace | 9 | 13 | 3 | 5 | 35 | 45 |
| Y | – | – | – | – | 4 | 1 | 4 | 1 |
Fig. 2.
a, c SEM images and b, d EDS analyses of nCaP-coated a, b Mg_P and c, d Mg_O samples. The Ca/P ratio was 1.6 for nCaP-coated Mg_P and Mg_O samples. Scale bar 20 μm. Original magnification × 2500
Table 2.
The surface elemental compositions of nCaP-coated Mg and MgY samples in atomic (at.%) and weight percentage (wt%) before BMSC culture
| Element | nCaP-coated
|
|||||||
|---|---|---|---|---|---|---|---|---|
| Mg_P
|
Mg_O
|
MgY_P
|
MgY_O
|
|||||
| wt% | at.% | wt% | at.% | wt% | at.% | wt% | at.% | |
| Mg | 8 | 8 | 9 | 9 | 6 | 6 | 4 | 3 |
| Ca | 37 | 22 | 37 | 22 | 33 | 18 | 36 | 21 |
| P | 18 | 14 | 18 | 14 | 17 | 12 | 19 | 14 |
| O | 31 | 47 | 31 | 45 | 34 | 46 | 35 | 49 |
| C | 6 | 11 | 6 | 11 | 10 | 18 | 7 | 13 |
| Ca/P | – | 1.6 | – | 1.6 | – | 1.5 | – | 1.5 |
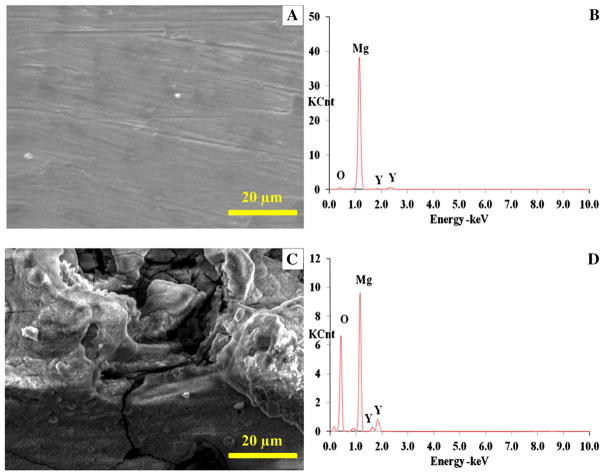
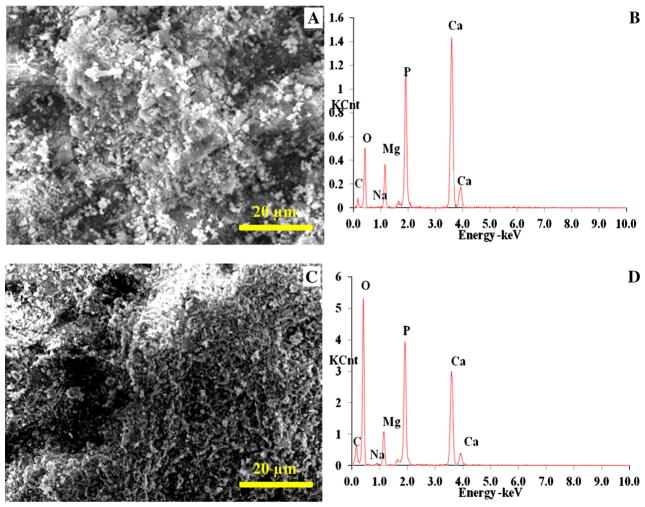
SEM and EDS also showed that the MgY_P and MgY_O had very different surface topography and elemental composition. The MgY_P surface appeared to be metallic with traces of polishing marks (Fig. 3a), similar to Mg_P before coating. EDS analysis confirmed the presence of Mg and Y for the alloy (with approximately 4 wt% Y), with trace of O (Fig. 3b; Table 1). In contrast, the MgY_O surface appeared rough with many cracks (Fig. 3c). EDS confirmed the presence of Mg and Y (with approximately 4 wt% Y), and a much larger amount of O compared with the MgY_P sample (Fig. 3d; Table 1). The nCaP coating deposited on both the MgY_P and MgY_O surface was uniform with a particulate-like microstructure (Fig. 4a, c, respectively). However, the nCaP coating on the MgY_P sample appeared to have bigger aggregates than the nCaP coating on the MgY_O surface. Mg, Ca, P, and O were all observed in the EDS spectra of both samples (Fig. 4b, d, respectively; Table 2). The presence of Ca, P, and O confirmed the nCaP coating coverage on the MgY substrates. The detection of smaller Mg peaks was expected due to the nCaP coating and its porous microstructure, similarly to the nCaP-coated Mg substrates. No Y was detected on the nCaP-coated MgY_P and MgY_O surfaces, although Y was detected on the MgY substrates before the coating deposition. The EDS quantification showed that the nCaP coating on the MgY_P and MgY_O samples had a Ca/P atomic ratio of 1.5 (Table 2). The Ca/P ratios of the nCaP coatings on the MgY samples were slightly less than that on the Mg_P and Mg_O surfaces. The elemental composition differences in the deposited nCaP coatings might be attributed to the differences in the MgY alloy surfaces versus Mg surfaces, since the TPA coating process parameters were the same for all the nCaP coatings deposited. It was noted that some carbon was detected in the nCaP-coated Mg surface layer (Table 2). This might be due to the carbon residual in the nCaP powder since carbon was not detected on non-coated substrates.
Fig. 3.
a, c SEM images and b, d EDS analyses of a, b MgY_P and c, d MgY_O samples before surface coating. Scale bar 20 μm. Original magnification × 2500
Fig. 4.
a, c SEM images and b, d EDS analyses of nCaP-coated a, b MgY_P and (C,D) MgY_O samples. The Ca/P ratio was 1.5 for nCaP-coated MgY_P and MgY_O samples. Scale bar 20 μm. Original magnification ×2500
3.1.2 Particle size of the nCaP coatings
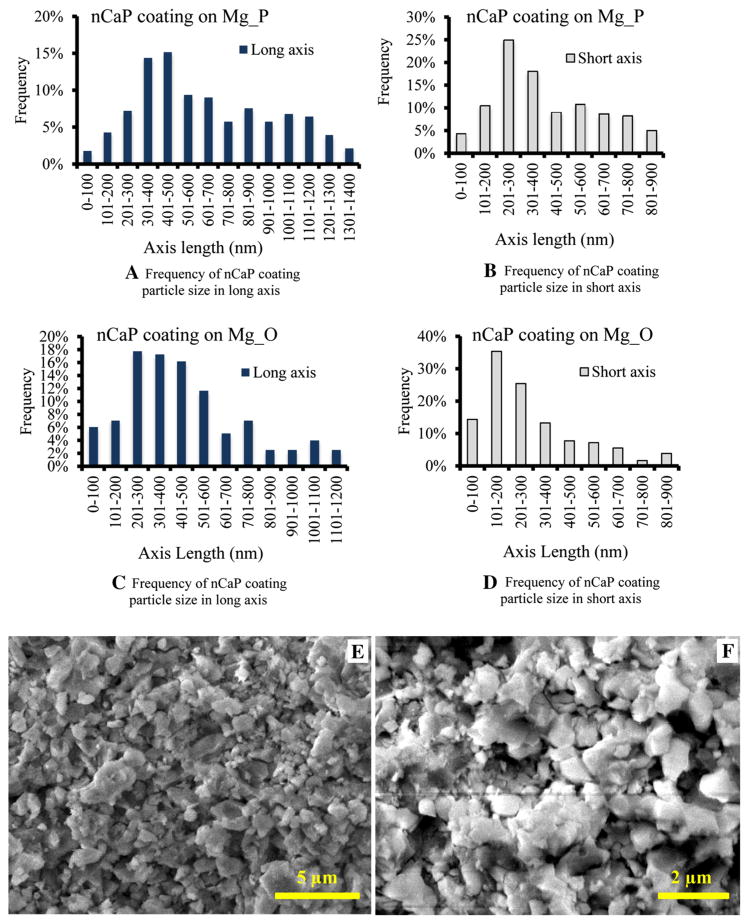
The high-magnification SEM images of the nCaP-coated Mg_P, Mg_O, MgY_P, and MgY_O surfaces were analyzed using the quantitative image analysis tools in ImageJ to determine the nCaP particle size, as shown in Figs. 5 and 6. The nCaP coating on the Mg_P sample showed a wide distribution of particle size ranging from 50 to 1400 nm in the long axis and 35–900 nm in the short axis (Fig. 5a, b). The dominant particle size (i.e. the most frequent particle size) was between 300 and 500 nm in the long axis and 200–300 nm in the short axis. The nCaP coating on the Mg_O sample showed a slightly smaller particle size range with long and short axis particle size ranging from 24 to 1200 and 17 to 900 nm, respectively (Fig. 5c, d). The dominant particle size was between 200 and 400 nm in the long axis and 100–200 nm in short axis. Figure 5e and f are the representative high-magnification SEM images of nCaP-coated Mg samples used for the particle size analyses.
Fig. 5.
Particle size analyses of nCaP coating on the a, b Mg_P and c, d Mg_O samples using the ImageJ quantitative image analysis tools. e, f Representative high-magnification SEM images of nCaP-coated e Mg_P and f Mg_O that were used for the particle size analyses. a In the long axis, particle size ranged from 50 to 1400 nm, with the most frequent particle size between 300 and 500 nm. b In the short axis, particle size ranged from 35 to 900 nm, with the most frequent particle size between 200 and 300 nm. c In the long axis, particle size ranged from 24 to 1200 nm, with the most frequent particle size between 200 and 400 nm. d In the short axis, particle size ranged from 17 to 900 nm, with the most frequent particle size between 100 and 200 nm. e scale bar 5μm. Original magnification ×10,000. f scale bar 2 μm. Original magnification ×25,000
Fig. 6.
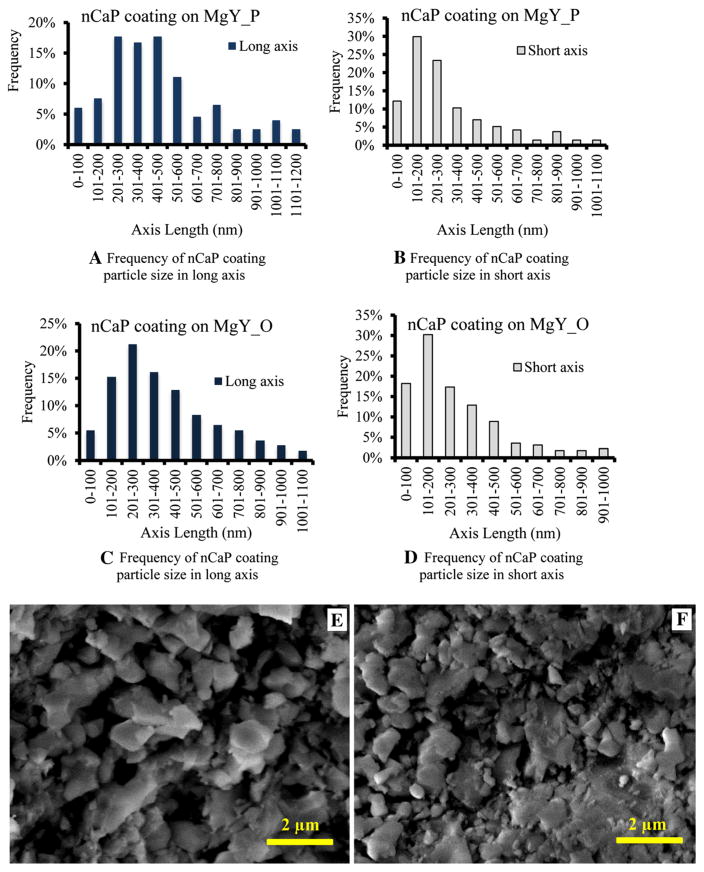
Particle size analyses of nCaP coating on the a, b MgY_P and c, d MgY_O samples using the ImageJ quantitative image analysis tools. e, f Representative high-magnification SEM images of nCaP-coated e MgY_P and f MgY_O that were used for the particle size analyses. a In the long axis, particle size ranged from 24 to 1200 nm, with the most frequent particle size between 200 and 500 nm. b In the short axis, particle size ranged from 17 to 1100 nm, with the most frequent particle size between 100 and 200 nm. c In the long axis, particle size ranged from 25 to 1045 nm, with the most frequent particle size between 200 and 300 nm. d In the short axis, particle size ranged from 15 to 975 nm, with the most frequent particle size between 100 and 200 nm. e, f scale bar 2 μm. Original magnification ×25,000
The nCaP coating on the MgY_P sample showed that the particle size ranged from 24 to 1200 nm and 17 to 1100 in long and short axis, respectively, with the dominant particle size of 200–500 nm in long axis and 100–200 nm in short-axis (Fig. 6a, b), similar to the nCaP coating on Mg_O. The nCaP coating on the MgY_O sample showed that the particle size ranged from 25 to 1045 and 15 to 975 nm in long and short axis, respectively, with the dominant particle size between 200 and 300 nm in long axis, similar to the nCaP coating on Mg_O, and 100–200 nm in short axis, similar to the nCaP coating on Mg_O and MgY_P (Fig. 6c, d). Figure 6e and f are the representative high-magnification SEM images of nCaP-coated MgY samples used for the particle size analyses.
3.1.3 Thickness of the nCaP coatings
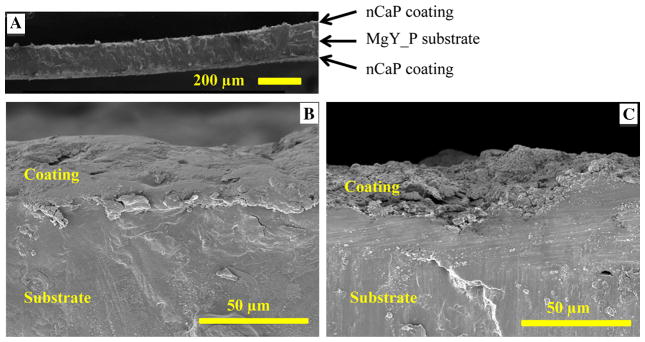
The thickness of the nCaP coating was determined based on SEM images of cross sections, as shown in Fig. 7. The low-magnification images of cross-section (Fig. 7a) confirmed the coating on both sides of substrates. The nCaP coating had an average thickness of 25 μm on the MgY substrates. The coating thickness on the Mg substrates was previously reported to be 45 μm [25]. The differences in Mg and MgY substrates (e.g., composition, surface properties, and mechanical properties) might have affected the coating thickness since the TPA deposition parameters were the same for all the nCaP coatings.
Fig. 7.
SEM images of the cross sections of nCaP coatings on the a, b MgY_P substrate and c MgY_O substrate. Original magnification was ×200 for a, and ×1000 for b and c. The thickness of the coating was determined to be 25 μm in average using the ImageJ quantitative image analysis tools
3.1.4 Phases detected on the samples
Figure 8 shows the XRD spectra of the nCaP-coated MgY samples, non-coated MgY_O, and nCaP particles used for coating deposition. The XRD results indicated that the nCaP coating deposited on MgY samples by TPA consisted of mostly HA phase with a theoretical Ca/P molar ratio of 1.67, and some peaks of ocatacalcium phosphate (OCP, Ca8H2(PO4)6·5H2O)—another derivative phase of calcium phosphate with a theoretical Ca/P molar ratio of 1.33, as well as amorphous phase. The presence of phases other than HA explained the slightly lower Ca/P ratios in the coatings as quantified by EDS. The nCaP coatings on Mg substrates were analyzed previously using XRD [25], which also showed the presence of mostly HA phase with some OCP peaks and amorphous phase. Non-coated MgY_O showed the peaks of Mg and Y2O3, as expected (Fig. 8c). The nCaP particles were mainly composed of HA phase (Fig. 8d). OCP is structurally similar to HA, highly osteoconductive, biodegradable in the body through direct resorption by osteoclast-like cells, and a possible precursor of bone apatite crystals [43]. Sintered stoichiometric HA with a Ca/P molar ratio of 1.67 is generally considered as non-resorbable [44], and becomes resorbable if its crystal approaches a nano-scale size [45]. Biological apatite and Ca-deficient HA with a lower Ca/P molar ratio, have higher solubility than sintered HA [44]. HA has the most stable calcium phosphate phase at a neutral pH, followed by β-tricalcium phosphate, OCP, dicalcium phosphate (DCP) and dicalcium phosphate dihydrate (DCPD) [43]. Moreover, OCP stimulated the osteoblastic cell lineage to enhance bone formation, likely through apatite formation and through its conversion process to HA [46]. OCP tends to convert to HA not only in vitro, but also as an implant material in bone defects in vivo [43]. Evidence also suggested that OCP performed better than other calcium phosphates in vivo. Thus, it might be even beneficial for the nCaP-coated Mg-based implants to have both OCP and HA phases.
Fig. 8.
XRD spectra of a nCaP-coated MgY_P (red), b nCaP-coated MgY_O (blue), c non-coated MgY_O (orange), and d nCaP particles used for coating deposition (black) (Color figure online)
The differences in the surface chemistry and microstructure of MgY_P, MgY_O, and Mg substrates might have contributed to the differences in the XRD spectra of the deposited nCaP coatings on different substrates, since the TPA coating process parameters were the same for all the nCaP coatings deposited and the coating materials from the same vendor were used. Even if the coated samples had the same phases and crystal structures as the source coating material, relative peak intensity might be different due to the presence of preferential crystal orientation, residual stress, and crystal defects in different samples. In addition to altering peak intensity, preferential orientation of crystals in solid may even make certain peaks invisible after coating deposition, when compared with the powder diffraction spectrum of the source nCaP particles (Fig. 8d). It is also possible that the source nCaP particles were slightly different from batch to batch, although they were procured from the same vendor. Residual stress after coating deposition may shift the diffraction peak position when the strain is uniform and may change the peak shape when the strain is non-uniform. Different surface chemistry and microstructure of MgY_P and MgY_O substrates might have induced different interactions with the coating material, which could cause different crystal defects and preferential orientation of certain crystals, thus leading to the changes in XRD spectra. Therefore, it is possible that the surface chemistry/microstructure of substrates, preferential orientation of crystals, residual stress, and crystal defects after coating deposition, all played important roles in the differences observed in the XRD spectra.
3.1.5 Discussion on the nCaP coatings
The nCaP coatings deposited by the TPA process covered the Mg and MgY substrates uniformly without any cracks, indicating the success of the TPA process for depositing nCaP particles onto Mg-based substrates. The nCaP coatings deposited onto Mg substrates by the TPA process showed more homogenous microstructures when compared with the CaP coatings deposited onto Mg by immersion in concentrated simulated body fluid (SBF) [24]. The TPA process provided a promising approach for depositing nCaP coatings onto Mg-based biodegradable implants for dual purposes of mediating Mg degradation and promoting osteointegration, and thus should be further studied for potential clinical translation.
3.2 BMSC adhesion and sample degradation induced pH and mass change
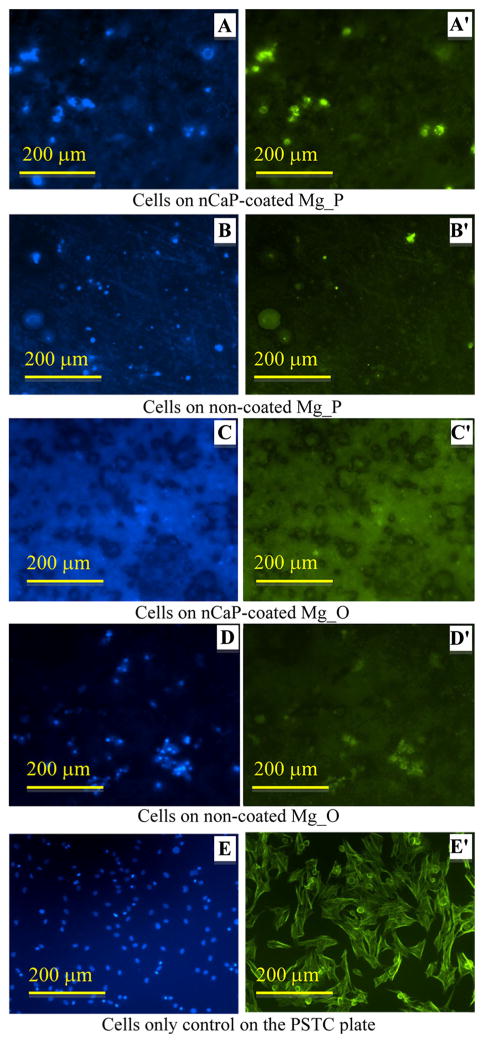
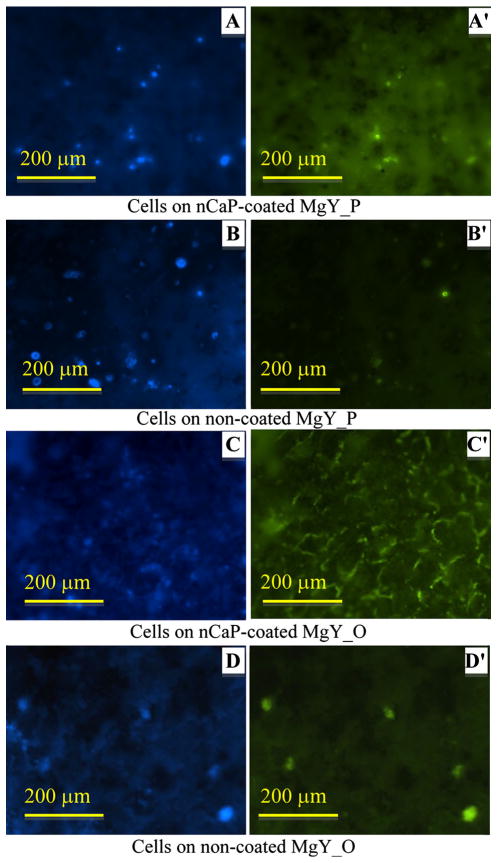
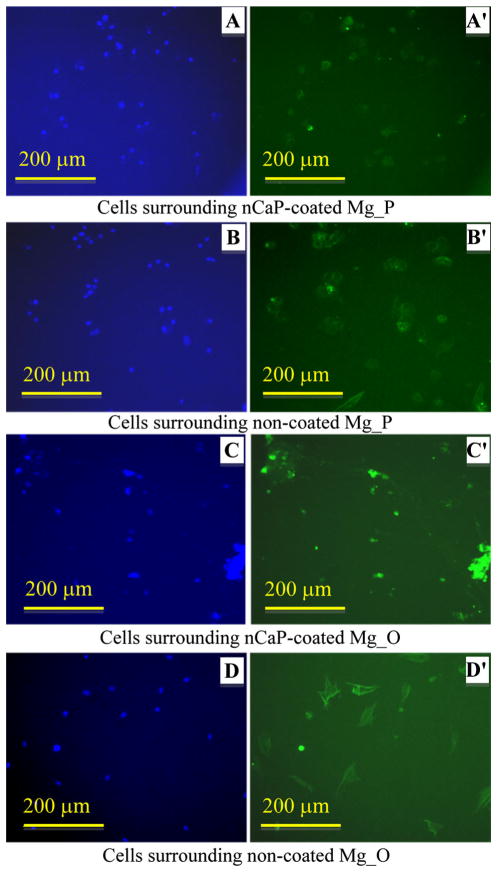
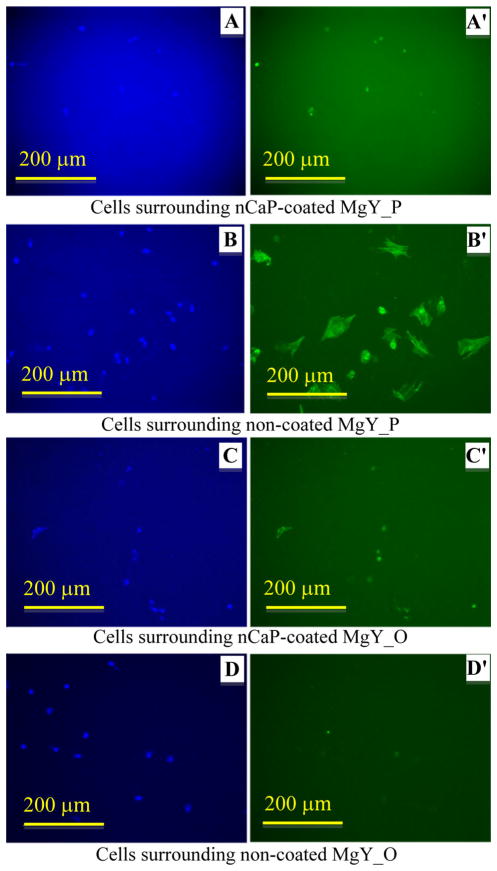
Fluorescence images of BMSCs after direct culture with the Mg-based samples are shown in Figs. 9, 10, 11 and 12. BMSCs directly adhered on the surfaces of Mg-based samples were called direct adhesion (Figs. 9, 10), while those adhered on the PSTC plate surface surrounding the samples were called indirect adhesion or indirect contact (Figs. 11, 12). The BMSCs directly on the nCaP-coated and non-coated Mg_P, Mg_O, MgY_P, and MgY_O sample surfaces appeared rounded in shape (Figs. 9, 10), while the cells only control on the PSTC plates (Fig. 9e′) showed their normal spindle-shaped morphology. The BMSCs on the PSTC plate surface surrounding the nCaP-coated and non-coated Mg_P (Fig. 11a′, b′) and MgY_O (Fig. 12c′, d′) samples appeared rounded in shape, as well as the BMSCs surrounding the nCaP-coated Mg_O (Fig. 11c′) and MgY_P samples (Fig. 12a′). Some BMSCs around the non-coated Mg_O and MgY_P samples retained normal spindle shaped morphology (Figs. 11d′, 12b′, respectively). In general, the majority of BMSCs showed morphological changes when cultured with Mg and MgY samples as compared with the cells only control without any samples.
Fig. 9.
BMSC adhesion on the nCaP-coated and non-coated Mg_P and Mg_O samples after 24 h of culture. a–e DAPI stained nuclei and a′–e′ Alexa Flour® 488 stained cytoskeleton of BMSCs. Fluorescence images of BMSC adhesion on the a, a′ nCaP-coated and b, b′ non-coated Mg_P samples, c, c′ nCaP-coated and d, d′ non-coated Mg_O samples, and e, e′ the cells only control on the PSTC plate without samples. Scale bar 200 μm
Fig. 10.
BMSC adhesion on the nCaP-coated and non-coated MgY_P and MgY_O samples after 24 h of culture. a–d DAPI stained nuclei and a′–d′ Alexa Flour® 488 stained cytoskeleton of BMSCs. Fluorescence images of BMSC adhesion on the a, a′ nCaP-coated and b, b′ non-coated MgY_P samples, and c, c′ nCaP-coated and d, d′ non-coated MgY_O samples. Scale bar 200 μm
Fig. 11.
BMSC adhesion on the PSTC plate surrounding the nCaP-coated and non-coated Mg_P and Mg_O samples after 24 h of culture. a–d DAPI stained nuclei and a′–d′ Alexa Flour® 488 stained cytoskeleton of BMSCs. Fluorescence images of BMSC adhesion on the PSTC plate surrounding the a, a′ nCaP-coated and b, b′ non-coated Mg_P samples, and c, c′ nCaP-coated and d, d′ non-coated Mg_O samples. Scale bar 200 μm
Fig. 12.
BMSC adhesion on the PSTC plate surrounding the nCaP-coated and non-coated MgY_P and MgY_O samples after 24 h of culture. a–d DAPI stained nuclei and a′–d′ Alexa Flour® 488 stained cytoskeleton of BMSCs. Fluorescence images of BMSC adhesion on the PSTC plate surrounding the a, a′ nCaP-coated and b, b′ non-coated MgY_P samples, and c, c′ nCaP-coated and d, d′ non-coated MgY_O samples. Scale bar 200 μm
The calculated direct adhesion density of the BMSCs on the nCaP-coated and non-coated Mg_P, non-coated Mg_O, nCaP-coated and non-coated MgY_P, and nCaP-coated MgY_O surfaces revealed no statistically significant differences when compared with the cells only control without samples, after 24-h culture, as shown in Fig. 13. The two exceptions that showed significantly lower direct cell adhesion density than the cells only control were nCaP-coated Mg_O and non-coated MgY_O. For indirect adhesion of BMSCs, in contrast, all Mg-based samples showed significantly less BMSCs adhered surrounding each of them when compared with the cells only control. The cells only control on the PSTC plate showed a greater mean adhesion density and a larger deviation. The percentages labeled on the top of each bar graph represented the percentage of BMSC adhesion density at 24-h culture over initial seeding density. More than 100 % of BMSCs adhered to the PSTC plate of the cell only control indicated cell proliferation, with a large deviation due to heterogeneous cell adhesion.
Fig. 13.
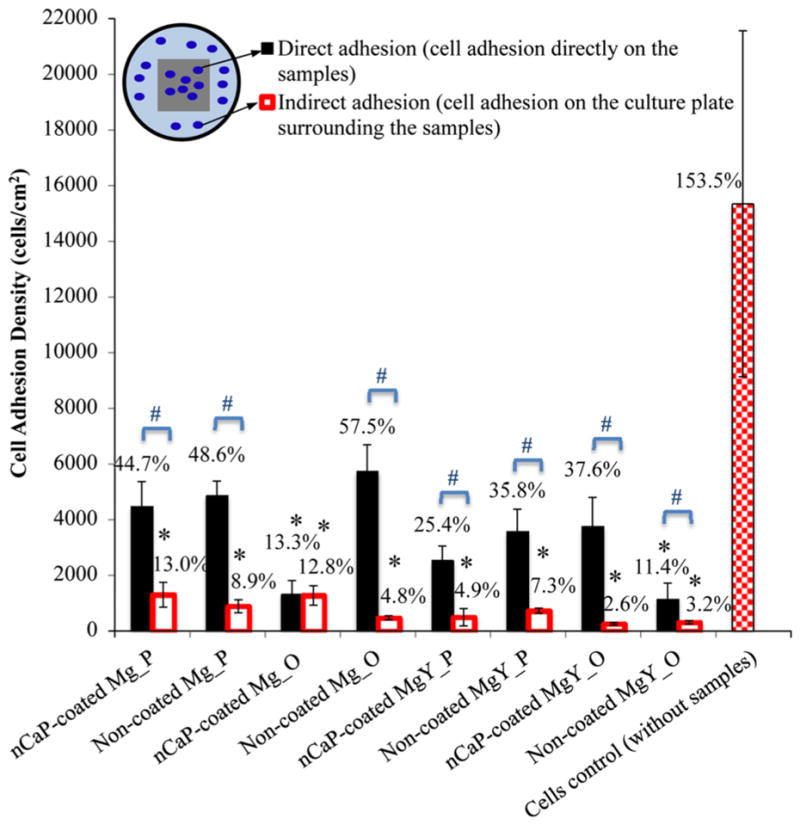
Adhesion density of BMSCs directly on the nCaP-coated and non-coated Mg_P, Mg_O, MgY_P, and MgY_O samples, on the PSTC plate surrounding the samples (indirect contact with the samples), and the cells only control on the PSTC plate without any samples, after 24 h of culture. The percentages labeled on the top of each bar were calculated by dividing the cell adhesion density by the initial seeding density. Values are mean ± standard deviation. *P < 0.05 compared with the cells only control without any samples. #P < 0.05 compared the direct adhesion on the sample surface with indirect adhesion surrounding the same respective sample
When comparing the direct adhesion and indirect adhesion, all except nCaP-coated Mg_O showed greater direct adhesion than indirect adhesion of BMSCs. These results indicated that the BMSCs preferred to attach onto these sample surfaces instead of the PSTC in the same culture, except in the cultures with nCaP-coated Mg_O that showed similar direct and indirect adhesion. Specifically, the nCaP coating on the Mg_P, MgY_P, and MgY_O provided better surfaces for cell adhesion than the PSTC plate surface in the same culture. Non-coated Mg_P, Mg_O, MgY_P, and MgY_O also provided better surfaces for cell adhesion than the PSTC plate surface in the same culture. These results were in general agreement with the evidences in literature that nCaP and Mg-based surfaces are osteoconductive [31, 47, 48]. When comparing the nCaP-coated Mg_P and MgY_P with their non-coated counterparts, the coating did not induce any sig-nificant changes for direct and indirect cell adhesion. However, when comparing the nCaP-coated Mg_O and MgY_O with their non-coated counterparts, the nCaP coating did induce different changes on cell adhesion. Specifically, the nCaP coating reduced direct cell adhesion but increased indirect cell adhesion for Mg_O. For MgY_O, the nCaP coating was beneficial for direct adhesion of BMSCs, but not for indirect adhesion. When comparing all samples, non-coated MgY_O showed the least cell density for direct adhesion, while nCaP-coated and non-coated MgY_O samples showed the least cell density for indirect adhesion. When the substrate, e.g., MgY_O, degraded in DMEM too rapidly [4, 35], the nCaP coating alone may not be effective in improving BMSC response, suggesting the substrate composition and surface are also important. Previous studies showed that MgY_O degraded the fastest as compared with Mg_P, Mg_O and MgY_P in DMEM [4, 35]. In addition to the surface factor affecting cell adhesion, degradation is another important factor to consider. The degradation rate from the fastest to the slowest followed this trend: MgY_O > MgY_P > (Mg_P, Mg_O) [4, 35].
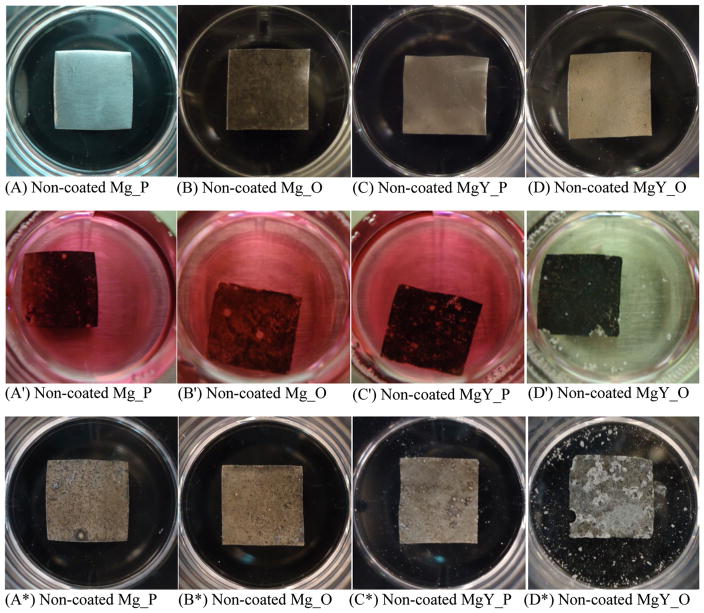
After 24-h culture in the DMEM, increased precipitation was observed on the surfaces of the nCaP-coated Mg_P, Mg_O, and MgY_P samples (Fig. 14a*–c*) when compared with the non-coated Mg_P, Mg_O, and MgY_P samples (Fig. 15a*–c*). Obvious degradation was observed on the edges of both nCaP-coated and non-coated MgY_O samples (Figs. 14d*, 15d*, respectively), and the non-coated MgY_O (Fig. 15d*) showed the most obvious degradation and precipitates of white particles on and surrounding the sample. No visible change in media color was observed surrounding the nCaP-coated and non-coated Mg_P, Mg_O and MgY_P samples after 24 h of culture (Fig. 14a′–c′ and Fig. 15a′–c′, respectively). However, the media surrounding the nCaP-coated and non-coated MgY_O samples turned clear (Figs. 14d′, 15d′, respectively), indicating unhealthy alkalinity due to rapid sample degradation. Gas bubbles were observed in the media after 24 h of culture with all samples, although the amount of gas bubbles varied for different samples.
Fig. 14.
Photographs of the nCaP-coated Mg_P, Mg_O, MgY_P, and MgY_O samples before and after 24 h of BMSC culture in Dulbecco’s modified Eagle medium (DMEM) supplemented with 10 % fetal bovine serum (FBS) and 1 % penicillin–streptomycin (P/S). a, b, c, d are the samples before culture. a′, b′, c′, d′ are the respective samples after 24 h of culture in the media. a*, b*, c*, d* are the dried respective samples after 24 h of culture
Fig. 15.
Photographs of the non-coated Mg_P, Mg_O, MgY_P, and MgY_O samples before and after 24 h of BMSC culture in Dulbecco’s modified Eagle medium (DMEM) supplemented with 10 % fetal bovine serum (FBS) and 1 % penicillin–streptomycin (P/S). a, b, c, d are the samples before culture. a′, b′, c′, d′ are the respective samples after 24 h of culture in the media. a*, b*, c*, d* are the dried respective samples after 24 h of culture
As compared with the cells only control without samples, the DMEM culture with the nCaP-coated and non-coated Mg and MgY samples all showed a significant increase in pH (Fig. 16). This is due to Mg degradation in media, which reacts with water to form OH− ions that consequently increase alkalinity. A decrease in pH was observed in the control cultured with the BMSCs only as compared with the DMEM alone without cells and Mg-based samples (Fig. 16). The decrease in pH is due to acid metabolites released by cells during cellular metabolism. The media cultured with the nCaP-coated and non-coated Mg and MgY samples ranged from 8.18 to 8.42, with the highest pH for non-coated MgY_O. Among all the nCaP-coated samples, Mg_O showed the highest pH. For Mg_P and MgY_O, nCaP-coated samples showed a lower pH than the non-coated counterparts. In contrast, for Mg_O and MgY_P, nCaP-coated samples induced a higher pH than the non-coated counterparts. The effects of nCaP coating on the media pH varied depending on the substrate composition (Mg versus MgY) and the substrate surface conditions (polished metallic surface versus oxidized surface).
Fig. 16.
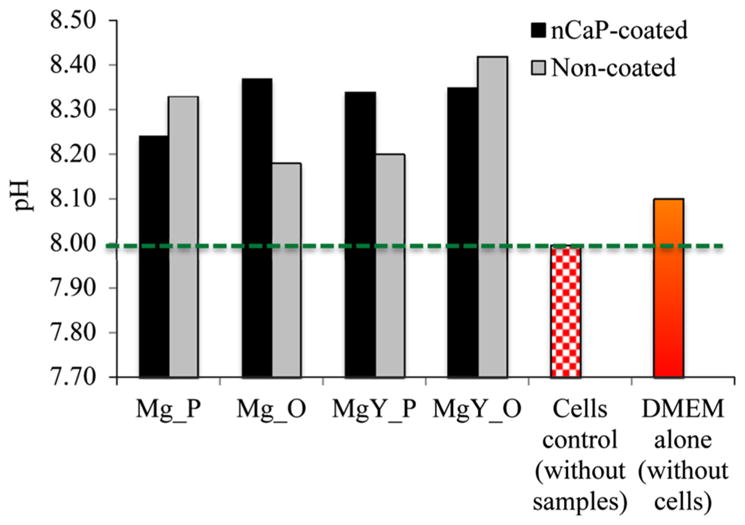
The pH of the cell culture media after 24 h of culture with the nCaP-coated and non-coated Mg_P, Mg_O, MgY_P, and MgY_O samples in comparison with the cells only control without any samples and the DMEM only control without any cells and samples
All except non-coated Mg_P showed mass gain after 24 h of cell culture, as shown in Fig. 17. The mass gain is due to accumulation of insoluble degradation products on sample surface and salt precipitation from the media. Among all the samples, non-coated MgY_O that induced the highest pH showed the greatest mass gain. Among all the nCaP-coated samples, MgY_P showed the greatest mass gain. For Mg_P and MgY_P, nCaP-coated samples showed more mass gain than their non-coated counterparts. For Mg_O and MgY_O, however, nCaP-coated samples showed less mass gain than their nCaP-coated counterparts. The nCaP coating seemed to promote mass gain for the samples with polished surfaces and reduce mass gain for the samples with oxidized surfaces. This tendency was more pronounced for MgY than for Mg.
Fig. 17.
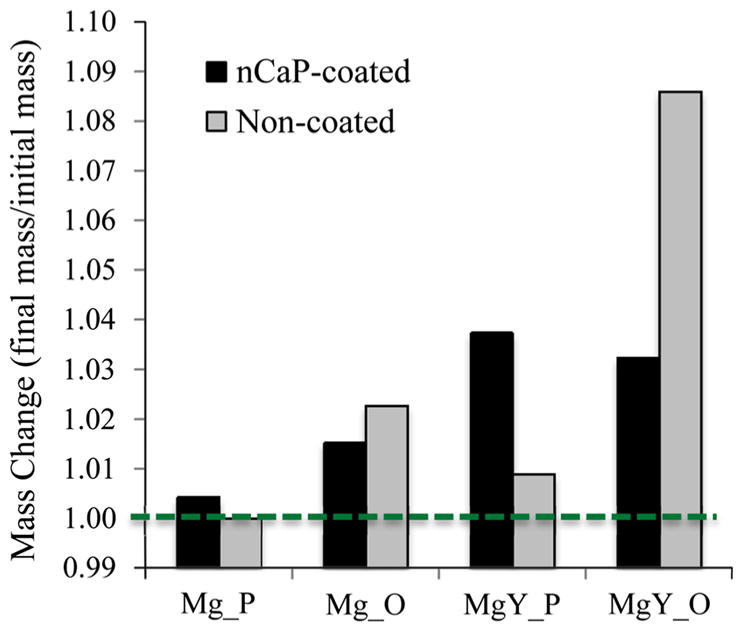
The mass change of nCaP-coated and non-coated Mg_P, Mg_O, MgY_P, and MgY_O samples after 24 h of culture. The mass change is calculated as final mass of each sample divided by its respective initial mass
3.3 Possible factors affecting BMSC adhesion
The possible factors affecting BMSC direct and indirect adhesion include the presence versus absence of nCaP coating, the Mg versus MgY substrates, the polished metallic versus oxidized substrate surfaces, and their combined effects on the sample degradation. For direct adhesion of BMSCs on the sample surface, the effects of surface chemistry and topography might be more pronounced than the effects of composition change in media induced by Mg degradation and salt precipitation. For indirect adhesion of BMSCs surrounding the samples, the effects of media composition, such as OH− ions induced pH increase, might be more important. The rapid degradation might be one of the contributing factors to the significant reduction of BMSCs surrounding the MgY_O samples, which is in agreement with previous results [4].
The pH increase is one of the key indicators of Mg degradation. In this study, non-coated MgY_O that induced the highest pH also showed the least cell adhesion (direct and indirect combined). The pH increase might have contributed to the outcome of BMSC adhesion, but might not be the sole factor because Cipriano et al. reported that an increase of initial media pH to 9 did not affect BMSC adhesion and viability [42]. Nguyen et al. showed that an increase of initial media pH to 8.1 did not affect viability and adhesion of human embryonic stem cells [49]. Oscillating pH change in media, however, was previously reported to cause cell morphology change, specifically in fibroblasts and endothelial cells [50]. It is important to note that the BMSCs that adhered on the PSTC plate surrounding the nCaP-coated Mg_P and Mg_O samples exhibited an abnormal morphology (Fig. 11a′, c′). BMSCs with normal morphology were observed surrounding the non-coated Mg_O and MgY_P samples (Fig. 11d′ and Fig. 12b′, respectively). The media cultured with the non-coated Mg_O and MgY_P samples had the least pH increase as compared with the pH of the media cultured with all the other samples, which might explain the normal BMSC morphology observed surrounding these samples. This in vitro study was conducted in the first 24-h period to mimic the initial period of in vivo implantation. More extensive long-term in vivo studies are needed to elucidate the role of each factor on cell functions and tissue healing, including the role of nCaP coating, the role of substrate (Mg versus MgY), the role of substrate surface conditions (polished versus oxidized surfaces).
3.4 Discussion on the effects of nCaP-coated implants on bone regeneration
When placed in a rabbit model, CaP-coated Mg alloy implants showed enhanced new bone growth around the implant, and exhibited increased osteoconductivity and osteogenesis compared to non-coated Mg alloys [18]. Importantly, improved cell response has been observed on materials with nano-surface morphology [37, 38, 51]. Nano-topography was reported to influence cellular adherence, migration, proliferation, and differentiation [51]. Nanostructured HA coated implants were found to promote osteointegration and bone bonding strength with the implant in an in vivo study in rats [52, 53]. Clearly, CaP coatings and nano-topography can improve bone formation. Trabecular bone is composed of HA minerals of 30–120 nm in diameter [54]. The most frequent particle size for all the nCaP-coated Mg and MgY samples used in this study ranged approximately between 200 and 500 nm in the long axis and 100–300 nm in short axis. The implant surface that mimics the nanostructures in natural bone enhances bone tissue regeneration. Therefore, it is expected that nCaP coatings with surface feature size in the range of natural bone should enhance bone cell adhesion. However, more variables affecting cell responses (e.g. pH and degradation rate) were induced for Mg and Mg alloy substrates due to their biodegradability. Moreover, the corners of Mg and MgY samples were not fully covered by the nCaP coating due to the fixture used in the TPA process, as shown in Fig. 14a–d, which certainly played a role in Mg degradation and cell response. Therefore, further studies are still needed to improve edge coverage with the coating and address all contributing factors to cell responses.
4 Conclusions
The nanostructured calcium phosphate (nCaP) coatings were successfully deposited onto Mg and MgY alloy substrates using the transonic particle acceleration (TPA) process. The deposited nCaP coatings showed a homogeneous particulate surface with the dominant feature size of 200–500 nm in the long axis and 100–300 nm in the short axis, and a Ca/P atomic ratio of 1.5–1.6. The modulatory effects of nCaP coatings on the sample degradation and BMSC behaviors were dependent on the substrate composition and surface conditions. This study demonstrated that multiple factors influenced BMSC direct and indirect adhesion, including the presence versus absence of nCaP coating, the Mg versus MgY substrates, the polished metallic versus oxidized substrate surfaces, and their combined effects on the sample degradation. The results indicated that the alkaline pH, the indicator of Mg degradation, played a role in BMSC adhesion and morphology, but not the sole factor. Significant differences detected between direct and indirect adhesion of BMSCs suggested that sample surface composition and topography might be as important as the degradation-induced changes in media composition. Additional studies are necessary to elucidate BMSC responses to each contributing factor.
Acknowledgments
The authors would like to thank the NSF BRIGE award (CBET 1125801), NIH/NIDCR SBIR award (6 R43 DE023287-02), and the University of California Regents Faculty Fellowship (H.L.) for financial support. We would also like to thank Dr. Krassimir Bozhilov at the Central Facility for Advanced Microscopy and Microanalysis (CFAMM) for the SEM training at the University of California, Riverside.
References
- 1.Staiger MP, Pietak AM, Huadmai J, Dias G. Magnesium and its alloys as orthopedic biomaterials: a review. Biomaterials. 2006;27:1728–34. doi: 10.1016/j.biomaterials.2005.10.003. [DOI] [PubMed] [Google Scholar]
- 2.Reifenrath J, Bormann D, Meyer-Lindenberg A. Magnesium alloys as promising degradable implant materials in orthopedic research. In: Czerwinski F, editor. Magnesium alloys—corrosion and surface treatments. Rijeka: Intech; 2011. pp. 94–108. [Google Scholar]
- 3.Seal CK, Vince K, Hodgson MA. Biodegradable surgical implants based on magnesium alloys: a review of current research. IOP Conf Ser. 2009;4:1–4. [Google Scholar]
- 4.Johnson I, Perchy D, Liu H. In vitro evaluation of the surface effects on magnesiumyttrium alloy degradation and mesenchymal stem cell adhesion. J Biomed Mater Res A. 2011;100A:477–85. doi: 10.1002/jbm.a.33290. [DOI] [PubMed] [Google Scholar]
- 5.Witte F, Ulrich H, Palm C, Willbold E. Biodegradable magnesium scaffolds: part II: peri-implant bone remodeling. J Biomed Mater Res A. 2007;81:757–65. doi: 10.1002/jbm.a.31293. [DOI] [PubMed] [Google Scholar]
- 6.Guangling S. Control of biodegradation of biocompatible magnesium alloys. Corros Sci. 2007;49:1696–701. [Google Scholar]
- 7.Song GL, Atrens A. Corrosion mechanisms of magnesium alloys. Adv Eng Mater. 1999;1:11–33. [Google Scholar]
- 8.Song GL, Atrens A. Understanding magnesium corrosion—a framework for improved alloy performance. Adv Eng Mater. 2003;5:837–58. [Google Scholar]
- 9.Lock JY, Wyatt E, Upadhyayula S, Whall A, Nuñez V, Vullev VI, et al. Degradation and antibacterial properties of magnesium alloys in artificial urine for potential resorbable ureteral stent applications. J Biomed Mater Res Part A. 2014;102:781–92. doi: 10.1002/jbm.a.34741. [DOI] [PubMed] [Google Scholar]
- 10.Xin YC, Huo KF, Tao H, Tang GY, Chu PK. Influence of aggressive ions on the degradation behavior of biomedical magnesium alloy in physiological environment. Acta Biomater. 2008;4:2008–15. doi: 10.1016/j.actbio.2008.05.014. [DOI] [PubMed] [Google Scholar]
- 11.Mueller W-D, Fernandez Lorenzo de Mele M, Nascimento ML, Zeddies M. Degradation of magnesium and its alloys: dependence on the composition of the synthetic biological media. J Biomed Mater Res Part A. 2009;90A:487–95. doi: 10.1002/jbm.a.32106. [DOI] [PubMed] [Google Scholar]
- 12.Yun Y, Dong ZY, Yang DE, Schulz MJ, Shanov VN, Yarmolenko S, et al. Biodegradable Mg corrosion and osteoblast cell culture studies. Mat Sci Eng C. 2009;29:1814–21. [Google Scholar]
- 13.Song GL. Recent progress in corrosion and protection of magnesium alloys. Adv Eng Mater. 2005;7:563–86. [Google Scholar]
- 14.Johnson I, Liu H. A study on factors affecting the degradation of magnesium and a magnesiumyttrium alloy for biomedical applications. PLoS One. 2013;8:e65603. doi: 10.1371/journal.pone.0065603. [DOI] [PMC free article] [PubMed] [Google Scholar]
- 15.Song YW, Shan DY, Chen RS, Zhang F, Han EH. Biodegradable behaviors of AZ31 magnesium alloy in simulated body fluid. Mater Sci Eng, C. 2009;29:1039–45. [Google Scholar]
- 16.Wong HM, Yeung KWK, Lam KO, Tam V, Chu PK, Luk KDK, et al. A biodegradable polymer-based coating to control the performance of magnesium alloy orthopaedic implants. Biomaterials. 2010;31:2084–96. doi: 10.1016/j.biomaterials.2009.11.111. [DOI] [PubMed] [Google Scholar]
- 17.Yun YH, Dong ZY, Lee N, Liu YJ, Xue DC, Guo XF, et al. Revolutionizing biodegradable metals. Mater Today. 2009;12:22–32. [Google Scholar]
- 18.Xu LP, Pan F, Yu GN, Yang L, Zhang EL, Yang K. In vitro and in vivo evaluation of the surface bioactivity of a calcium phosphate coated magnesium alloy. Biomaterials. 2009;30:1512–23. doi: 10.1016/j.biomaterials.2008.12.001. [DOI] [PubMed] [Google Scholar]
- 19.Gray-Munro JE, Seguin C, Strong M. Influence of surface modification on the in vitro corrosion rate of magnesium alloy AZ31. J Biomed Mater Res Part A. 2009;91A:221–30. doi: 10.1002/jbm.a.32205. [DOI] [PubMed] [Google Scholar]
- 20.Yao HB, Li Y, Wee ATS. Passivity behavior of meltspun Mg-Y alloys. Electrochim Acta. 2003;48:4197–204. [Google Scholar]
- 21.Socjusz-Podosek M, Litynska L. Effect of yttrium on structure and mechanical properties of Mg alloys. Mater Chem Phys. 2003;80:472–5. [Google Scholar]
- 22.Aghion E, Gueta Y, Moscovitch N, Bronfin B. Effect of yttrium additions on the properties of grain-refined Mg-3%Nd alloy. J Mater Sci. 2008;43:4870–5. [Google Scholar]
- 23.Wu BL, Zhao YH, Du XH, Zhang YD, Wagner F, Esling C. Ductility enhancement of extruded magnesium via yttrium addition. Mat Sci Eng A. 2010;527:4334–40. [Google Scholar]
- 24.Johnson I, Akari K, Liu H. Nanostructured hydroxyapatite/poly(lactic-co-glycolic acid) composite coating for controlling magnesium degradation in simulated body fluid. Nanotechnology. 2013;24:375103. doi: 10.1088/0957-4484/24/37/375103. [DOI] [PubMed] [Google Scholar]
- 25.Iskandar ME, Aslani A, Liu H. The effects of nanostructured hydroxyapatite coating on the biodegradation and cytocompatibility of magnesium implants. J Biomed Mater Res Part A. 2013;101A:2340–54. doi: 10.1002/jbm.a.34530. [DOI] [PubMed] [Google Scholar]
- 26.Cui W, Beniash E, Gawalt E, Xu Z, Sfeir C. Biomimetic coating of magnesium alloy for enhanced corrosion resistance and calcium phosphate deposition. Acta Biomater. 2013;9:8650–9. doi: 10.1016/j.actbio.2013.06.031. [DOI] [PubMed] [Google Scholar]
- 27.Wong HM, Yeung KW, Lam KO, Tam V, Chu PK, Luk KD, et al. A biodegradable polymer-based coating to control the performance of magnesium alloy orthopaedic implants. Biomaterials. 2010;31:2084–96. doi: 10.1016/j.biomaterials.2009.11.111. [DOI] [PubMed] [Google Scholar]
- 28.Sebaa MA, Dhillon S, Liu H. Electrochemical deposition and evaluation of electrically conductive polymer coating on biodegradable magnesium implants for neural applications. J Mater Sci Mater Med. 2013;24:307–16. doi: 10.1007/s10856-012-4796-y. [DOI] [PubMed] [Google Scholar]
- 29.Sebaa M, Nguyen TY, Dhillon S, Garcia S, Liu H. The effects of poly(3,4-ethylenedioxythiophene) coating on magnesium degradation and cytocompatibility with human embryonic stem cells for potential neural applications. J Biomed Mater Res A. 2015;103:25–37. doi: 10.1002/jbm.a.35142. [DOI] [PubMed] [Google Scholar]
- 30.Song Y, Zhang SX, Li JA, Zhao CL, Zhang XN. Electrodeposition of Ca-P coatings on biodegradable Mg alloy: in vitro biomineralization behavior. Acta Biomater. 2010;6:1736–42. doi: 10.1016/j.actbio.2009.12.020. [DOI] [PubMed] [Google Scholar]
- 31.Liu H, Yazici H, Ergun C, Webster TJ, Bermek H. An in vitro evaluation of the Ca/P ratio for the cytocompatibility of nano-to-micron particulate calcium phosphates for bone regeneration. Acta Biomater. 2008;4:1472–9. doi: 10.1016/j.actbio.2008.02.025. [DOI] [PubMed] [Google Scholar]
- 32.Yang C. Effect of calcium phosphate surface coating on bone ingrowth onto porous-surfaced titanium alloy implants in rabbit tibiae. J Oral Maxillofac Surg. 2002;60:422–5. doi: 10.1053/joms.2002.31230. discussion 6. [DOI] [PubMed] [Google Scholar]
- 33.de Groot K, Wolke JG, Jansen JA. Calcium phosphate coatings for medical implants. Proc Inst Mech Eng H. 1998;212:137–47. doi: 10.1243/0954411981533917. [DOI] [PubMed] [Google Scholar]
- 34.Shadanbaz S, Dias GJ. Calcium phosphate coatings on magnesium alloys for biomedical applications: a review. Acta Biomater. 2012;8:20–30. doi: 10.1016/j.actbio.2011.10.016. [DOI] [PubMed] [Google Scholar]
- 35.Webster TJ, Ahn ES. Tissue engineering II: basics of tissue engineering and tissue applications. Berlin: Springer; 2007. Nanostructured biomaterials for tissue engineering bone; pp. 275–308. [DOI] [PubMed] [Google Scholar]
- 36.Kim HW, Kim HE, Salih V. Stimulation of osteoblast responses to biomimetic nanocomposites of gelatin-hydroxyapatite for tissue engineering scaffolds. Biomaterials. 2005;26:5221–30. doi: 10.1016/j.biomaterials.2005.01.047. [DOI] [PubMed] [Google Scholar]
- 37.Webster TJ, Ergun C, Doremus RH, Siegel RW, Bizios R. Specific proteins mediate enhanced osteoblast adhesion on nanophase ceramics. J Biomed Mater Res. 2000;51:475–83. doi: 10.1002/1097-4636(20000905)51:3<475::aid-jbm23>3.0.co;2-9. [DOI] [PubMed] [Google Scholar]
- 38.Webster T, Ergun C, Doremus R, Siegel R, Bizios R. Enhanced functions of osteoblasts on nanophase ceramics. Biomaterials. 2000;21:1803–10. doi: 10.1016/s0142-9612(00)00075-2. [DOI] [PubMed] [Google Scholar]
- 39.Liao J, Hammerick KE, Challen GA, Goode MA, Kasper FK, Mikos AG. Investigating the role of hematopoietic stem and progenitor cells in regulating the osteogenic differentiation of mesenchymal stem cells in vitro. J Orthop Res. 2011;29:1544–53. doi: 10.1002/jor.21436. [DOI] [PMC free article] [PubMed] [Google Scholar]
- 40.Little MA, Kalkhoran NM, Aslani A, Tobin EJ, Burns JE. Process for depositing calcium phosphate therapeutic coatings with different release rates and a prosthesis coated via the process. Google Patents. 2011 [Google Scholar]
- 41.Liu H. The effects of surface and biomolecules on magnesium degradation and mesenchymal stem cell adhesion. J Biomed Mater Res Part A. 2011;99A:249–60. doi: 10.1002/jbm.a.33188. [DOI] [PubMed] [Google Scholar]
- 42.Cipriano AF, Sallee A, Guan RG, Zhao ZY, Tayoba M, Sanchez J, et al. Investigation of magnesium-zinc-calcium alloys and bone marrow derived mesenchymal stem cell response in direct culture. Acta Biomater. 2015;12:298–321. doi: 10.1016/j.actbio.2014.10.018. [DOI] [PubMed] [Google Scholar]
- 43.Suzuki O. Octacalcium phosphate: osteoconductivity and crystal chemistry. Acta Biomater. 2010;6:3379–87. doi: 10.1016/j.actbio.2010.04.002. [DOI] [PubMed] [Google Scholar]
- 44.LeGeros RZ. Properties of osteoconductive biomaterials: calcium phosphates. Clin Orthop Relat Res. 2002;395:81–98. doi: 10.1097/00003086-200202000-00009. [DOI] [PubMed] [Google Scholar]
- 45.Kikuchi M, Itoh S, Ichinose S, Shinomiya K, Tanaka J. Self-organization mechanism in a bone-like hydroxyapatite/collagen nanocomposite synthesized in vitro and its biological reaction in vivo. Biomaterials. 2001;22:1705–11. doi: 10.1016/s0142-9612(00)00305-7. [DOI] [PubMed] [Google Scholar]
- 46.Suzuki O, Kamakura S, Katagiri T, Nakamura M, Zhao BH, Honda Y, et al. Bone formation enhanced by implanted octa-calcium phosphate involving conversion into Ca-deficient hydroxyapatite. Biomaterials. 2006;27:2671–81. doi: 10.1016/j.biomaterials.2005.12.004. [DOI] [PubMed] [Google Scholar]
- 47.Galli S, Naito Y, Karlsson J, He W, Andersson M, Wennerberg A, et al. Osteoconductive potential of mesoporous titania implant surfaces loaded with magnesium: an experimental study in the rabbit. Clin Implant Dent Relat Res. 2014 doi: 10.1111/cid.12211. [DOI] [PubMed] [Google Scholar]
- 48.Lock J, Liu H. Nanomaterials enhance osteogenic differentiation of human mesenchymal stem cells similar to a short peptide of BMP-7. Int J Nanomedicine. 2011;6:2769–77. doi: 10.2147/IJN.S24493. [DOI] [PMC free article] [PubMed] [Google Scholar]
- 49.Nguyen TY, Liew CG, Liu H. An in vitro mechanism study on the proliferation and pluripotency of human embryonic stems cells in response to magnesium degradation. PLoS One. 2013;8:e76547. doi: 10.1371/journal.pone.0076547. [DOI] [PMC free article] [PubMed] [Google Scholar]
- 50.Lo CM, Keese CR, Giaever I. pH changes in pulsed CO2 incubators cause periodic changes in cell morphology. Exp Cell Res. 1994;213:391–7. doi: 10.1006/excr.1994.1214. [DOI] [PubMed] [Google Scholar]
- 51.Jager M, Zilkens C, Zanger K, Krauspe R. Significance of nano-and microtopography for cell-surface interactions in orthopaedic implants. J Biomed Biotechnol. 2007;8:69036. doi: 10.1155/2007/69036. [DOI] [PMC free article] [PubMed] [Google Scholar]
- 52.Cheng Z, Guo C, Dong W, He F-M, Zhao S-F, Yang G-L. Effect of thin nano-hydroxyapatite coating on implant osseointegration in ovariectomized rats. Oral Surg Oral Med Oral Pathol Oral Radiol. 2012;113:E48–53. doi: 10.1016/j.tripleo.2011.07.008. [DOI] [PubMed] [Google Scholar]
- 53.Liu H, Webster TJ. Nanomedicine for implants: a review of studies and necessary experimental tools. Biomaterials. 2007;28:354–69. doi: 10.1016/j.biomaterials.2006.08.049. [DOI] [PubMed] [Google Scholar]
- 54.Gayathri BPK. Macrophage and osteoblast response to micro and nano hydroxyapatite—a review. Nano Vis. 2011;1:1–53. [Google Scholar]


