

Abstract
Aims
To determine the effects of empagliflozin on blood pressure (BP) and markers of arterial stiffness and vascular resistance in patients with type 2 diabetes mellitus (T2DM).
Methods
We conducted a post hoc analysis of data from a phase III trial in patients with T2DM and hypertension receiving 12 weeks' empagliflozin and four phase III trials in patients with T2DM receiving 24 weeks' empagliflozin (cohort 1, n = 823; cohort 2, n = 2477). BP was measured using 24‐h BP monitoring (cohort 1) or seated office measurements (cohort 2).
Results
Empagliflozin reduced systolic BP (SBP) and diastolic BP in both cohorts (p < 0.001 vs placebo), without increasing heart rate. Empagliflozin reduced pulse pressure (PP; adjusted mean difference vs placebo cohort 1: −2.3 mmHg; cohort 2: −2.3 mmHg), mean arterial pressure (MAP; cohort 1, −2.3 mmHg; cohort 2, −2.1 mmHg) and double product (cohort 1, −385 mmHg × bpm; cohort 2, −369 mmHg × bpm) all p < 0.001 vs placebo. There was a trend towards a reduction in the ambulatory arterial stiffness index (AASI) with empagliflozin in cohort 1 (p = 0.059 vs placebo). AASI was not measured in cohort 2. Subgroup analyses showed that there were greater reductions in PP with increasing baseline SBP in cohort 1 (p = 0.092). In cohort 2, greater reductions in MAP were achieved in patients with higher baseline SBP (p = 0.027) and greater reductions in PP were observed in older patients (p = 0.011).
Conclusions
Empagliflozin reduced BP and had favourable effects on markers of arterial stiffness and vascular resistance.
Keywords: cardiovascular disease, phase III study, SGLT2 inhibitor, type 2 diabetes
Introduction
Cardiovascular (CV) disease is the major cause of morbidity and mortality in patients with type 2 diabetes (T2DM) 1. The risk of CV disease in adults with diabetes is double that in adults without diabetes, and diabetes is estimated to account for 10–12% of all vascular deaths 2. Patients with T2DM often have numerous CV risk factors and a multifactorial approach to addressing CV risk, including controlling glycaemia, blood pressure (BP) and body weight, is recommended in these patients 1, 3.
The metabolic abnormalities that are characteristic of diabetes, such as hyperglycaemia, excess free fatty acids and insulin resistance, can lead to suppression of nitric oxide production and activation of the renin‐angiotensin system, leading to oxidative stress, endothelial dysfunction and activation of the receptor for advanced glycation end products (RAGE) 4, 5, 6. These may contribute to hypertension 7 or to increased arterial stiffness related to vascular calcification or accumulation of collagen 8, 9 that could partly explain the increased risk of vascular complications associated with T2DM 4.
Arterial stiffness is a strong predictor of CV events, heart failure and death 10, 11, 12. Although aortic pulse wave velocity is generally considered to be the ‘gold standard’ for non‐invasive assessments of arterial stiffness, in clinical practice, pulse pressure (PP) can be used as a surrogate marker. PP is determined by cardiac output and the stiffness of elastic central arteries, such as the aorta, and may be calculated as the difference between systolic BP (SBP) and diastolic BP (DBP) 13. Increased peripheral PP is an independent predictor of CV disease in patients with T2DM 14, 15, 16, and a meta‐analysis showed that the relative risks of CV events were similar for an increase in central SBP and central PP to those for their peripheral (brachial) counterparts 17. Another marker of arterial stiffness is the ambulatory arterial stiffness index [AASI: 1 minus the regression slope of DBP and SBP values derived from 24‐h ambulatory BP monitoring (ABPM) 18]. The AASI represents the dynamic relationship between SBP and DBP, as defined by haemodynamic arterio‐ventricular properties, and has been reported to be an independent predictor of CV mortality 19.
Mean arterial pressure (MAP) is a measure of central haemodynamics that reflects the cardiac cycle and is determined by cardiac output, systemic vascular resistance and central venous pressure. MAP is calculated as 2/3 DBP + 1/3 SBP 16 and has been shown to be predictive of CV events in patients with T2DM.
The myocardium's workload is related to vascular stiffness and cardiac function, and one variable that quantifies this is the double product (DP), also known as the rate pressure product (RPP). This is calculated as heart rate × SBP and provides an indirect measure of myocardial oxygen demand. Chronic elevations of DP, representing an increased cardiac load, may cause long‐term cardiac impairment and DP is associated with CV complications, CV mortality and non‐CV mortality 20, 21.
Empagliflozin is a potent and selective sodium glucose cotransporter 2 (SGLT2) inhibitor 22 used in the treatment of T2DM. In phase III trials, empagliflozin (10 and 25 mg) improved glycaemic control with a low risk of hypoglycaemia, and was associated with reductions in BP and body weight 23, 24, 25, 26, 27. In a 4‐week study in patients with T2DM, empagliflozin monotherapy reduced oxidative stress, as shown by reductions in 8‐iso‐prostaglandin2α, and also improved daily blood glucose control 28. Empagliflozin has been shown to have central haemodynamic effects: in patients with type 1 diabetes (T1DM), empagliflozin reduced arterial stiffness assessed by measurement of carotid‐radial pulse wave velocity and radial, carotid and aortic augmentation indices 29.
To determine the effects of empagliflozin on markers of arterial stiffness (PP and AASI) and arterial resistance (MAP) in patients with T2DM, we analysed data from five phase III studies. We also determined the effects of empagliflozin on indirect determinants of myocardial oxygen demand and hence the workload on the heart (heart rate, BP and DP). Further, we conducted subgroup analyses to test our hypothesis that empagliflozin would reduce BP, PP and MAP across subgroups defined by age, sex and degree of hypertension at baseline, with greater reductions in older patients and those with the highest SBP at baseline.
Methods
Study Design and Patients
Data from two cohorts of patients, one treated with empagliflozin for 12 weeks (cohort 1) and one treated with empagliflozin for 24 weeks (cohort 2), were analysed. Cohort 1 comprised patients from the EMPA‐REG BP™ trial 27. Patients had T2DM with hypertension (mean seated office SBP 130–159 mmHg and DBP 80–99 mmHg), glycated haemoglobin (HbA1c) ≥7 and ≤10% (≥53 and ≤86 mmol/mol) and a body mass index ≤45 kg/m2 at baseline. Patients were either drug‐naive [had not received any oral glucose‐lowering therapy, glucagon‐like peptide‐1 (GLP‐1) analogue, or insulin for ≥12 weeks (≥16 weeks for pioglitazone) before randomization] or had been receiving stable doses of glucose‐lowering therapy [oral agents or GLP‐1 analogue at doses unchanged for ≥12 weeks (≥16 weeks for pioglitazone) before randomization, or insulin at dose changed by ≤10% for ≥12 weeks before randomization] 27. Patients were required to have been receiving no, one or two BP‐lowering medications at a stable dose for ≥4 weeks at screening and throughout a 2‐week placebo run‐in period. Patients were randomized to receive empagliflozin 10 mg, empagliflozin 25 mg, or placebo once daily for 12 weeks. Patients underwent 24‐h ABPM ≤7 days before randomization and at week 12 27. During the treatment period, patients continued their background BP‐lowering therapy at an unchanged dose, but changes in BP‐lowering medication could be initiated if a patient had a mean SBP ≥160 mmHg and/or a mean DBP ≥100 mmHg at a clinic visit.
Cohort 2 comprised patients from the four pivotal trials of empagliflozin required for regulatory submissions: EMPA‐REG MONO™ 23, EMPA‐REG MET™ 24, EMPA‐REG METSU™ 25 and EMPA‐REG PIO™ 26. Patients in these trials had T2DM, HbA1c ≥7 and ≤10% (≥53 and ≤86 mmol/mol) and a body mass index ≤45 kg/m2. Patients in the EMPA‐REG MONO™ trial were drug‐naive (had not received glucose‐lowering therapy for ≥12 weeks before randomization) 23. Patients in the EMPA‐REG MET™ or EMPA‐REG METSU™ trials had received immediate‐release metformin [≥1500 mg/day, up to maximum tolerated dose (MTD) or maximum dose according to local label] unchanged for ≥12 weeks before randomization, or metformin plus a sulphonylurea (≥50% of MTD, up to the MTD or maximum dose according to local label) unchanged for ≥12 weeks before randomization, respectively 24, 25. Patients in the EMPA‐REG PIO™ trial had received pioglitazone (≥30 mg/day, up to MTD or maximum dose according to local label) unchanged for ≥12 weeks before randomization, with or without metformin immediate release (as described above) 26. In all four trials, patients were randomized to receive empagliflozin 10 mg, empagliflozin 25 mg, or placebo as monotherapy (EMPA‐REG MONO™) or add‐on to background therapy for 24 weeks.
Glucose‐lowering rescue medication could be initiated at the discretion of the investigator if, after an overnight fast, a patient had a confirmed plasma glucose level >13.3 mmol/l during the first 12 weeks of treatment or, in the 24‐week trials, >11.1 mmol/l [or HbA1c >8.5% (69 mmol/mol) in the EMPA‐REG MET™ and EMPA‐REG METSU™ studies] during weeks 12–24.
All studies were approved by the Institutional Review Boards and Independent Ethics Committees and Competent Authorities of the participating centres and complied with the Declaration of Helsinki in accordance with the International Conference on Harmonisation Harmonised Tripartite Guideline for Good Clinical Practice. All patients who participated in these studies provided written informed consent.
Endpoints and Measurements
In the present post hoc analysis, the following endpoints were analysed in cohort 1: changes from baseline in HbA1c and in 24‐h SBP and DBP, heart rate, PP, MAP, DP (or RPP) and AASI (based on 24‐h ABPM measurements) at week 12. The following endpoints were analysed in cohort 2: changes from baseline in HbA1c, seated office SBP and DBP, heart rate, PP, MAP and DP (or RPP) at week 24.
In both cohorts, changes from baseline in SBP, DBP, PP and MAP were analysed in subgroups of patients by baseline age (<50, 50 to <65, 65 to <75, ≥75 years), sex, and baseline SBP (<130, 130–140, >140 mmHg). PP was calculated as SBP – DBP (mmHg). MAP was calculated as 2/3 DBP + 1/3 SBP (mmHg). DP (or RPP) was calculated as heart rate (bpm) × SBP (mmHg). AASI was calculated as 1 minus the regression slope of DBP on SBP during 24‐h ABPM.
In light of the small/modest differences in the impact of empagliflozin 10 and 25 mg on reducing SBP and DBP 23, 24, 25, 26, 27, the two doses were pooled for the purpose of the present analyses.
Statistical Analyses
For each cohort, data from patients in the empagliflozin 10 mg and empagliflozin 25 mg groups were pooled. Changes from baseline in each cohort were analysed using an analysis of covariance (ancova) with baseline HbA1c and the baseline value of the endpoint in question (if not HbA1c) as linear covariates, and baseline estimated glomerular filtration rate (Modification of Diet in Renal Disease equation), region and treatment as fixed effects. The number of BP‐lowering medications at baseline was an additional fixed effect in analysis of data from cohort 1. In cohort 2, the individual study was an additional fixed effect when analysing the data. Changes from baseline in SBP, DBP, PP and MAP in subgroups of baseline age, sex and baseline SBP were analysed using the same ancova model, but including baseline age, sex and baseline SBP, respectively, as additional linear covariates and the corresponding treatment by subgroup of interest interaction. For cohort 1, baseline SBP was the baseline mean 24‐h SBP value. Analyses were conducted on the full analysis set (FAS). For cohort 1, the FAS comprised randomized patients who received ≥1 dose of study drug and had a baseline HbA1c value and a baseline mean 24‐h SBP value. For cohort 2, the FAS comprised randomized patients who received ≥1 dose of study drug and had a baseline HbA1c value. Values observed after initiation of glucose‐lowering rescue therapy were set to missing. A last observation carried forward (LOCF) approach was used to impute missing data. Statistical analyses were performed using % data for HbA1c.
Results
Patients
Of 825 patients randomized in the EMPA‐REG BP™ trial, 823 were included in the FAS for cohort 1 (empagliflozin: n = 552; placebo: n = 271). Of the 2482 patients randomized in the four 24‐week phase III trials, 2477 patients were included in the FAS for cohort 2 (empagliflozin: n = 1652; placebo: n = 825). In each cohort, patient demographics and baseline characteristics were generally balanced between treatment groups (Table S1).
Glycaemic Control
In both cohorts, empagliflozin significantly reduced HbA1c from baseline compared with placebo. In cohort 1, the adjusted mean ± standard error (s.e.) change from baseline in HbA1c at week 12 was 0.03 (± 0.04)% [0.3 (± 0.4) mmol/mol] with placebo compared with −0.61 (± 0.02)% [−6.7 (± 0.3) mmol/mol] with empagliflozin {adjusted mean difference vs placebo: −0.64% [95% confidence interval (CI) −0.72, −0.55] or −7.0 mmol/mol (95% CI −7.9, −6.0); p < 0.001}. In cohort 2, the adjusted mean (± s.e.) change from baseline in HbA1c at week 24 was −0.08 (± 0.03)% [−0.9 (± 0.3) mmol/mol] with placebo compared with −0.73 (± 0.02)% [−8.0 (± 0.2) mmol/mol] with empagliflozin [adjusted mean difference vs placebo: −0.65% (95% CI −0.71, −0.59) or −7.1 mmol/mol (95% CI −7.8, −6.4); p < 0.001]. The proportions of patients with imputed data for change from baseline in HbA1c in cohort 1 at week 12 were 10.3 and 9.6% for patients treated with empagliflozin and placebo, respectively, whereas in cohort 2, the corresponding figures at week 24 were 12.2 and 25.7%.
Blood Pressure and Heart Rate
In both cohorts, empagliflozin significantly reduced SBP and DBP from baseline compared with placebo. In cohort 1, the adjusted mean difference versus placebo in change from baseline in mean 24‐h SBP at week 12 was −3.9 mmHg (95% CI −5.0, −2.7; p < 0.001) and in mean 24‐h DBP was −1.5 mmHg (95% CI −2.2, −0.8; p < 0.001; Figure S1). In cohort 2, the adjusted mean difference versus placebo in change from baseline in SBP at week 24 was −3.6 mmHg (95% CI −4.5, −2.7; p < 0.001) and in DBP was −1.3 mmHg (95% CI −1.9, −0.8; p < 0.001; Figure S1). The adjusted mean difference versus placebo in change from baseline in mean 24‐h heart rate was −0.6 bpm (95% CI −1.4, 0.3; p = 0.209) in cohort 1 and −0.8 bpm (95% CI −1.4, −0.2; p = 0.012) in cohort 2 (Figure S1). The proportions of patients with imputed data for change from baseline in SBP in cohort 1 at week 12 were 12.7 and 13.3% for patients treated with empagliflozin and placebo, respectively, whereas in cohort 2, the corresponding figures at week 24 were 11.6 and 25.1%.
Markers of Arterial Stiffness and Vascular Resistance
Empagliflozin significantly (p < 0.001) reduced PP, MAP and DP (or RPP) compared with placebo in both cohorts (Figure 1). In cohort 1, the reduction in AASI did not reach significance (p = 0.059 for differences vs placebo).
Figure 1.
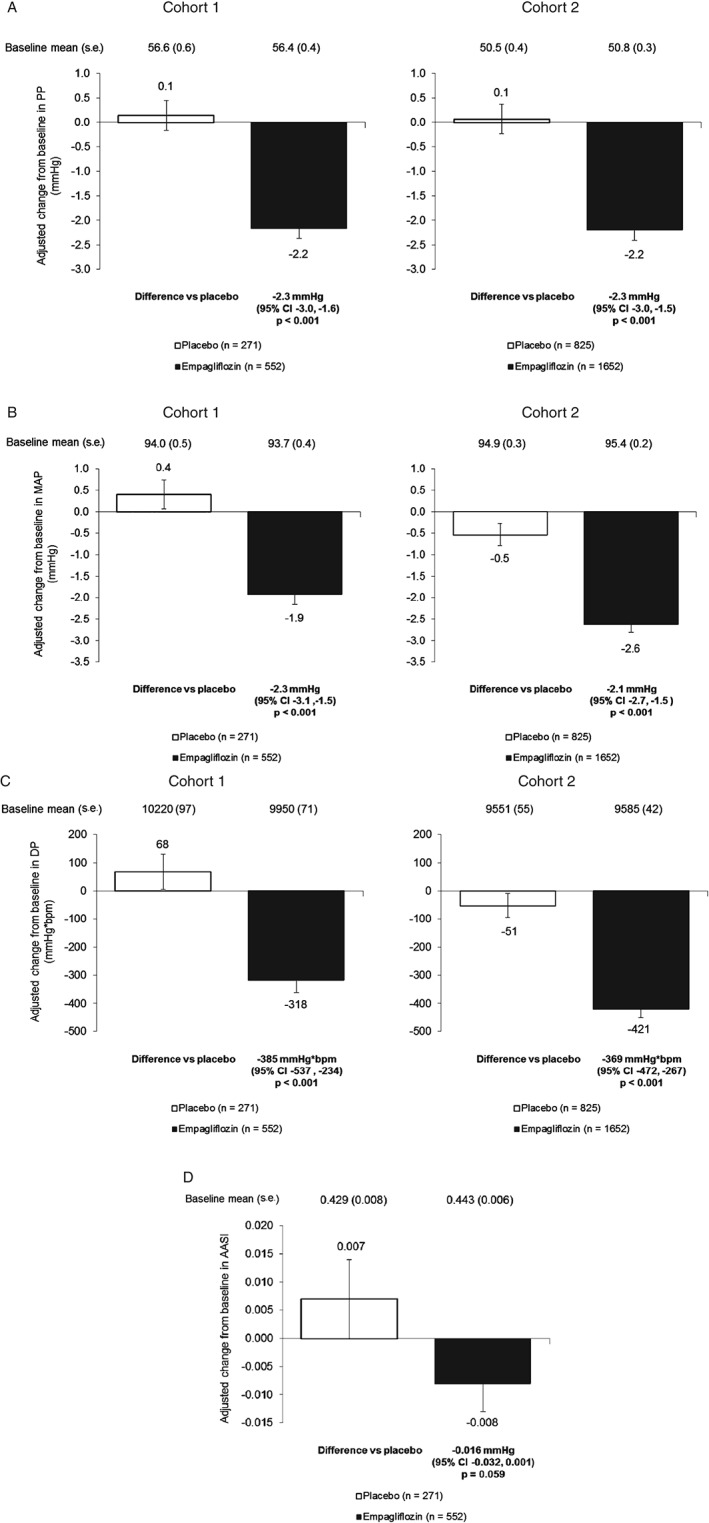
Changes in markers of arterial stiffness and vascular resistance. (A) Change from baseline in pulse pressure (PP) at week 12 in cohort 1 and week 24 in cohort 2 [analysis of covariance (ancova) using last observation carried forward (LOCF)]. (B) Change from baseline in mean arterial pressure (MAP) at week 12 in cohort 1 and week 24 in cohort 2 (ancova, LOCF). (C) Change from baseline in double product (DP) or rate pressure product (RPP) at week 12 in cohort 1 and week 24 in cohort 2 (ancova, LOCF). (D) Change from baseline in ambulatory arterial stiffness index (AASI) at week 12 in cohort 1. Data are adjusted mean ± standard error (s.e.) in the full analysis set. In cohort 1, measurements were based on mean 24‐h ABPM and in cohort 2, they were based on seated office measurements.
Subgroup Analyses: Baseline Age
With increasing age, baseline SBP generally increased and baseline DBP generally decreased, hence baseline PP increased (Figure 2). Empagliflozin reduced SBP, DBP, PP and MAP compared with placebo in most subgroups by baseline age; however, none of the interaction p values reached significance (p < 0.1) except for PP in cohort 2, which was reduced to a greater extent in older patients (p = 0.011; Table 1).
Figure 2.
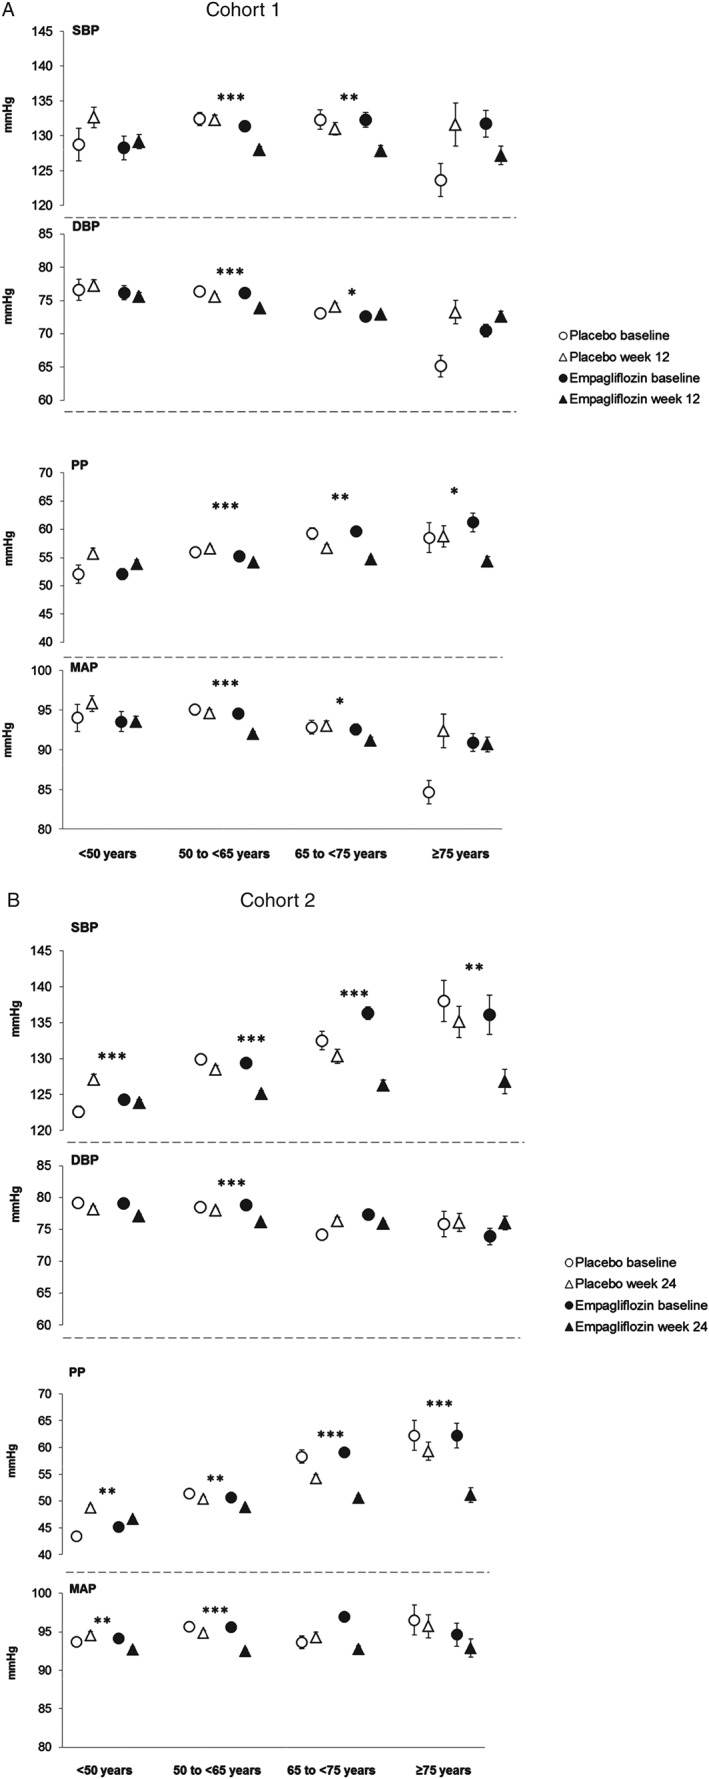
Systolic blood pressure (SBP), diastolic blood pressure (DBP), pulse pressure (PP) and mean arterial pressure (MAP) by subgroups of baseline age. (A) SBP, DBP, PP and MAP at baseline and at week 12 in cohort 1. (B) SBP, DBP, PP and MAP at baseline at week 24 in cohort 2. Baseline data are mean ± standard error (s.e.), week 12 or 24 data are adjusted mean ± s.e. based on analysis of covariance (ancova) in the full analysis set using last observation carried forward (LOCF) imputation. In cohort 1, measurements were based on mean 24‐h ambulatory blood pressure monitoring (ABPM) and in cohort 2, they were based on seated office measurements. ***p < 0.001, **p < 0.01 and *p < 0.05 for adjusted mean differences for empagliflozin versus placebo in change from baseline based on ancova with LOCF imputation.
Table 1.
Subgroup analyses of differences between empagliflozin and placebo in changes from baseline in markers of arterial stiffness and vascular resistance.
| Subgroup | Placebo | Empagliflozin | Adjusted mean (95% CI) differences for empagliflozin vs placebo in change from baseline in: | |||
|---|---|---|---|---|---|---|
| n | n | SBP, mmHg | DBP, mmHg | PP, mmHg | MAP, mmHg | |
| Cohort 1 | ||||||
| Baseline age | ||||||
| <50 years | 31 | 65 | −3.5 (−7.0, −0.0) | −1.6 (−3.6, 0.4) | −1.8 (−4.0, 0.4) | −2.3 (−4.6, 0.1) |
| p value | <0.050 | 0.111 | 0.105 | 0.063 | ||
| 50 to <65 years | 154 | 313 | −4.3 (−5.8, −2.7) | −1.7 (−2.6, −0.8) | −2.4 (−3.4, −1.5) | −2.6 (−3.7, −1.5) |
| p value | <0.001 | <0.001 | <0.001 | <0.001 | ||
| 65 to <75 years | 79 | 136 | −3.1 (−5.4, −0.9) | −1.2 (−2.5, 0.1) | −2.0 (−3.4. −0.6) | −1.9 (−3.4, −0.3) |
| p value | 0.006 | 0.073 | 0.006 | 0.018 | ||
| ≥75 years | 7 | 38 | −4.4 (−11.0, 2.2) | −0.6 (−4.4, 3.2) | −4.4 (−8.5, −0.4) | −1.7 (−6.2, 2.8) |
| p value | 0.189 | 0.748 | 0.033 | 0.462 | ||
| Interaction p value | 0.865 | 0.874 | 0.665 | 0.881 | ||
| Sex | ||||||
| Male | 168 | 327 | −3.7 (−5.2, −2.1) | −1.3 (−2.1, −0.4) | −2.3 (−3.3, −1.4) | −2.1 (−3.1, −1.0) |
| p value | <0.001 | 0.005 | <0.001 | <0.001 | ||
| Female | 103 | 225 | −4.2 (−6.0, −2.3) | −1.9 (−3.0, −0.8) | −2.2 (−3.4, −1.0) | −2.7 (−4.0, −1.4) |
| p value | <0.001 | <0.001 | <0.001 | <0.001 | ||
| Interaction p value | 0.681 | 0.379 | 0.875 | 0.461 | ||
| Baseline SBP | ||||||
| SBP <130 mmHg | 130 | 276 | −2.4 (−4.1, −0.7) | −1.1 (−2.1, −0.1) | −1.4 (−2.5, −0.4) | −1.7 (−2.8, −0.5) |
| p value | 0.006 | 0.024 | 0.007 | 0.005 | ||
| SBP 130–140 mmHg | 85 | 147 | −4.9 (−7.1, −2.7) | −2.1 (−3.3, −0.8) | −2.9 (−4.2, −1.5) | −3.0 (−4.5, −1.6) |
| p value | <0.001 | 0.001 | <0.001 | <0.001 | ||
| SBP >140 mmHg | 56 | 129 | −4.6 (−7.3, −2.0) | −1.4 (−2.9, 0.1) | −3.2 (−4.8, −1.7) | −2.5 (−4.2, −0.7) |
| p value | <0.001 | 0.059 | <0.001 | 0.005 | ||
| Interaction p value | 0.153 | 0.494 | 0.092 | 0.342 | ||
| Cohort 2 | ||||||
| Baseline age | ||||||
| <50 years | 222 | 464 | −3.3 (−5.0, −1.5) | −1.1 (−2.2, 0.0) | −2.2 (−3.5, −0.8) | −1.8 (−3.0, −0.6) |
| p value | <0.001 | 0.053 | 0.002 | 0.003 | ||
| 50 to <65 years | 459 | 871 | −3.4 (−4.6, −2.2) | −1.8 (−2.6, −1.0) | −1.6 (−2.6, −0.6) | −2.3 (−3.2, −1.5) |
| p value | <0.001 | <0.001 | 0.001 | <0.001 | ||
| 65 to <75 years | 119 | 276 | −4.0 (−6.3, −1.6) | −0.3 (−1.8, 1.1) | −3.6 (−5.5. −1.8) | −1.6 (−3.2, 0.0) |
| p value | 0.001 | 0.649 | <0.001 | 0.053 | ||
| ≥75 years | 25 | 41 | −8.3 (−13.7, −2.9) | −0.1 (−3.5, 3.3) | −8.2 (−12.4, −3.9) | −2.8 (−6.5, 0.9) |
| p value | 0.003 | 0.955 | <0.001 | 0.135 | ||
| Interaction p value | 0.365 | 0.284 | 0.011 | 0.788 | ||
| Sex | ||||||
| Male | 424 | 927 | −3.8 (−5.1, −2.6) | −1.5 (−2.3, −0.7) | −2.3 (−3.3, −1.3) | −2.3 (−3.2, −1.5) |
| p value | <0.001 | <0.001 | <0.001 | <0.001 | ||
| Female | 401 | 725 | −3.4 (−4.7, −2.0) | −1.2 (−2.0, −0.3) | −2.2 (−3.2, −1.1) | −1.9 (−2.8, −1.0) |
| p value | <0.001 | 0.006 | <0.001 | <0.001 | ||
| Interaction p value | 0.598 | 0.546 | 0.851 | 0.526 | ||
| Baseline SBP | ||||||
| SBP <130 mmHg | 462 | 891 | −2.6 (−3.9, −1.3) | −0.8 (−1.6, −0.1) | −1.7 (−2.7, −0.7) | −1.4 (−2.2, −0.6) |
| p value | <0.001 | 0.033 | <0.001 | 0.001 | ||
| SBP 130–140 mmHg | 201 | 412 | −4.0 (−5.9, −2.1) | −1.7 (−2.8, −0.5) | −2.4 (−3.9, −0.9) | −2.5 (−3.7, −1.2) |
| p value | <0.001 | 0.005 | 0.001 | <0.001 | ||
| SBP >140 mmHg | 162 | 349 | −6.3 (−8.4, −4.2) | −2.3 (−3.6, −1.1) | −3.6 (−5.3, −2.0) | −3.5 (−4.9, −2.2) |
| p value | <0.001 | <0.001 | <0.001 | <0.001 | ||
| Interaction p value | 0.013 | 0.123 | 0.124 | 0.027 | ||
CI, confidence interval; DBP, diastolic blood pressure; MAP, mean arterial pressure; PP, pulse pressure; SBP, systolic blood pressure.
Data are adjusted mean (95% CI) using analysis of covariance (ANCOVA) with LOCF imputation in randomized patients who received ≥1 dose of study medication and had a baseline Glycated haemoglobin value (both cohorts) and baseline mean 24‐h SBP value (cohort 1 only). Measurements were based on mean 24‐h ABPM in cohort 1 and seated office measurements in cohort 2. Data after initiation of glucose‐lowering rescue therapy were set to missing.
Subgroup Analyses: Sex
In cohort 1, baseline SBP and DBP were higher in men than women (Figure 3). In cohort 2, baseline SBP was higher in men than women (Figure 3). Empagliflozin significantly reduced SBP, DBP, PP and MAP compared with placebo in both sexes (Table 1; Figure 3), with no significant interactions between sex and treatment responses.
Figure 3.
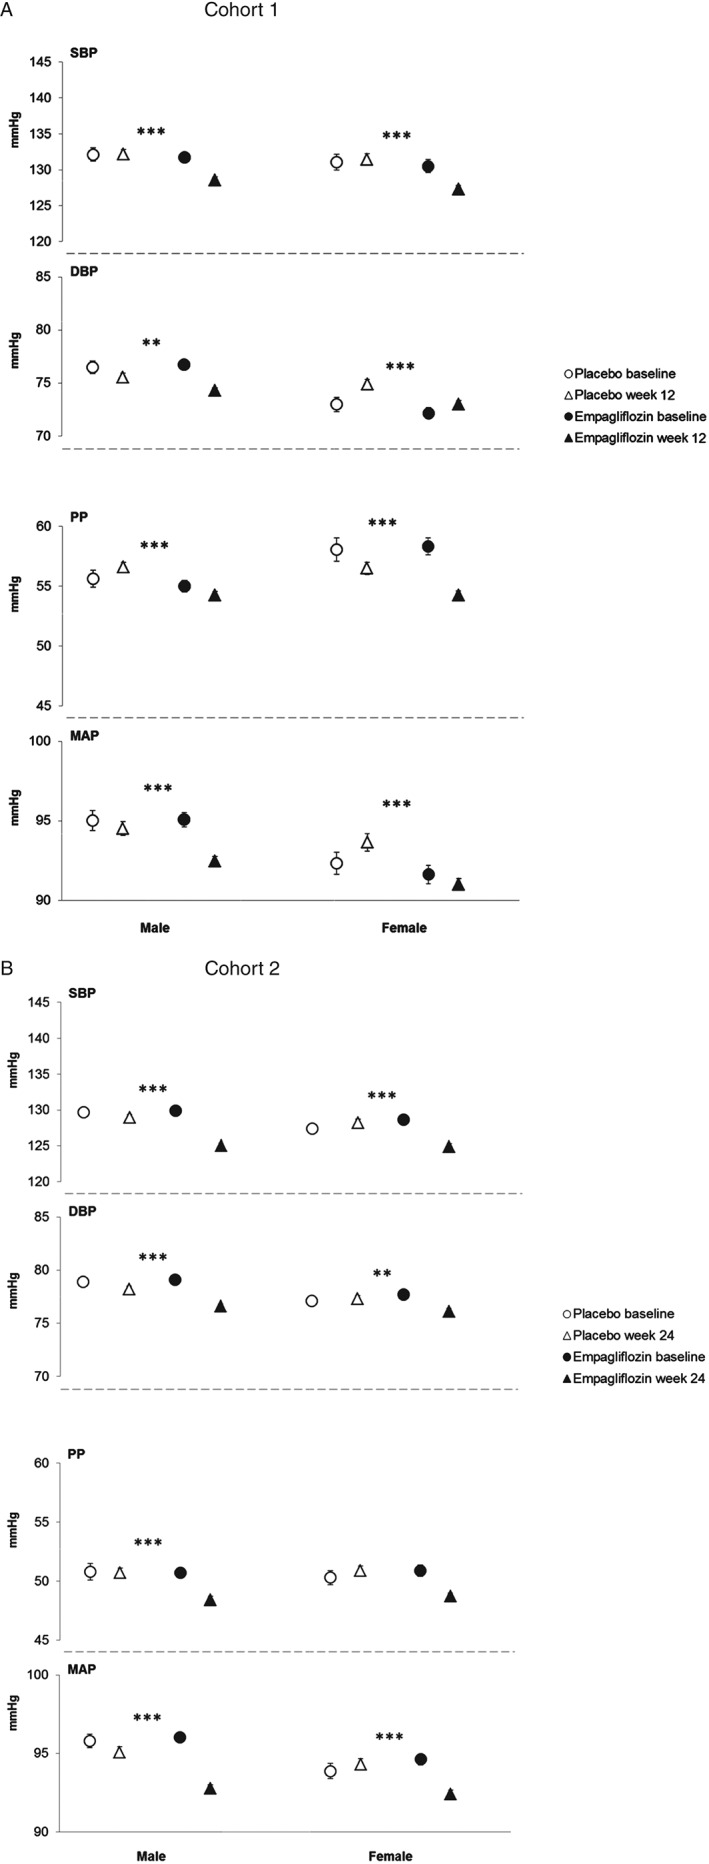
Systolic blood pressure (SBP), diastolic blood pressure (DBP), pulse pressure (PP) and mean arterial pressure (MAP) by sex. (A) SBP, DBP, PP and MAP at baseline and at week 12 in cohort 1. (B) SBP, DBP, PP and MAP at baseline and at week 24 in cohort 2. Baseline data are mean ± standard error (s.e.), week 12 or 24 data are adjusted mean ± s.e. based on analysis of covariance (ancova) in the full analysis set using last observation carried forward (LOCF) imputation. In cohort 1, measurements were based on mean 24‐h ambulatory blood pressure monitoring (ABPM) and in cohort 2, they were based on seated office measurements. ***p < 0.001, **p < 0.01 and *p < 0.05 for adjusted mean differences for empagliflozin versus placebo in change from baseline based on ancova with LOCF imputation.
Subgroup Analyses: Baseline SBP
Baseline DBP, PP and MAP increased with baseline SBP and empagliflozin significantly reduced SBP compared with placebo in all subgroups (Figure 4), with significant treatment by baseline SBP interaction in cohort 2 (p = 0.013; Table 1; Figure 4). Empagliflozin also significantly reduced DBP, PP and MAP in all baseline SBP subgroups, except for DBP in patients with baseline SBP >140 mmHg in cohort 1 (Table 1; Figure 4). There appeared to be greater reductions in PP with increasing baseline SBP in both cohorts, although the treatment by baseline SBP interaction only reached significance in cohort 1 (p = 0.092 for treatment by baseline SBP interaction; Table 1). In cohort 2, there were greater reductions in MAP with increasing baseline SBP (p = 0.027 for treatment by baseline SBP interaction; Table 1).
Figure 4.
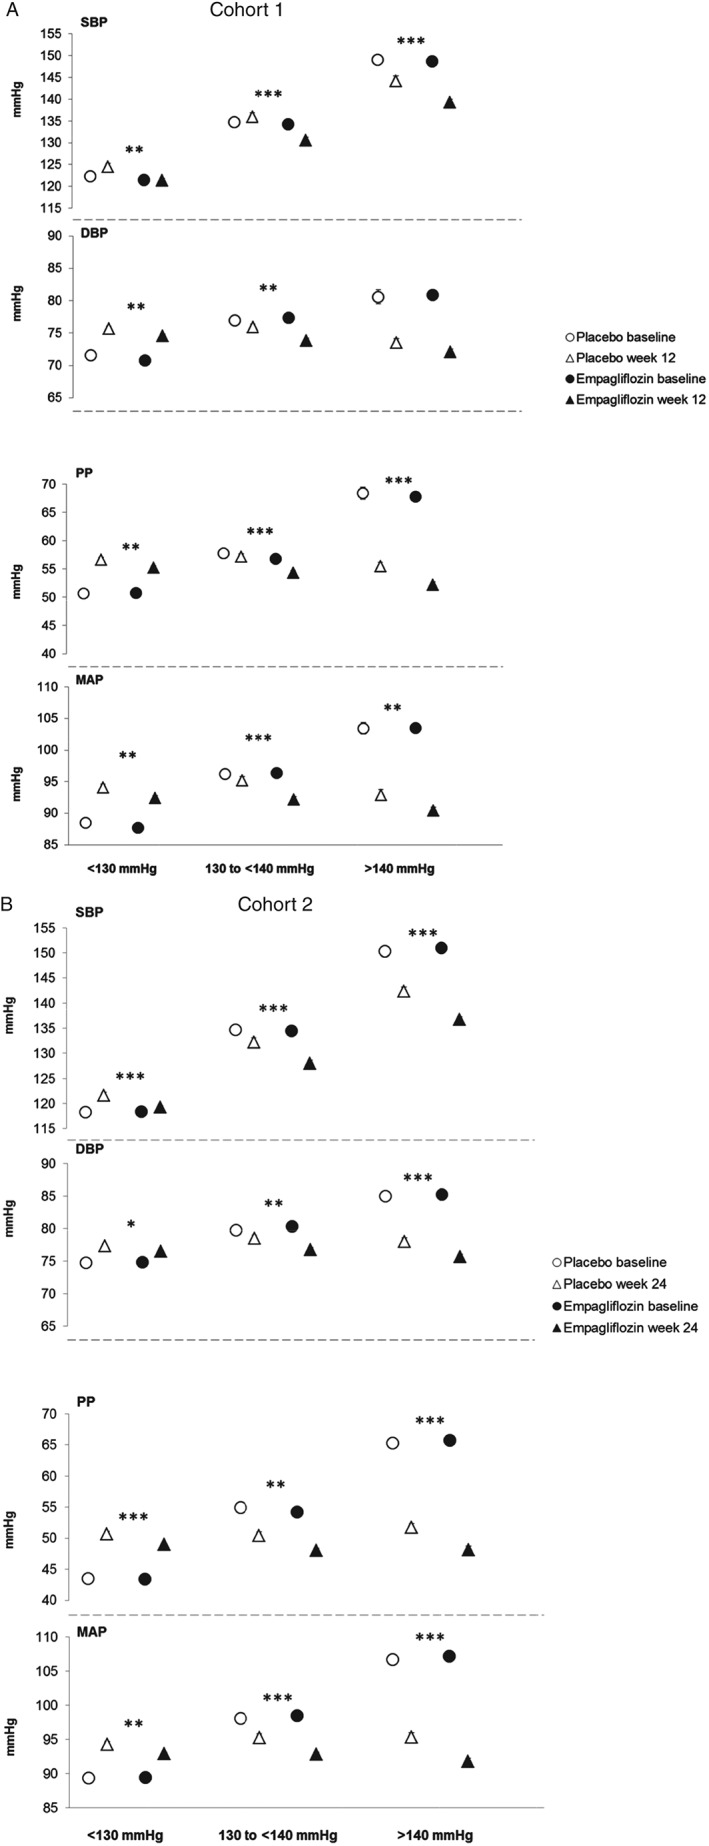
Systolic blood pressure (SBP), diastolic blood pressure (DBP), pulse pressure (PP) and mean arterial pressure (MAP) by subgroups of baseline SBP. (A) SBP, DBP, PP and MAP at baseline and at week 12 in cohort 1. (B) SBP, DBP, PP and MAP at baseline and at week 24 in cohort 2. Baseline data are mean ± standard error (s.e.), week 12 or 24 data are adjusted mean ± s.e. based on analysis of covariance (ancova) in the full analysis set using last observation carried forward (LOCF) imputation. In cohort 1, measurements were based on mean 24‐h ambulatory blood pressure monitoring (ABPM) and in cohort 2, they were based on seated office measurements. ***p < 0.001, **p < 0.01 and *p < 0.05 for adjusted mean differences for empagliflozin versus placebo in change from baseline based on ancova with LOCF imputation.
Safety and Tolerability
Data on the safety and tolerability of empagliflozin, including adverse events and changes in lipids and other laboratory variables, have been published for the individual trials 23, 24, 25, 26, 27. In brief, empagliflozin was associated with an incidence of hypoglycaemia similar to placebo except when used in combination with a sulphonylurea. Events consistent with genital infection were reported in a higher proportion of patients receiving empagliflozin than placebo, while events consistent with urinary tract infection were reported by a similar proportion of patients receiving empagliflozin and placebo. Events consistent with volume depletion were reported in 1 patient (0.4%) on placebo and 1 patient on empagliflozin (0.2%) in cohort 1, and 2 patients (0.2%) on placebo and 5 patients (0.3%) on empagliflozin in cohort 2; none of these events was reported in patients aged ≥75 years. Increases in HDL cholesterol with empagliflozin versus placebo were reported in four of the five studies 23, 24, 25, 26, and two studies reported increases in LDL cholesterol with empagliflozin versus placebo 24, 27.
Discussion
The objective of the present post hoc analysis was to explore the effects of empagliflozin on BP, arterial stiffness and vascular resistance in patients with T2DM. In both of the cohorts studied, empagliflozin reduced BP, without increasing heart rate, and had favourable effects on markers of arterial stiffness and vascular resistance as well as on a marker of myocardial workload.
The differences in baseline SBP, DBP and PP with increasing age were, as expected, based on population data. After the age of 50 years, SBP continues to increase, while DBP tends to remain fairly stable between ages 50 and 60 years and then decrease, leading to a widening PP 30. These changes suggest that large artery stiffness becomes the predominant haemodynamic factor driving increases in SBP in individuals aged >60 years, while peripheral vascular resistance drives BP in younger individuals 30.
As we hypothesized, the greatest reductions in PP were observed in the oldest patients and in those with the highest SBP at baseline. MAP was reduced in all the subgroups, with no greater reduction in patients with higher age or SBP at baseline. This is explained by the dominance of DBP in the measurement of MAP, which means that MAP reflects small artery resistance and cardiac output to a greater extent than PP. It appears, therefore, that empagliflozin is efficacious across the entire age range but its effects may differ with age; for example, in younger patients, BP reduction may be mediated via effects on small artery resistance and, in the elderly, largely via effects on large artery stiffness. The reduction in the DP (or RPP), a marker of cardiac workload, observed with empagliflozin was driven by reduction in SBP; empagliflozin had a neutral effect on heart rate in this analysis, consistent with the results of previous trials in patients with T2DM and with the results of a study on the effects of empagliflozin on heart rate variability in patients with T1DM 29. The reduction in the DP (or RPP) is intriguing from the perspective of its prognostic impact on CV and total mortality, but also from a congestive heart failure perspective, and it is tempting to speculate that empagliflozin may reduce hospitalization for heart failure. Interestingly, in a 16‐week study in a diabetic hypertensive rat model of heart failure, empagliflozin was observed to have beneficial effects on cardiac morphology and function 31.
The observation that empagliflozin has an impact on the vasculature without increasing pulse rate is interesting from a CV perspective and could be interpreted as a consequence of a relative reduction in the sympathetic nervous system tonus. Although neurohormonal factors could also play a role, this notion is supported by mechanistic data from normotensive patients with T2DM in whom no apparent changes in muscle sympathetic nerve activity, measured using microneurography, were observed, despite clinical benefits with regard to BP and weight 32.
Reductions in SBP and DBP have consistently been observed with the use of SGLT2 inhibitors in patients with T2DM 33, but no data in humans have been published on reductions in arterial stiffness or vascular resistance with SGLT2 inhibitors other than empagliflozin. As no other classes of glucose‐lowering drugs, including dipeptidyl peptidase‐4 inhibitors and GLP‐1 receptor analogues, have shown similar findings, the observed improvements in arterial stiffness and vascular resistance could be a unique phenomenon for empagliflozin, which could have major implications for vascular health and CV prognosis.
The mechanisms by which empagliflozin reduces BP and arterial stiffness are not fully understood, but may be related to improved glycaemic control, weight loss, volume contraction as a result of osmotic diuresis or reduced oxidative stress 29, 33, 34, 35, 36. In a rat model, empagliflozin was further shown to normalize endothelial function, reduce oxidative stress in aortic vessels, reverse a pro‐inflammatory phenotype, and improve AGE/RAGE signalling 37, all pathways of potential importance to a reduction in arterial stiffness 36. In addition, in a mouse model of obesity and T2DM, empagliflozin ameliorated pericoronary arterial fibrosis, coronary arterial thickening and cardiac macrophage infiltration, effects that are associated with attenuation of oxidative stress in CV tissue 38.
In this analysis, events consistent with volume depletion were rare and no such events were reported in patients aged ≥75 years; however, the potential for volume depletion in vulnerable patients such as the elderly, those with renal impairment, those with low SBP and those receiving diuretics is acknowledged in the prescribing information for SGLT2 inhibitors 39, 40, 41 and appropriate caution should be exercised in the use of empagliflozin in such patients in clinical practice.
Strengths of the analyses presented in this manuscript include the large number of patients analysed (cohort 2) and the use of 24‐h ABPM in patients with hypertension (cohort 1). Limitations include the post hoc nature of the analyses, the relatively small number of patients in the older age groups, that the analyses did not account for multiple testing, and the short exposure period to the drug (12 or 24 weeks). In addition, there were few Asian patients with advanced hypertension, which limits the generalizability of our findings to this population.
Indirect evidence suggests that reductions in arterial stiffness and vascular resistance may reduce CV risk beyond BP reduction 42, 43. Reductions in BP and arterial stiffness are two of the effects of SGLT2 inhibitors that might ameliorate CV risk and heart failure in patients with T2DM 44. The effects of empagliflozin on CV and microvascular outcomes are being investigated in the EMPA‐REG OUTCOME® trial (NCT01131676) 45, which will report results in the second half of 2015.
Conflict of Interest
R. C. has received consulting fees from Pfizer, Bristol Myers Squibb, Merck Sharp and Dohme, Takeda, Boston Scientific and Boehringer Ingelheim. I. T. has received consulting fees/payments for lectures and support for travel to meetings from Boehringer Ingelheim. C. C. has received grants from Accumetrics, Arisaph, Astra Zeneca, Boehringer Ingelheim, GlaxoSmithKline, Janssen, Merck and Takeda, and consulting fees from Boehringer Ingelheim, Bristol Myers Squibb, CSL Behring, Essentialis, GlaxoSmithKline, Kowa, Merck, Takeda, Lipimedix, Pfizer, Regeneron and Sanofi. S. C., H. J. W., U. C. B. and O. E. J. are employees of Boehringer Ingelheim.
O. E. J. planned the study. U. C. B. and O. E. J. contributed to the study design and interpretation of data and writing of the manuscript. R. C., I. T., and C. P. C. contributed to the acquisition and interpretation of data and reviewed/edited the manuscript. S. C. and H. J. W. contributed to the interpretation of data and reviewed/edited the manuscript. The authors were fully responsible for all content and editorial decisions, were involved at all stages of manuscript development and have approved the final version.
Supporting information
Figure S1. Changes in blood pressure and heart rate in cohorts 1 and 2.
Table S1. Patient demographics and baseline characteristics.
Acknowledgements
The studies that provided data for these analyses were funded by Boehringer Ingelheim and Eli Lilly and Company. Medical writing assistance, supported financially by Boehringer Ingelheim, was provided by Clare Ryles and Wendy Morris of Fleishman‐Hillard Group Ltd during the preparation of this manuscript.
References
- 1. American Diabetes Association . Standards of medical care in diabetes‐2015. Diabetes Care 2015; 38(Suppl. 1): S1–93. [Google Scholar]
- 2. Emerging Risk Factors Collaboration , Sarwar N, Gao P, Seshasai SR et al. Diabetes mellitus, fasting blood glucose concentration, and risk of vascular disease: a collaborative meta‐analysis of 102 prospective studies. Lancet 2010; 375: 2215–2222. [DOI] [PMC free article] [PubMed] [Google Scholar]
- 3. [ESC/EASD] Task Force on Diabetes, Pre‐diabetes, and Cardiovascular Diseases of the European Society of Cardiology (ESC); European Association for the Study of Diabetes (EASD) , Rydén L, Grant PJ, Anker SD et al. ESC guidelines on diabetes, pre‐diabetes, and cardiovascular diseases developed in collaboration with the EASD–summary. Diab Vasc Dis Res 2014; 11: 133–173. [DOI] [PubMed] [Google Scholar]
- 4. Creager MA, Lüscher TF, Cosentino F, Beckman JA. Diabetes and vascular disease: pathophysiology, clinical consequences, and medical therapy: part I. Circulation 2003; 108: 1527–1532. [DOI] [PubMed] [Google Scholar]
- 5. Hsueh WA, Wyne K. Renin‐angiotensin‐aldosterone system in diabetes and hypertension. J Clin Hypertens (Greenwich) 2011; 13: 224–237. [DOI] [PMC free article] [PubMed] [Google Scholar]
- 6. Wei Q, Ren X, Jiang Y, Jin H, Liu N, Li J. Advanced glycation end products accelerate rat vascular calcification through RAGE/oxidative stress. BMC Cardiovasc Disord 2013; 13: 13. [DOI] [PMC free article] [PubMed] [Google Scholar]
- 7. Lastra G, Syed S, Kurukulasuriya LR, Manrique C, Sowers JR. Type 2 diabetes mellitus and hypertension: an update. Endocrinol Metab Clin North Am 2014; 43: 103–122. [DOI] [PMC free article] [PubMed] [Google Scholar]
- 8. Stehouwer CD, Henry RM, Ferreira I. Arterial stiffness in diabetes and the metabolic syndrome: a pathway to cardiovascular disease. Diabetologia 2008; 51: 527–539. [DOI] [PubMed] [Google Scholar]
- 9. Wagenseil JE, Mecham RP. Elastin in large artery stiffness and hypertension. J Cardiovasc Transl Res 2012; 5: 264–273. [DOI] [PMC free article] [PubMed] [Google Scholar]
- 10. Vlachopoulos C, Aznaouridis K, Stefanadis C. Prediction of cardiovascular events and all‐cause mortality with arterial stiffness: a systematic review and meta‐analysis. J Am Coll Cardiol 2010; 55: 1318–1327. [DOI] [PubMed] [Google Scholar]
- 11. Nilsson PM, Boutouyrie P, Cunha P et al. Early vascular ageing in translation: from laboratory investigations to clinical applications in cardiovascular prevention. J Hypertens 2013; 31: 1517–1526. [DOI] [PubMed] [Google Scholar]
- 12. Chow B, Rabkin SW. The relationship between arterial stiffness and heart failure with preserved ejection fraction: a systematic meta‐analysis. Heart Fail Rev 2015; 20: 291–303. [DOI] [PubMed] [Google Scholar]
- 13. Jung CH, Jung SH, Kim KJ et al. Differential associations of central and brachial blood pressure with carotid atherosclerosis and microvascular complications in patients with type 2 diabetes. BMC Cardiovasc Disord 2014; 14: 23. [DOI] [PMC free article] [PubMed] [Google Scholar]
- 14. Nilsson PM, Cederholm J, Eeg‐Olofsson K et al. Pulse pressure strongly predicts cardiovascular disease risk in patients with type 2 diabetes from the Swedish National Diabetes Register (NDR). Diabetes Metab 2009; 35: 439–446. [DOI] [PubMed] [Google Scholar]
- 15. Yu D, Simmons D. Association between pulse pressure and risk of hospital admissions for cardiovascular events among people with type 2 diabetes: a population‐based case‐control study. Diabet Med 2015; 32: 1201–1206. [DOI] [PubMed] [Google Scholar]
- 16. Kodama S, Horikawa C, Fujihara K et al. Meta‐analysis of the quantitative relation between pulse pressure and mean arterial pressure and cardiovascular risk in patients with diabetes mellitus. Am J Cardiol 2014; 113: 1058–1065. [DOI] [PubMed] [Google Scholar]
- 17. Vlachopoulos C, Aznaouridis K, O'Rourke MF, Safar ME, Baou K, Stefanadis C. Prediction of cardiovascular events and all‐cause mortality with central haemodynamics: a systematic review and meta‐analysis. Eur Heart J 2010; 31: 1865–1871. [DOI] [PubMed] [Google Scholar]
- 18. Dolan E, Li Y, Thijs L et al. Ambulatory arterial stiffness index: rationale and methodology. Blood Press Monit 2006; 11: 103–105. [DOI] [PubMed] [Google Scholar]
- 19. Kollias A, Stergiou GS, Dolan E, O'Brien E. Ambulatory arterial stiffness index: a systematic review and meta‐analysis. Atherosclerosis 2012; 224: 291–301. [DOI] [PubMed] [Google Scholar]
- 20. White WB. Heart rate and the rate‐pressure product as determinants of cardiovascular risk in patients with hypertension. Am J Hypertens 1999; 12: 50S–55S. [DOI] [PubMed] [Google Scholar]
- 21. Inoue R, Ohkubo T, Kikuya M et al. Predictive value for mortality of the double product at rest obtained by home blood pressure measurement: the Ohasama study. Am J Hypertens 2012; 25: 568–575. [DOI] [PubMed] [Google Scholar]
- 22. Grempler R, Thomas L, Eckhardt M et al. Empagliflozin, a novel selective sodium glucose cotransporter‐2 (SGLT‐2) inhibitor: characterisation and comparison with other SGLT‐2 inhibitors. Diabetes Obes Metab 2012; 14: 83–90. [DOI] [PubMed] [Google Scholar]
- 23. Roden M, Weng J, Eilbracht J et al. Empagliflozin monotherapy with sitagliptin as an active comparator in patients with type 2 diabetes: a randomised, double‐blind, placebo‐controlled, phase 3 trial. Lancet Diabetes Endocrinol 2013; 1: 208–219. [DOI] [PubMed] [Google Scholar]
- 24. Häring HU, Merker L, Seewaldt‐Becker E et al. Empagliflozin as add‐on to metformin in patients with type 2 diabetes: a 24‐week, randomized, double‐blind, placebo‐controlled trial. Diabetes Care 2014; 37: 1650–1659. [DOI] [PubMed] [Google Scholar]
- 25. Häring HU, Merker L, Seewaldt‐Becker E et al. Empagliflozin as add‐on to metformin plus sulfonylurea in patients with type 2 diabetes: a 24‐week, randomized, double‐blind, placebo‐controlled trial. Diabetes Care 2013; 36: 3396–3404. [DOI] [PMC free article] [PubMed] [Google Scholar]
- 26. Kovacs CS, Seshiah V, Swallow R et al. Empagliflozin improves glycaemic and weight control as add‐on therapy to pioglitazone or pioglitazone plus metformin in patients with type 2 diabetes: a 24‐week, randomized, placebo‐controlled trial. Diabetes Obes Metab 2014; 16: 147–158. [DOI] [PubMed] [Google Scholar]
- 27. Tikkanen I, Narko K, Zeller C et al. Empagliflozin reduces blood pressure in patients with type 2 diabetes and hypertension. Diabetes Care 2015; 38: 420–428. [DOI] [PubMed] [Google Scholar]
- 28. Nishimura R, Tanaka Y, Koiwai K et al. Effect of empagliflozin monotherapy on postprandial glucose and 24‐hour glucose variability in Japanese patients with type 2 diabetes mellitus: a randomized, double‐blind, placebo‐controlled, 4‐week study. Cardiovasc Diabetol 2015; 14: 11. [DOI] [PMC free article] [PubMed] [Google Scholar]
- 29. Cherney DZ, Perkins BA, Soleymanlou N et al. The effect of empagliflozin on arterial stiffness and heart rate variability in subjects with uncomplicated type 1 diabetes mellitus. Cardiovasc Diabetol 2014; 13: 28. [DOI] [PMC free article] [PubMed] [Google Scholar]
- 30. Franklin SS. Ageing and hypertension: the assessment of blood pressure indices in predicting coronary heart disease. J Hypertens Suppl 1999; 17: S29–36. [PubMed] [Google Scholar]
- 31. Younis F, Hollander K, Mayoux E et al. Effect of prophylactic treatment with empagliflozin on cardiac function and diabetes in CRDH rats. Diabetes 2014; 63(Suppl. 1): A273 [1056‐P]. [Google Scholar]
- 32. Jordan J, Tank J, Heusser K et al. Empagliflozin (EMPA) has no discernable effect on muscle sympathetic nerve activity (MSNA) in patients with type 2 diabetes (T2DM) despite reductions in blood pressure (BP) and weight. Diabetes 2014; 63: A265 (Suppl. 1). [Google Scholar]
- 33. Baker WL, Smyth LR, Riche DM et al. Effects of sodium‐glucose co‐transporter 2 inhibitors on blood pressure: a systematic review and meta‐analysis. J Am Soc Hypertens 2014; 8: 262–275. [DOI] [PubMed] [Google Scholar]
- 34. Dengo AL, Dennis EA, Orr JS et al. Arterial destiffening with weight loss in overweight and obese middle‐aged and older adults. Hypertension 2010; 55: 855–861. [DOI] [PMC free article] [PubMed] [Google Scholar]
- 35. Ferreira MT, Leite NC, Cardoso CRL, Salles GF. Correlates of aortic stiffness progression in patients with type 2 diabetes: importance of glycemic control: the Rio de Janeiro type 2 diabetes cohort study. Diabetes Care 2015; 38: 897–904. [DOI] [PubMed] [Google Scholar]
- 36. Mullan BA, Young IS, Fee H, McCance DR. Ascorbic acid reduces blood pressure and arterial stiffness in type 2 diabetes. Hypertension 2002; 40: 804–809. [DOI] [PubMed] [Google Scholar]
- 37. Oelze M, Kröller‐Schön S, Welschof P et al. The sodium‐glucose co‐transporter 2 inhibitor empagliflozin improves diabetes‐induced vascular dysfunction in the streptozotocin diabetes rat model by interfering with oxidative stress and glucotoxicity. PLoS One 2014; 9: e112394. [DOI] [PMC free article] [PubMed] [Google Scholar]
- 38. Lin B, Koibuchi N, Hasegawa Y et al. Glycemic control with empagliflozin, a novel selective SGLT2 inhibitor, ameliorates cardiovascular injury and cognitive dysfunction in obese and type 2 diabetic mice. Cardiovasc Diabetol 2014; 13: 148. [DOI] [PMC free article] [PubMed] [Google Scholar]
- 39. AstraZeneca Pharmaceuticals LLP . Farxiga™ (dapagliflozin) US prescribing information. 2014.
- 40. Boehringer Ingelheim Pharmaceuticals, Inc. Jardiance® (empagliflozin) US prescribing information. 2014.
- 41. Janssen Pharmaceticals Inc. Invokana™ (canagliflozin) US prescribing information. 2014.
- 42. Frishman WH. Increased vascular compliance/decreased cardiovascular risk: what the studies tell us. Heart Dis 2000; 2: 384–388. [PubMed] [Google Scholar]
- 43. Cameron JD, Asmar R, Struijker‐Boudier H et al. Current and future initiatives for vascular health management in clinical practice. Vasc Health Risk Manag 2013; 9: 255–264. [DOI] [PMC free article] [PubMed] [Google Scholar]
- 44. Inzucchi SE, Zinman B, Wanner C et al. SGLT‐2 inhibitors and cardiovascular risk: proposed pathways and review of ongoing outcome trials. Diab Vasc Dis Res 2015; 12: 90–100. [DOI] [PMC free article] [PubMed] [Google Scholar]
- 45. Zinman B, Inzucchi SE, Lachin JM et al. Rationale, design, and baseline characteristics of a randomized, placebo‐controlled cardiovascular outcome trial of empagliflozin (EMPA‐REG OUTCOME™). Cardiovasc Diabetol 2014; 13: 102. [DOI] [PMC free article] [PubMed] [Google Scholar]
Associated Data
This section collects any data citations, data availability statements, or supplementary materials included in this article.
Supplementary Materials
Figure S1. Changes in blood pressure and heart rate in cohorts 1 and 2.
Table S1. Patient demographics and baseline characteristics.