Abstract
Objective
The diagnosis of mitochondrial disorders (MDs) is occasionally difficult because patients often present with solitary, or a combination of, symptoms caused by each organ insufficiency, which may be the result of respiratory chain enzyme deficiency. Growth differentiation factor 15 (GDF‐15) has been reported to be elevated in serum of patients with MDs. In this study, we investigated whether GDF‐15 is a more useful biomarker for MDs than several conventional biomarkers.
Methods
We measured the serum levels of GDF‐15 and fibroblast growth factor 21 (FGF‐21), as well as other biomarkers, in 48 MD patients and in 146 healthy controls in Japan. GDF‐15 and FGF‐21 concentrations were measured by enzyme‐linked immunosorbant assay and compared with lactate, pyruvate, creatine kinase, and the lactate‐to‐pyruvate ratio. We calculated sensitivity and specificity and also evaluated the correlation based on two rating scales, including the Newcastle Mitochondrial Disease Rating Scale (NMDAS).
Results
Mean GDF‐15 concentration was 6‐fold higher in MD patients compared to healthy controls (2,711 ± 2,459 pg/ml vs 462.5 ± 141.0 pg/mL; p < 0.001). Using a receiver operating characteristic curve, the area under the curve was significantly higher for GDF‐15 than FGF‐21 and other conventional biomarkers. Our date suggest that GDF‐15 is the most useful biomarker for MDs of the biomarkers examined, and it is associated with MD severity.
Interpretation
Our results suggest that measurement of GDF‐15 is the most useful first‐line test to indicate the patients who have the mitochondrial respiratory chain deficiency. Ann Neurol 2015;78:Ann Neurol 2015;78:679–696
Mitochondrial disorders (MDs) are occasionally difficult to diagnose because patients present with one or a combination of symptoms, such as psychomotor developmental delay, failure to thrive, short stature, seizures, muscle weakness, hearing loss, heart failure, renal failure, or diabetes. Because the plasma levels of lactate and pyruvate are not always accurate biomarkers or MD diagnosis, a novel biomarker, which is more sensitive, specific, reproducible, and quantitative, is required. Minimizing the number of specimens examined for MD diagnosis is a very important issue for clinicians and/or diagnostic centers in terms of cost‐ and time‐effectiveness.
No reliable biomarker was available for the screening or diagnosis of MDs until 2011.1 Because an MD may present as “any symptom in any organ at any age,”2 we must develop an optionally useful biomarker for MD diagnosis and the evaluation of therapeutic efficacy. In 2011, serum fibroblast growth factor 21 (FGF‐21) was reported to be a useful biomarker for the screening and diagnosis of muscle‐manifested MDs.3, 4 The proposed diagnostic process for MDs is as follows: (1) clinical assessment; (2) measurement of the FGF‐21 level; (3) long‐range polymerase chain reaction, next‐generation sequencing, or whole‐exome sequencing of nuclear DNA; and (4) with/without histopathological and biochemical analysis via muscle biopsy, which may indicate approximately 70% to 80% of clinically suspected MDs.5 FGF‐21 appears to be a useful novel biomarker for the specific screening of MDs because the measurement of FGF‐21 involves a less‐invasive approach than muscle biopsy.
Growth differentiation factor 15 (GDF‐15) is a member of the transforming growth factor beta superfamily. Expression of GDF‐15 in nearly all tissues suggests its general importance in essential cellular functions. GDF‐15 has been proposed as a biomarker of heart disease, kidney disease, and cancers; however, its exact biological functions remain poorly understood. It is hypothesized that GDF‐15 is elevated by activating transcription factor 4 (ATF4), which is a stress‐responsive gene induced by various stresses.6 GDF‐15 is currently under investigation as a marker of the clinical risk factors, mortality, morbidity, and effectiveness of treatments for heart disease, kidney disease, and some cancers; however, GDF‐15 does not appear to play a useful role as a diagnostic marker.7 In 2014, Kalko et al investigated the gene expression profile of TK2‐deficient human skeletal muscle using complementary DNA microarrays and demonstrated that serum GDF‐15 (GDF‐15) may be a novel biomarker for MDs.8 We performed a microarray analysis of 2SD cybrid cells that harbor a mitochondrial encephalopathy, lactic acidosis, and stroke‐like episodes (MELAS)‐causing mutation and control cells and demonstrated that expression and secretion of GDF‐15 were increased in 2SD cells loaded by lactate; these findings suggest that GDF‐15 may serve as a useful marker for MD diagnosis and evaluation of the therapeutic efficacy of drugs.6 In this study, we measured GDF‐15 concentrations from patients who suffered from MDs, disease controls, and healthy controls, and evaluated its usefulness for MD diagnosis.
Patients and Methods
Participants
All MD patients who fulfilled the clinical diagnostic criteria (MELAS; mitochondrial encephalopathy, and lactic acidosis [MELA], for which the main symptom was muscle weakness; Leigh syndrome [LS]; overlapping MELAS/LS; and Kearns‐Sayre syndrome [KSS]) and carried a known genetic abnormality were enrolled in this study from 2005 to 2013 (Fig 1A). DNA, enzyme, or muscle histopathological analyses were performed on all patients (Supplementary Table 1). The disease controls consisted of adult and child patients with non‐MD, including 6 defined Duchenne muscular dystrophy (DMD), 9 multiple sclerosis (MS), 4 anti‐AQP4 (aquaporin 4) antibody‐positive optic neuritis, 10 limbic encephalitis (anti‐GluR [glutamate receptor] antibody‐positive, anti‐NMDA [N‐methyl‐D‐aspartate] receptor‐positive, varicella zoster virus infection, and lung cancer), 1 brainstem encephalitis, 1 meningoencephalitis, 1 SLE (systemic lupus erythematosus) with CNS (central nervous system), 1 NMO (neuromyelitis optica), 1 HUS (hemolytic uremic syndrome) encephalitis, and 8 defined heart failure (HF) patients. All DMD patients were diagnosed with a large deletion of the dystrophin gene by multiplex ligation‐dependent probe amplification (MLPA). All MS, optic neuritis, limbic encephalitis, brainstem encephalitis, meningoencephalitis, NMO, and HUS encephalitis patients were diagnosed with fulfilled criteria. All HF patients were diagnosed based on an ejection fraction (EF) below 50% in this study (Supplementary Table 1). Healthy adult and child volunteers without treatment or ambulatory medical care were also recruited from Kurume University Hospital, Fukuoka, Japan (Fig 1B). Mean age, BMI, and % males are shown in Table 1. The study protocol was approved by the institutional review boards of all centers (coordinator: Kurume University Hospital, #13099). Written informed consent was obtained from all subjects before enrollment.
Figure 1.
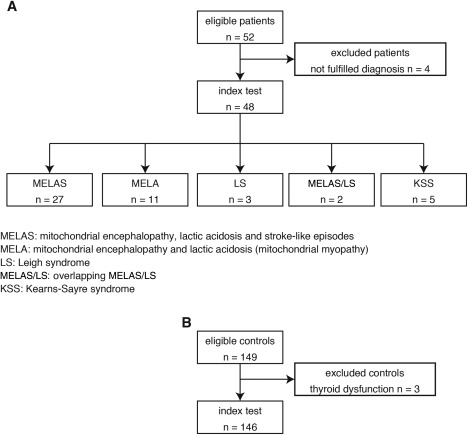
STARD flow diagram and demography of the controls, MD patients, and disease controls. (A) All 48 MD patients who fulfilled the clinical diagnostic criteria (mitochondrial encephalopathy, lactic acidosis, and stroke‐like episodes [MELAS]; mitochondrial encephalopathy, and lactic acidosis [MELA], for which the main symptom was muscle weakness; Leigh syndrome [LS]; overlapping MELAS/LS; and Kearns‐Sayre syndrome [KSS]) and carried a known genetic abnormality were enrolled in this study from 2005 to 2013. (B) Healthy adult and child volunteers without treatment or ambulatory medical care were also recruited in 146 Japanese. MD = mitochondrial disorder; STARD = standards for reporting of diagnostic accuracy.
Table 1.
Demographics of the Number, Mean Age, Mean BMI, and % Males for MD Patients and Non‐MD Patients
| Controls | MD Patients | Disease Controls | |
|---|---|---|---|
| Number | 146 | 48 | 42 |
| Age, years | 23.6 ± 13.7 | 33.6 ± 18.7** | 41.4 ± 17.2*** |
| BMI, kg/m2 (n) | 19.1 ± 3.0 (146) | 17.4 ± 3.3 (48)*** | 21.7 ± 3.8 (41)*** |
| % males (n) | 48.0 (70) | 48.0 (23) | 54.7 (23) |
Mean age was significantly higher in MDs patients (33.6 ± 18.7 years old; p < 0.01) and disease controls (41.4 ± 17.2 years old; p < 0.001) than in healthy controls (23.6 ± 13.7 years old). Mean BMI was significantly lower in MDs patients (17.4 ± 3.3 kg/m2; p < 0.001) than in healthy controls (19.1 ± 3.0 kg/m2) and higher in disease controls (21.7 ± 3.8 kg/m2; p < 0.001) than in healthy controls (19.1 ± 3.0 kg/m2). Mann–Whitney U test: ** p < 0.01; *** p < 0.001.
BMI = body mass index; MD = mitochondrial disorder.
For the healthy controls, we calculated the body mass index (BMI: kg/m2) of each individual and recruited healthy adults (≥20 years old) who exhibited a BMI between 18 and 25 and children (<20 years old) who exhibited a BMI within ± 2 standard deviations (SDs) of the average for each age in the Japanese population.
Procedures
The serum samples used in this study were collected for analysis from 2012 to 2014. All samples were stored at –80°C until analysis. We measured the GDF‐15 (R&D Systems, Minneapolis, USA) and FGF‐21 (FGF‐21; BioVendor, Brno, Czech Republic) concentrations in duplicate samples by enzyme‐linked immunorbent assay (ELISA). The samples for which the concentration of GDF‐15 or FGF‐21 was higher than the range of detection were diluted 10‐fold with dilution buffer and reanalysed. The value from each assay was compared with reference GDF‐15 and FGF‐21 concentrations. We also measured the levels of conventional biomarkers, such as lactate, pyruvate, the lactate/pyruvate (L/P) ratio, and creatine kinase (CK). In addition, we recorded the height, body weight, BMI, and blood sugar levels. The results of each assay were compared with a linear calibration curve. All assays were performed by a trained scientist (S.Y. and R.S.).
The enrolled MD patients were clinically evaluated for disease severity using two rating systems: the Japanese Mitochondrial Disease Rating Scale (JMDRS)9 and the Newcastle Mitochondrial Disease Rating Scale (NMDAS).10 All scores were also evaluated with respect to the levels of GDF‐15 or FGF‐21 using correlation coefficients.
Statistical Analysis
The diagnostic test for MD using GDF‐15 was evaluated by receive operating characteristic (ROC) curve analyses. The threshold value was determined using the Youden index. Ninety‐five percent confidence intervals (95% CIs) for the area under the curve (AUC) of the ROC were obtained. Leave‐one‐out cross‐validation of GDF‐15 and FGF‐21 was performed. Sensitivity and specificity of GDF‐15 were compared with a measurement of FGF‐21 using a McNemar test. Comparison of two correlated nonparametric AUCs was also performed.11 Spearman correlation coefficients were used to examine the associations between the biomarkers.
Role of the Funding Source
This work was supported, in part, by grant nos. 25461571 (to Y.K.), 25860891 (to S.Y.), and 25242062 (to M.T.) from the Ministry of Education, Culture, Sports, Science and Technology (MEXT) and by Grant‐in‐Aid no. 24‐Nanchi‐Ippan‐005 (to Y.K.) for Research on Intractable Diseases from the Ministry of Health, Labor and Welfare of Japan.
All patients and control individuals had perceived adequate information concerning to this study according to the guidelines of the Declaration of Helsinki.
Results
We analyzed samples from 48 patients who fulfilled the clinicopathological and genetic criteria of MD. Of these 48 MD patients, 27 patients suffered from MELAS and carried the m.3243A>G mutation in mitochondrial DNA (mtDNA), with the exception of 3 patients whose molecular defects had not been identified. Eleven patients suffered from MELA and carried the m.3243A>G mutation. Three patients were diagnosed as LS, including 1 patient who exhibited a cytochrome c oxidase deficiency, 1 patient who carried the m.3243A>G mutation, and 1 patient who carried the m.8993T>C mutation. Two patients suffered from overlapping MELAS/LS and carried the m.3243A>G mutation, and 5 patients suffered from KSS and carried a common large deletion in mtDNA. The demographic characteristics of the patients in this study are shown in Table 1. We also recruited 149 healthy controls; however, 3 individuals were excluded because of abnormal thyroid function (Fig. 1B).
We evaluated the severity of each patient using two rating systems, the JMDRS9 and the NMDAS,10 as shown in Supplementary Table 1. The JMDRS has been used in a Japanese MELAS cohort study and has been demonstrated to be useful for the evaluation of disease progression at 5‐year intervals.9 Mean scores of MD patients on the JMDRS and the NMDAS are shown in Table 2.
Table 2.
JMDRS and NMDAS Scores for Each Mitochondrial Disorder
| N | JMDRS | Range | NMDAS | Range | |
|---|---|---|---|---|---|
| MELAS | 12 | 30.3 ± 17.7 | 4–60 | 36.0 ± 2 3.4 | 8–82 |
| MELA | 11 | 9.9 ± 9.4 | 0–27 | 12.6 ± 8.3 | 0–24 |
| KSS | 3 | 26.0 ± 18.4 | 5–39 | 45.7 ± 18.9 | 25–62 |
| Overlapping MELAS/LS | 2 | 15.0 ± 7.1 | 10–20 | 48.5 ± 10.1 | 41–56 |
| LS | 3 | 67.0 ± 15.7 | 56–85 | 94.7 ± 19.9 | 72–103 |
JMDRS = Japanese Mitochondrial Disease Rating Scale; KSS = Kearns‐Sayre syndrome; LS = Leigh syndrome; MELA = mitochondrial encephalopathy, lactic acidosis (mitochondrial myopathy); MELAS = mitochondrial encephalopathy, lactic acidosis, and stroke‐like episodes; NMDAS = Newcastle Mitochondrial Disease Rating Scale.
The concentrations of GDF‐15 and FGF‐21 did not differ by age, sex, or diurnal variation.12 The mean concentration of GDF‐15 and FGF‐21 is shown in Supplementary Table 2. The concentration range of GDF‐15 in the MD patients was substantially higher compared to the controls. GDF‐15 concentration did not overlap between MD patients and controls; however, FGF‐21 concentration occasionally overlapped. In contrast, the GDF‐15 reference range in healthy controls was markedly narrow, as shown in Figure 2. GDF‐15 concentration was higher in HF patients compared to controls; however, FGF‐21 was not different between the HF patients and controls. GDF‐15 and FGF‐21 concentrations were not significantly different between the DMD, the MS, optic neuritis, limbic encephalitis patients, and controls (Fig 3).
Figure 2.
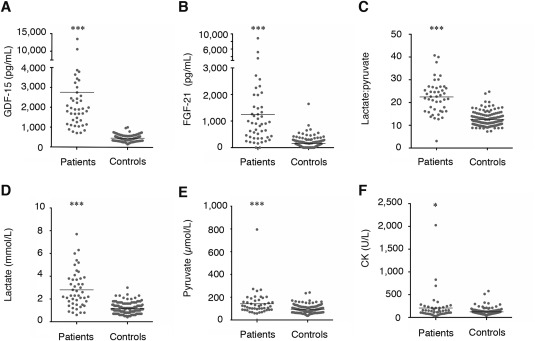
All biomarker concentrations for MDs and controls, and demography between MDs and non‐MDs patients. (A) GDF‐15, (B) FGF‐21, (C) lactate:pyruvate ratio, (D) lactate, (E) pyruvate, and (F) CK. MD patients exhibited significantly higher levels of all biomarkers compared to controls. CK = creatine kinase; FGF‐21 = fibroblast growth factor 21; GDF‐15 = growth differentiation factor 15; MD = mitochondrial disorder.
Figure 3.
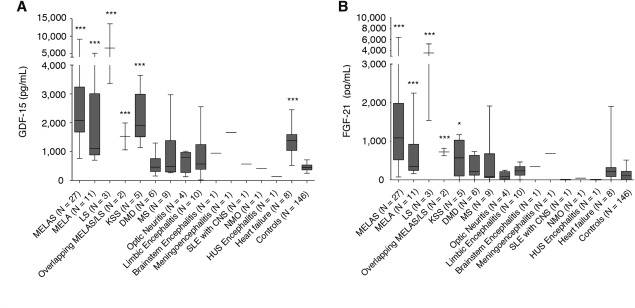
Comparison of biomarkers for MDs, and GDF‐15 and FGF‐21 concentrations for MDs and non‐MDs. GDF‐15 and FGF‐21 concentrations in the patients who suffered from MD subtypes, DMD, MS, optic neuritis, limbic encephalitis, brainstem encephalitis, menigoencephalitis, SLE with CNS, NMO, and HUS encephalitis, and HF, and the control group are shown. Each MD subtype displayed significantly higher levels of GDF‐15 and FGF‐21 than the control group. HF displayed significantly higher levels of only GDF‐15 than the control group. (A) GDF‐15 and (B) FGF‐21. CNS = central nervous system; DMD = Duchenne muscular dystrophy; FGF‐21 = fibroblast growth factor 21; GDF‐15 = growth differentiation factor 15; HUS = hemolytic uremic syndrome; KSS = Kearns‐Sayre syndrome; LS = Leigh syndrome; MD = mitochondrial disorder; MS = multiple sclerosis; MELA = mitochondrial encephalopathy, lactic acidosis (mitochondrial myopathy); MELAS = mitochondrial encephalopathy, lactic acidosis, and stroke‐like episodes; NMO = neuromyelitis optica; SLE = systemic lupus erythematosus.
Among the various MD subtypes, GDF‐15 and FGF‐21 concentrations were the highest in LS and were 10‐fold higher than controls. GDF‐15 and FGF‐21 concentrations in MELAS and MELA patients displayed broad distributions. GDF‐15 and FGF‐21 concentrations in KSS patients tended to be lower compared to LS, MELAS, and MELA patients; however, they were significantly higher than the controls (Supplementary Table 2).
The correlation coefficients between the concentrations of GDF‐15 and FGF‐21 and the JMDRS and NMDAS were positively correlated (GDF‐15: r = 0.76 [p < 0.001] for the JMDRS and r = 0.67 [p < 0.001] for the NMDAS; FGF‐21: r = 0.69 [p < 0.001] for the JMDRS and r = 0.59 [p < 0.001] for the NMDAS), as shown in Figure 4. The concentration of GDF‐15 and FGF‐21 were positively correlated (r = 0.64; p < 0.001), as shown in Figure 5.
Figure 4.
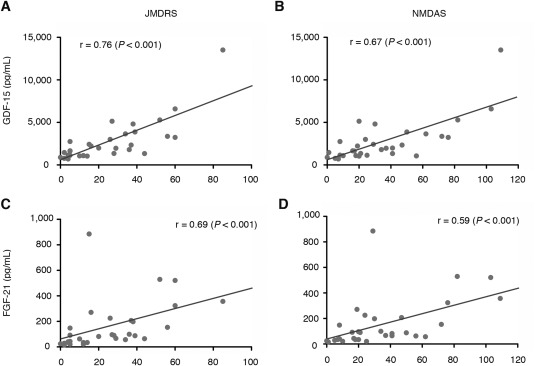
Correlation coefficients between levels of GDF‐15 and FGF‐21 and the JMDRS and NMDAS. GDF‐15 and FGF‐21 levels were positively correlated with the JMDRS and NMDAS: GDF‐15: r = 0.76 (A: p < 0.001) for the JMDRS and r = 0.67 (B: p < 0.001) for the NMDAS; FGF‐21: r = 0.69 (C: p < 0.001) for the JMDRS and r = 0.59 (D: p < 0.001) for the NMDAS. Spearman correlation coefficients were calculated for the statistical analysis. FGF‐21 = fibroblast growth factor 21; GDF‐15 = growth differentiation factor 15; JMDRS = Japanese Mitochondrial Disease Rating Scale; KSS = Kearns‐Sayre syndrome; LS = Leigh syndrome; MELA = mitochondrial encephalopathy, lactic acidosis (mitochondrial myopathy); NMDAS = Newcastle Mitochondrial Disease Adult Scale.
Figure 5.
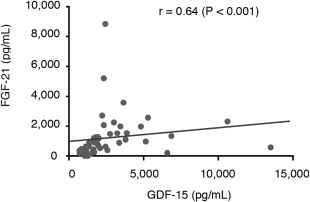
Correlation between GDF‐15 and FGF‐21 for MDs. GDF‐15 and FGF‐21 levels were positively correlated for mitochondrial disorders (MDs): r = 0.64 (p < 0.001). Spearman correlation coefficients were calculated for the statistical analysis. FGF‐21 = fibroblast growth factor 21; GDF‐15 = growth differentiation factor 15.
AUC analyses indicated that the sensitivity and specificity were significantly larger for GDF‐15 than those for FGF‐21, lactate, pyruvate, the L/P ratio, or CK. The AUC was 0.997 (95% CI: 0.993–1.000) for GDF‐15, 0.889 (95% CI: 0.837–0.962) for FGF‐21, 0.919 (95% CI: 0.865–0.973) for the L/P ratio, 0.882 (95% CI: 0.814–0.950) for lactate, 0.706 (95% CI: 0.614–0.798) for pyruvate, and 0.609 (95% CI: 0.506–0.711) for CK (Fig 6). Two correlated nonparametric AUCs were compared based on statistical analysis.11 AUC for GDF‐15 (0.997; standard error [SE] = 0.002) was significantly larger (p = 0.002) than in FGF‐21 (0.899; SE = 0.032) (difference: 0.098; Z‐test: 3.07; Pr >|Z|: 0.002).
Figure 6.
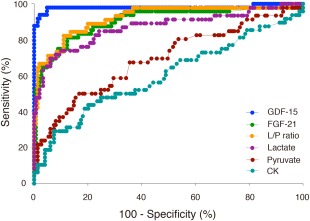
ROC curves for each biomarker in the MD patients. AUC values were 0.997 (95% confidence interval [CI]: 0.993–1.000) for GDF‐15, 0.919 (95% CI: 0.865–0.973) for the lactate‐to‐pyruvate ratio, 0.889 (95% CI: 0.837–0.962) for FGF‐21, 0.882 (95% CI: 0.814–0.950) for lactate, 0.706 (95% CI: 0.614–0.798) for pyruvate, and 0.609 (95% CI: 0.506–0.711) for creatine kinase (CK). AUC = area under the curve; FGF‐21 = fibroblast growth factor 21; GDF‐15 = growth differentiation factor 15; L/P ratio = lactate‐to‐pyruvate ratio; MD = mitochondrial disorder; ROC = receiver operating characteristic.
Based on our statistical analysis, we identified a threshold value of 710.0 pg/mL GDF‐15 to diagnose MDs. For FGF‐21, we also identified a threshold value of 350.0 pg/mL FGF‐21 to diagnose MDs. The threshold values for each biomarker were defined based on the central laboratory results as follows: 1.9 mmol/L lactate, 106.8 μmol/L pyruvate, L/P ratio of 30, and CK depending on the age group, as described in Supplementary Table 3. We identified a distribution of abnormal values of those biomarkers. Based on this analysis, sensitivities of GDF‐15 and FGF‐21 were 97.9% and 77.1%, respectively (p = 0.0063) and specificities of GDF‐15 and FGF‐21 were 95.2% and 87.7%, respectively (p = 0.0266). We tested cross‐validation for GDF‐15 and FGF‐21. The cross‐validated sensitivity and 1‐specificity for both biomarkers (N = 194) were the following: The error rates (proportion of incorrectly classified sample) of GDF‐15 were 4.6 ± 21.1% and FGF‐21 was 14.9 ± 35.7%.
The mean level and range of GDF‐15 in the controls are shown in Figure 7: a: 390 (SD not described; N = 29) pg/mL13; b: 267 ± 91.2 (N = 30) pg/mL14; c: 380.5 ± 160 (N = 37) pg/mL8; d: 463 (SD not described; N = 40) pg/mL15; e: 858.98 ± 431.45 (N = 21) pg/mL16; f: 276 ± 251 (N = 17) pg/mL17; g: 501 ± 183 (N = 31) pg/mL18; h: 540.09 (SD not described; N = 50) pg/mL.19 Our data of the mean level and range of GDF‐15 show as i: 462.5 ± 141.0 (N = 146) pg/mL.
Figure 7.
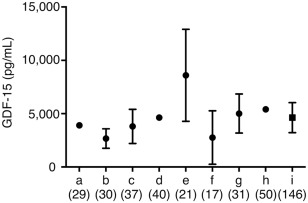
GDF‐15 concentrations in the healthy controls reported from literatures. GDF‐15 concentrations were recruited from literatures measured by the same ELISA kit (R&D Systems, Minneapolis, MN), that are a13, b14, c8, d15, e16, f17, g18, h19, and i (our data). Data are shown in mean ± standard deviation (SD). References of a13, d15, and h19 are not described in SD. The number in parenthesis shows sample number. Our GDF‐15 level in the healthy controls was similar to previous literatures.8, 13, 14, 15, 16, 17, 18, 19 GDF‐15 = growth differentiation factor 15.
The ID number, mean age, mean BMI, and % males for the controls, MD patients, and disease controls are presented in Table 1 and Supplementary Table 1.
Discussion
In this study, we have shown that GDF‐15 appears to serve as a sensitive and specific biomarker for the diagnosis and/or the monitoring of disease progression of MDs in adults and children. GDF‐15 exhibited greater sensitivity and specificity than FGF‐21. FGF‐21 has been reported to be a useful biomarker for muscle‐manifesting MDs3; however, there were many overlapping values between controls and MD patients in our data. Because a moderate increase in FGF‐21 concentration has been reported in a cachexic child with progeria,3 further investigation is required to investigate the specific conditions that induce FGF‐21 secretion. GDF‐15 has also been reported to be a useful biomarker for monitoring the state of HF, renal failure, and certain cancers. The confounding factors that modulate the concentrations of GDF‐15 and FGF‐21 remain to be identified. When non‐MD patients were complicated with HF and/or renal failure, the concentration of GDF‐15 was elevated in the range of lower values of those observed in MD patients without heart and/or renal failure. However, we can distinguish easily between non‐MD patients with HF and/or renal failure, and MDs without those complication, by the information of clinical findings and laboratory data, such as creatinine, blood urea nitrogen, and brain natriuretic peptide. On the other hand, diseases for similar clinical manifestations with MDs, such as DMD, MS, optic neuritis, and limbic encephalitis, are often difficult to distinguish from MDs even using routine laboratory data. In these clinical conditions, we believe that we can distinguish MD patients from patients with MD‐like symptoms by evaluation of GDF‐15.
In general, LS is clinically recognized as the most severe phenotype of the MD subtypes examined in this study because LS patients typically die before 10 years of age. According to both scaling system scores, LS displayed the highest scores of all examined MD subtypes. The mean level of GDF‐15 in LS patients was the highest of all MD patients. All LS patients in this study were in a bed‐ridden state, whereas the clinically diagnosed MELAS patients exhibited a variety of disease severities that ranged from normal function, easy fatigability, severe myopathy with sensorineural hearing loss, and diabetes mellitus to bed‐ridden (terminal stage). On the other hand, we believe that MELA and KSS patients typically maintain normal or subnormal states with respect to the activities of daily living compared with LS and MELAS patients.
The correlations between the JMDRS and NMDAS scores and the GDF‐15 and FGF‐21 concentrations are shown in Figure 4. The scores according to both scale systems were the highest for LS; these scores are strongly influenced by clinical severity, and LS displayed the most severe phenotype in our study. The LS patients in our study were bed‐ridden and tube‐fed. In contrast, the scores for MELAS patients were highly variable for both scales and were lower than those for LS, but higher than those for KSS and MELA. The clinical scores of MELAS Patients 17 and 18, who were in the bed‐ridden stage, were high on both the JMDRS and the NMDAS, which is consistent with the levels of GDF‐15 and FGF‐21. The overlapping MELAS/LS patients displayed highly variable scores among individuals. Thus, GDF‐15 and FGF‐21 may serve as quantitative biomarkers.
These results demonstrate that GDF‐15 is the most useful biomarker for MDs compared with FGF‐21, lactate, pyruvate, the L/P ratio, and CK. GDF‐15 may serve as a useful tool to quantitatively monitor disease severity of our indexed MD subtypes.
GDF‐15 is a more useful biomarker for muscle‐related MDs because of its substantially higher sensitivity and specificity than FGF‐21 and other conventional biomarkers. FGF‐21 was the best biomarker for muscle‐manifested MDs, as reported in 2011.3 We originally used FGF‐21 as a primary screening test for MDs; however, it was occasionally difficult to distinguish MD patients from non‐MD individuals based on FGF‐21 values because the reference range of FGF‐21 was broad. In contrast, the reference range of GDF‐15 was narrow and rarely overlapped between MD patients and non‐MD individuals (Fig 2). Our reference range of GDF‐15 was in accord with previous studies (Fig 7). GDF‐15 may be especially useful for the diagnosis of LS and KSS because serum lactate is rarely elevated in these MDs.1 The present results revealed that GDF‐15 was significantly elevated in MD patients, which is consistent with our recent report.6
GDF‐15 appeared to increase with the clinical severity of the MD (Fig 4). In general, MD severity is ranked in the following order: LS, overlapping MELAS/LS, MELAS, KSS, and MELA. In our study, mean GDF‐15 levels were ranked in the following order: LS, MELAS, KSS, overlapping MELAS/LS, and MELA. These results suggest that GDF‐15 may serve as a useful biomarker not only for the diagnosis, but also the determination of severity of MDs. GDF‐15 may be potentially as useful as FGF‐21 for the evaluation of drug efficacy; however, it should be verified by longitudinal studies in future.
The AUC was significantly larger for GDF‐15 (0.997) compared with the conventional MD biomarkers, including FGF‐21 (Fig 5). Our study demonstrated that the AUC was also larger for FGF‐21 (0.889) compared with the other conventional MD biomarkers; however, the AUC was slightly larger for the L/P ratio (0.917) than for FGF‐21 (0.889). The AUC for the L/P ratio (0.917) was within the 95% CI of a previous study (0.82–0.98).3 The AUC for sFGF‐21 (0.889) was not within the 95% CI of a previous study (0.94–0.99).3 The calculated threshold values of GDF‐15 and FGF‐21 were 707.0 and 343.8 pg/mL, respectively. We evaluated the threshold values of 710.0 and 350.0 pg/mL for GDF‐15 and FGF‐21, respectively. The sensitivity and specificity of GDF‐15 were 97.9% and 95.2%, respectively, and were substantially higher than FGF‐21, which were 77.1% and 87.7%, respectively. Ultimately, GDF‐15 was a more useful biomarker than FGF‐21 whether we used our or other threshold values. The AUC was higher for FGF‐21 than for the L/P ratio in a previous study3; however, the AUC was comparable between FGF‐21 and the L/P ratio in our study. We hypothesized that these differences in the AUC for FGF‐21 were because of the different MDs and ages. Our MD patients were primarily typical and classical, and the FGF‐21 levels may be lower in our study than in the previous study.3 However, the patients in the previous study were classified as MELAS, Alpers syndrome, MIRAS, and others; moreover, 26 of the 67 (38.8%) MD patients were children.3 In our study, 12 of the 48 (25%) MD patients were children. The child MD patients exhibited higher FGF‐21 levels in both our study (LS and MELAS/LS overlapping) and the previous study (Alpers syndrome and patients with mtDNA mutations).3 Further assessment of the various MD subtypes is required.
On the other hand, GDF‐15 in HF patients was significantly elevated compared to controls as well as MDs. However, FGF‐21 in HF patients was not significantly elevated with controls. It is indicated that only GDF‐15 does not completely distinguish HF with MDs from HF without MDs. We calculated that GDF‐15 and FGF‐21 were combined to analyze the severity and sensitivity for MDs, however, the severity and sensitivity in MDs were lower in combination than only GDF‐15 (data not shown). Furthermore, the patients' number was too small to evaluate the severity and sensitivity.
The mechanism of elevation of GDF‐15 is not clear in MDs patients. ATF4 is a master regulator of upstream of stress signals.20 GDF‐15 was upregulated by ATF4 in mouse embryonic fibroblast.21 FGF‐21 was also induced by ATF4 in mouse.22, 23, 24 We revealed that GDF‐15 and FGF‐21 were elevated in MDs compared to controls, and both GDF‐15 and FGF‐21 levels were correlated with MDs. Therefore, we suggested that the mechanism of elevation of GDF‐15 in MDs is derived from ATF4 signaling and occurred from various stresses during mitochondrial dysfunctions. More investigations are requested to clarify what kinds of interactions exist in the disease condition such as HF, kidney disease, and cancers.
In conclusion, our data suggest that the measurement of GDF‐15 in combination with FGF‐21 by ELISA serves as the most useful first‐line test in patients with suspected MDs to prioritize patients for muscle biopsy. Using new biomarkers, we may be able to diagnose MDs at a nonspecialist hospital and reduce the unnecessary invasive biopsy procedures in children and adults.
Authorship
Conception and design of the study: SY, YF, TK, MI, MT, YK. Acquisition, analysis & interpretation of data: SY, AI, YF, HA, TK, MT, RS, YK. Drafting the manuscript: SY, YF, TK, MI, MT, TK, MT, RS, YK.
Potential Conflicts of Interest
The authors declare that there is no conflict of interests regarding the publication of this paper.
Supporting information
Additional supporting information can be found in the online version of this article.
Supporting Information
Supporting Information
Supporting Information
Acknowledgment
This work was supported, in part, by grant nos. 25461571 (to Y.K.), 25860891 (to S.Y.), and 25242062 (to M.T.) from the Ministry of Education, Culture, Sports, Science and Technology (MEXT) and by Grant‐in‐Aid no. 24‐Nanchi‐Ippan‐005 (to Y.K.) for Research on Intractable Diseases from the Ministry of Health, Labor and Welfare of Japan. This research is (partially) supported by the intractable/rare disorders no. 15ek0109088h0001 (to Y.K.) from Japan Agency for Medical Research and development, AMED.
We thank Dr S. Kinjo for recruiting 1 MD patient, E. Tanamachi and K. Murakami for collecting control samples, and Drs Y. Sugi and K. Mawatari for recruiting all HF patients. We also thank all patients and control individuals. We thank E. Tanamachi for technical support regarding the measurement of GDF‐15 and FGF‐21.
Patent
M.T., Y.F., M.I., and Y.K. have a patent PCT/JP2015/50833 issued. A patent is pending for the usefulness of GDF‐15 for the biomarker of mitochondrial disorders. Patent rights are assigned to the Tokyo Metropolitan Institute of Gerontology and Kurume University.
References
- 1. Haas RH, Parikh S, Falk MJ, et al. Mitochondrial disease: a practical approach for primary care physicians. Pediatrics 2007;120:1326–1333. [DOI] [PubMed] [Google Scholar]
- 2. Munnich A, Rotig A, Chretien D, et al. Clinical presentation of mitochondrial disorders in childhood. J Inherit Metab Dis 1996;19:521–527. [DOI] [PubMed] [Google Scholar]
- 3. Suomalainen A, Elo JM, Pietiläinen KH, et al. FGF‐21 as a biomarker for muscle‐manifesting mitochondrial respiratory chain deficiencies: a diagnostic study. Lancet Neurol 2011;10:806–818. [DOI] [PMC free article] [PubMed] [Google Scholar]
- 4. Davis RL, Liang C, Edema‐Hildebrand F, et al. Fibroblast growth factor 21 is a sensitive biomarker of mitochondrial disease. Neurology 2013;81:1819–1826. [DOI] [PubMed] [Google Scholar]
- 5. Liang C, Ahmad K, Sue CM. The broadening spectrum of mitochondrial disease: shifts in the diagnostic paradigm. Biochim Biophys Acta 2014;1840:1360–1367. [DOI] [PubMed] [Google Scholar]
- 6. Fujita Y, Ito M, Kojima T, et al. GDF15 is a novel biomarker to evaluate efficacy of pyruvate therapy for mitochondrial diseases. Mitochondrion 2014;20:34–42. [DOI] [PubMed] [Google Scholar]
- 7. Lindahl B. The story of growth differentiation factor 15: another piece of the puzzle. Clin Chem 2013;59:1550–1552. [DOI] [PubMed] [Google Scholar]
- 8. Kalko SG, Paco S, Jou C, et al. Transcriptomic profiling of TK2 deficient human skeletal muscle suggests a role for the p53 signalling pathway and identifies growth and differentiation factor‐15 as a potential novel biomarker for mitochondrial myopathies. BMC Genomics 2014;15:91. [DOI] [PMC free article] [PubMed] [Google Scholar]
- 9. Yatsuga S, Povalko N, Nishioka J, et al. MELAS: a nationwide prospective cohort study of 96 patients in Japan. Biochim Biophys Acta 2012;1820:619–624. [DOI] [PubMed] [Google Scholar]
- 10. Schaefer AM, Phoenix C, Elson JL, et al. Mitochondrial disease in adults: a scale to monitor progression and treatment. Neurology 2006;66:1932–1934. [DOI] [PubMed] [Google Scholar]
- 11. Delong ER, Delong DM, Clarke‐Pearson DL. Comparing the area under two or more correlated receiver operating characteristic curves: a non parametric approach. Biometrics. 1988;44:837–845. [PubMed] [Google Scholar]
- 12. Cantó C, Auwerx J. FGF21 takes a fat bite. Science 2012;336:675–676. [DOI] [PMC free article] [PubMed] [Google Scholar]
- 13. Lambrecht S, Smith V, De Wilde K, et al. Growth differentiation factor 15, a marker of lung involvement in systemic sclerosis, is involved in fibrosis development but is not indispensable for fibrosis development. Arthritis Rheumatol 2014;66:418–427. [DOI] [PubMed] [Google Scholar]
- 14. Yang CZ, Ma J, Luo QQ, et al. Elevated level of serum growth differentiation factor 15 is associated with oral leukoplakia and oral squamous cell carcinoma. J Oral Pathol Med 2014;43:28–34. [DOI] [PubMed] [Google Scholar]
- 15. Cui R, Gale RP, Zhu G, et al. Serum iron metabolism and erythropoiesis in patients with myelodysplastic syndrome not receiving RBC transfusions. Leuk Res 2014;38:545–550. [DOI] [PMC free article] [PubMed] [Google Scholar]
- 16. Tarkun P, Mehtap O, Atesoglu EB, et al. Serum hepcidin and growth differentiation factor‐15 (GDF‐15) levels in polycythemia vera and essential thrombocythemia. Eur J Haematol 2013;91:228–235. [DOI] [PubMed] [Google Scholar]
- 17. Shalev H, Phillip M, Galil A, et al. High levels of soluble serum hemojuvelin in patients with congenital dyserythropoietic anemia type I. Eur J Haematol 2013;90:31–36. [DOI] [PubMed] [Google Scholar]
- 18. Schiegnitz E, Kammerer PW, Koch FP, et al. GDF 15 as an anti‐apoptotic, diagnostic and prognostic marker in oral squamous cell carcinoma. Oral Oncol 2012;48:608–614. [DOI] [PubMed] [Google Scholar]
- 19. Santhanakrishnan R, Chong JPC, Ng TP, et al. Growth differentiation factor 15, ST2, high‐sensitivity troponin T, and N‐terminal pro brain natriuretic peptide in heart failure with preserved vs. reduced ejection fraction. Eur J Heart Fail 2012;14:1338–1347. [DOI] [PubMed] [Google Scholar]
- 20. Harding HP, Zhang Y. Zeng H, et al. An integrated stress response regulates amino acid metabolism and resistance to oxidative stress. Mol Cell 2003;11:619–633. [DOI] [PubMed] [Google Scholar]
- 21. Jousse C, Deval C, Maurin AC, et al. TRB3 inhibits the transcriptional activation of stress‐regulated genes by a negative feedback on the ATF4 pathway. J Biol Chem 2007;282:15851–15861. [DOI] [PubMed] [Google Scholar]
- 22. De Sousa‐Coelho AL, Marrero PF. Haro D. Activating transcription factor 4‐dependent induction of FGF21 during amino acid deprivation. Biochem J 2012;443:165–171. [DOI] [PubMed] [Google Scholar]
- 23. Jiang S, Yan C. Fang QC, et al. Fibroblast growth factor 21 is regulated by the IRE1α‐XBP1 branch of the unfolded protein response and counteracts endoplasmic reticulum stress‐induced hepatic steatosis. J Biol Chem 2014;289:29751–29765. [DOI] [PMC free article] [PubMed] [Google Scholar]
- 24. Kim KH, Jeong YT, Kim SH, et al. Metformin‐induced inhibition of the mitochondrial respiratory chain increases FGF21 expression via ATF4 activation. Biochem Biophys Res Commun 2013;440:76–81. [DOI] [PubMed] [Google Scholar]
Associated Data
This section collects any data citations, data availability statements, or supplementary materials included in this article.
Supplementary Materials
Additional supporting information can be found in the online version of this article.
Supporting Information
Supporting Information
Supporting Information


