Figure 6.

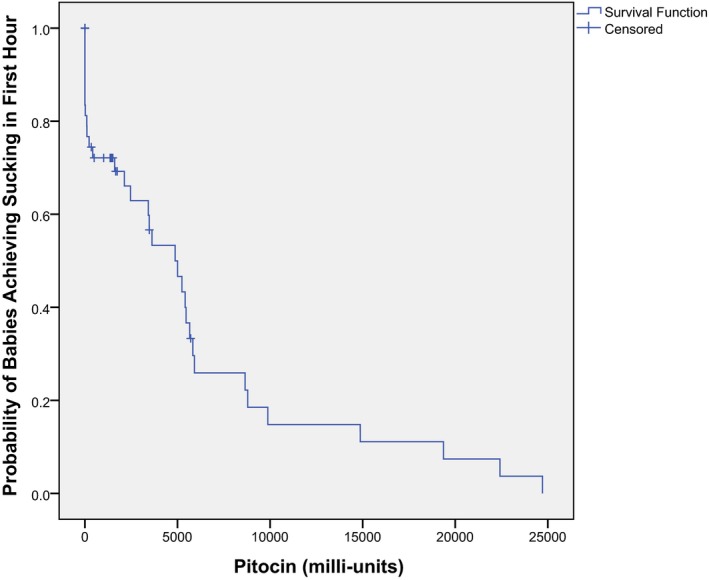
Kaplan–Meier curve comparing the amount of synOT to the progression of suckling by the baby during the first hour, LLUMC, 2012. Note: The majority of these dyads also had exposure to fentanyl.

Kaplan–Meier curve comparing the amount of synOT to the progression of suckling by the baby during the first hour, LLUMC, 2012. Note: The majority of these dyads also had exposure to fentanyl.