

Abstract
Transcranial alternating current stimulation (tACS) has emerged as a promising tool for manipulating ongoing brain oscillations. While previous studies demonstrated frequency‐specific effects of tACS on diverse cognitive functions, its effect on neural activity remains poorly understood. Here we asked how tACS modulates regional fMRI blood oxygenation level dependent (BOLD) signal as a function of frequency, current strength, and task condition. TACS was applied over the posterior cortex of healthy human subjects while the BOLD signal was measured during rest or task conditions (visual perception, passive video viewing and motor task). TACS was applied in a blockwise manner at different frequencies (10, 16, 60 and 80 Hz). The strongest tACS effects on BOLD activity were observed with stimulation at alpha (10 Hz) and beta (16 Hz) frequency bands, while effects of tACS at the gamma range were rather modest. Specifically, we found that tACS at 16 Hz induced BOLD activity increase in fronto‐parietal areas. Overall, tACS effects varied as a function of frequency and task, and were predominantly seen in regions that were not activated by the task. Also, the modulated regions were poorly predicted by current density modeling studies. Taken together, our results suggest that tACS does not necessarily exert its strongest effects in regions below the electrodes and that region specificity might be achieved with tACS due to varying susceptibility of brain regions to entrain to a given frequency. Hum Brain Mapp 37:94–121, 2016. © 2015 The Authors. Human Brain Mapping Published by Wiley Periodicals, Inc
Keywords: tACS, brain stimulation, fMRI, oscillations
INTRODUCTION
In recent years, transcranial electrical stimulation (tES) techniques have emerged that offer the possibility of interacting with different brain functions in a noninvasive manner. Transcranial alternating current stimulation (tACS) is one of these techniques which have been shown to modulate oscillatory rhythms in the brain by synchronizing or desynchronizing neuronal networks [Reato et al., 2013]. Cellular recordings in animals and electroencephalography (EEG) studies in humans have shown that tACS interacts with ongoing neural oscillations [Ali et al., 2013; Helfrich et al., 2014a; Ozen et al., 2010; Zaehle et al., 2010]. There is a growing body of literature showing frequency‐specific modulatory effects of tACS on a wide range of brain functions including motor performance [Feurra et al., 2013; Joundi et al., 2012; Wach et al., 2013], memory [Polania et al., 2012], problem solving [Santarnecchi et al., 2013], somatosensory [Feurra et al., 2011], and visual perception [Cabral‐Calderin et al., 2015; Kanai et al., 2008; Kar and Krekelberg, 2014; Laczo et al., 2012; Struber et al., 2014]. TACS has also proven therapeutic potential for the treatment of neurological deficits such as tremor in patients with Parkinson's disease and post‐stroke recovery [Brittain et al., 2013; Fedorov et al., 2010]. However, although tACS is a promising tool to investigate the causal relationship between oscillatory activity and different brain functions and to treat specific symptoms of neurological diseases, its neuronal effects remain poorly understood.
A proper understanding of how tACS influences neuronal activity is a prerequisite for predicting its behavioral effects. It is common practice in the field of tES to place the electrodes above the regions that are aimed to be stimulated. However, previous intracranial recordings in rats showed that tACS‐induced entrainment of neuronal activity occurs not only via direct stimulation but also via secondary recruitment of neurons in distant areas, most likely by means of polysynaptic connections [Ozen et al., 2010]. Thus, without concurrent brain activity measures, tACS‐induced behavioral changes can only be interpreted with caution and a direct link between a potentially stimulated brain region and the observed behavioral effect cannot be firmly established.
Studies modeling the electric field distribution are helpful for optimizing the stimulation protocol at the individual level [Neuling et al., 2012; Ruffini et al., 2014]; however, they cannot reflect the full complexity of the effect of tACS. Important factors that influence tACS efficacy such as frequency, task demands, or brain state, cannot be evaluated with electrical field modeling approaches alone. In this context, studies using electrical stimulation would benefit from combining the latter technique with methods that provide some measure of brain activity.
Concurrent tACS and brain activity measurements have mainly been conducted with EEG [Helfrich et al., 2014a; Zaehle et al., 2010]. However, the spatial resolution of EEG is poor and activity within sulci and subcortical brain structures cannot be evaluated [Herrmann et al., 2013]. In the present study, we combined tACS with functional magnetic resonance imaging (fMRI) as a tool to investigate the regional‐ and frequency‐specific effects of tACS under different task conditions. More specifically, we asked whether tACS modulates blood oxygenation level dependent (BOLD) activity in a frequency‐, state‐, and/or task‐dependent manner. We used a conventional electrode montage similar to the montages frequently used in the studies evaluating the clinical and behavioral effects of tACS [Brittain et al., 2013; Cabral‐Calderin et al., 2015; Fedorov et al., 2010; Feurra et al., 2011, 2013; Helfrich et al., 2014a; Joundi et al., 2012; Kanai et al., 2008; Kar and Krekelberg, 2014; Laczo et al., 2012; Polania et al., 2012; Santarnecchi et al., 2013; Wach et al., 2013] with the goal of evaluating the effects of tACS designs that have proven to exert behavioral and electrophysiological effects. Three different sets of experiments are presented in which tACS was applied at 10 Hz (alpha), 16 Hz (beta), 60 Hz or 80 Hz (gamma). These frequencies were chosen based on the most commonly used tACS frequencies in behavioral studies, showing effects of tACS at the alpha band on visual performance [Helfrich et al., 2014a; Kar and Krekelberg, 2014], effects of tACS at the beta band on motor performance [Feurra et al., 2013], and effects of tACS at the gamma band on visual perception [Cabral‐Calderin et al., 2015; Laczo et al., 2012; Struber et al., 2014].
A previous study modeling the electric field distribution with a similar electrode montage to the one we used here, proposed that the current density should be highest in occipital and parietal cortices [Neuling et al., 2012]. In addition, a previous study combining tACS with EEG using a similar montage has reported an increase of alpha power in regions close to the stimulation electrodes [Helfrich et al., 2014a]. On the basis of these studies we expected that the strongest effects of tACS with our electrode montage would be observed in occipital and parietal cortices.
Because previous combined EEG/brain imaging studies have shown that increased alpha and beta power correlates with metabolic deactivation [Laufs et al., 2003; Moosmann et al., 2003; Ritter et al., 2009; Scheeringa et al., 2011], we anticipated that any modulation of brain activity due to tACS‐induced oscillatory entrainment at alpha or beta frequencies would result in a decrease of the BOLD signal. Conversely, we expected tACS at gamma frequencies to result in an increase in the BOLD signal due to positive correlations reported between gamma power and BOLD activity [Logothetis et al., 2001; Magri et al., 2012; Niessing et al., 2005].
MATERIALS AND METHODS
Experiment 1 (E1). Effect of tACS on the BOLD Signal at Rest and During a Visual Perception Task
Participants
Thirteen subjects (seven females, mean age 30.5 ± 6.4 years) with normal or corrected‐to‐normal vision and without history of neurological or psychiatric disease took part in the study. All subjects gave written informed consent. All procedures were performed according to the declaration of Helsinki and were approved by the local Ethics Committee of the University Medical Center Göttingen. Apart from one author (YCC), subjects were naive to the purpose of the experiments and were paid for their participation.
Transcranial alternating current stimulation (tACS)
TACS was applied via a pair of MR‐compatible conductive rubber electrodes attached to the participants head with electrode paste (Weaver and Company, Aurora, CO). The electrodes were connected to a battery‐driven MR compatible Eldith DC‐stimulator Plus (NeuroConn GmbH, Ilmenau, Germany). The DC‐stimulator was placed outside the magnet room and was connected to the electrodes via a cable running through a radio frequency filter tube in the cabin wall. Two filter boxes were placed between the stimulator and the electrodes [Antal et al., 2011, 2014]. This stimulation setup has been previously evaluated by Antal et al. [2014] where no net effect of tACS on the MRI signal in post‐mortem subjects was found. Additional phantom experiments (data not shown) were conducted to assure that our experimental setup was not inducing artifacts in the measured signal in any of the conditions evaluated in our experiments. Results showed that the electrodes/conductive cream placement induced a drop (about 20%) in the temporal signal‐to‐noise ratio (tSNR) in a region below the electrodes. In addition, the tACS setup connected to the outside of the scanner room induced a drop (about 5%) in the general tSNR compared to measuring the phantom alone (no tACS setup). However, no additional alterations in the tSNR were observed when comparing between tACS setup connected to the outside of the scanner room with the stimulator powered off, stimulator on in stand‐by and stimulator applying tACS. Note that in all the experiments included in this manuscript the tACS setup remained connected to the stimulator powered on all the time. Therefore, we consider that tACS‐induced artifacts do not affect the reported difference between tACS‐on/off periods.
A small target electrode (round electrode, 16 cm2) was placed over the inion (Oz), as determined by the International 10–20 EEG system. The second electrode was positioned over the vertex (Cz) and was larger than the inion electrode (square electrode, 35 cm2) in order to reduce current density and limit stimulation effects under its surface in comparison with the inion electrode. The stimulation site was chosen to induce oscillations bilaterally in the occipital cortex, reaching up to parietal cortices [Neuling et al., 2012] (Supporting Information Fig. S1). TACS was applied at 10, 60, and 80 Hz, respectively, for 30 s. The waveform of the stimulation was sinusoidal without DC offset. The current was fixed to 1,500 µA (peak‐to‐peak), resulting in a mean current density (peak‐to‐peak) of 0.094 mA cm−2 under the Oz electrode and 0.043 mA cm−2 under the Cz electrode. The current was ramped up and down over 1 s. Impedance was kept below 20 kΩ (the MR‐compatible stimulation setup has a minimum possible impedance of 11.8 kΩ).
Functional magnetic resonance imaging (fMRI)
Experimental setup and design
Subjects were placed in the MR scanner in a supine position, wearing foam ear plugs for noise protection. Cushions were used to minimize head movements. Visual stimuli were presented using MR‐compatible liquid crystal display goggles (Resonance Technology, Northridge, CA). The spatial resolution was 800 × 600 pixels, covering a visual field of 32 × 24 degrees. The refresh rate was 60 Hz. Eye position was monitored using an MR compatible eye tracking system (Arrington Research, Scottsdale, AZ). We used the Presentation® software [Neurobehavioral Systems, Berkeley, CA (Version 14.9, http://www.neurobs.com)] to synchronize stimulus presentation to the MRI scanning and to trigger tACS during fMRI.
Behavioral and tACS paradigm
Effect of tACS on the BOLD signal during rest (E1.1)
From the thirteen subjects that participated in the experiment, one subject was excluded from the final analysis due to excessive motion in the scanner (see fMRI Data Analysis. E1.1 section). Subjects participated in one fMRI session where tACS was applied during rest, i.e., without any other task instruction than to look at a fixation cross presented in the middle of the screen (in order to reduce eye movements) (Fig. 1A). Six functional runs were collected in each session. Each functional run lasted 7 min and 22 s where subjects received tACS for periods of 30 s interleaved with similar periods without tACS (the last tACS‐on/off period of each run lasted only for 22 s) (Fig. 1A). It was determined in a pseudorandomized manner whether the run started with a tACS‐on or tACS‐off period. Two contiguous runs were implemented for each frequency and its order was pseudorandomized between subjects. In total, 15 periods of 30 s tACS‐on and tACS‐off were recorded for each tACS frequency per subject.
Figure 1.
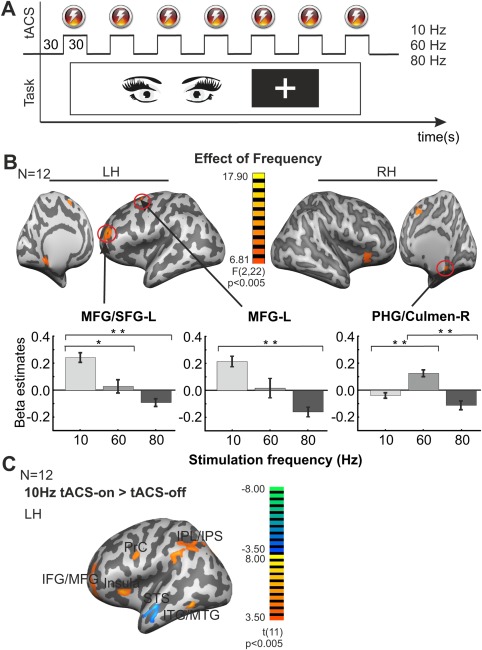
Effect of tACS on the BOLD signal during rest. (A) Schematic representation of the paradigm used in Experiment 1.1. Subjects had to maintain fixation on a cross in the middle of the screen. During each run, periods of 30 s with tACS‐on (at 10, 60 or 80 Hz) or without tACS were interleaved. (B) F‐score maps showing the regions that revealed significant effect of frequency in the one way rANOVA [within‐subjects factor: frequency (10, 60 and 80 Hz)]. The bar graphs show the beta estimates extracted from each region for each tACS frequency. Error bars indicate SEM across observers. The significant difference for the different post‐hoc paired t test comparisons are marked with continuous lines. *P < 0.05, **P < 0.01. (C) T‐score maps showing BOLD activity changes during 10 Hz tACS when compared with tACS‐off (tACS‐on > tACS‐off). The effect of 60 and 80 Hz tACS was almost absent. Maps were thresholded using clusters determined by P < 0.005 and a corrected cluster significance threshold of P < 0.05. Talairach coordinates for the peak activation voxels for all clusters are listed in Table 1. LH = left hemisphere; RH = right hemisphere.
Effect of tACS on the BOLD signal during a visual perception task (E1.2)
From the thirteen subjects that participated in the experiment, one subject was excluded from the final analysis due to excessive motion in the scanner (a different subject than the one excluded from the analysis in E1.1). The experiment was conducted as described for E1.1 but in this case, participants performed a structure from motion (SfM) task. Stimuli were generated using MATLAB, version R2011b (The MathWorks, Natick, MA), and were presented using the Presentation® software. Two fields of moving dots (width and height, 8.0°, 400 dots), creating the illusion of a sphere rotating in depth around its vertical axis, were constructed. One field of dots moved to the right as the other field moved to the left. All dots were equal in luminance, making the rotational direction ambiguous. The sphere could be perceived to rotate rightwards or leftwards reversing direction spontaneously over time. Individual dots measured 4.2 arcmin in width and height. An example for such a SfM stimulus can be found at: http://www.michaelbach.de/ot/col_equilu/. The angular velocity of the dots was 18° s−1. Every functional run started with a 10‐s fixation cross, after which the rotating sphere was presented three times for 2 min, separated by a 20‐s period with only the fixation cross. The 2 min during which the rotating sphere was presented were divided into alternating periods of 30 s with tACS‐on or tACS‐off (Fig. 2A). Subjects had to maintain fixation and to report whether the sphere appeared to rotate rightwards or leftwards by pressing an assigned button. Each frequency was tested in a separate session in which six functional runs (7 min length) were collected. Stimulation frequencies and tACS‐on/tACS‐off order were randomized between participants and within sessions, respectively. Subjects participated in three sessions. In total, 36 periods of 30 s tACS‐on and tACS‐off were recorded for each tACS frequency.
Figure 2.
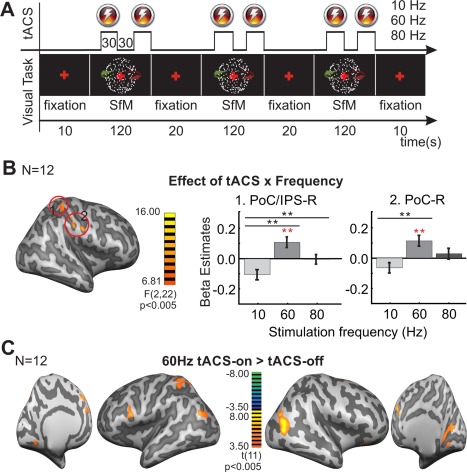
Effect of tACS on the BOLD signal in a visual perception task. (A) Schematic representation of the task used in Experiment 1.2. Within one fMRI run, the visual stimulus was presented three times for 120 s. The visual stimulus presentation was interleaved with resting periods, during which only the fixation cross remained on the screen. Stimulus presentation periods were divided into periods of 30 s with tACS‐on (at 10, 60, or 80 Hz) or tACS‐off. Subjects had to maintain fixation and to report rotation direction of the visual stimulus. (B) F‐score map showing regions with significant interaction tACS × frequency in the two ways rANOVA [within factors: tACS (on/off); tACS frequency (10, 60, and 80 Hz)]. The bar graphs show the difference (tACS‐on) − (tACS‐off) in the beta estimates extracted from two representative regions (numbered in the maps) showing significant interaction of tACS × frequency. Error bars indicate SEM across observers. The significant difference for the different post‐hoc comparisons are marked with continuous lines. Black * indicate the post‐hoc comparison for the interaction effect 10 Hz (tACS‐on vs. tACS‐off) vs. 60 Hz (tACS‐on vs. tACS‐off) and 10 Hz (tACS‐on vs. tACS‐off) vs. 80 Hz (tACS‐on vs. tACS‐off). Red * indicate the comparisons tACS‐on > tACS‐off **P < 0.01 (C) T‐score maps showing BOLD activity changes during 60 Hz tACS‐on when compared with the tACS‐off condition. The effect of 10 and 80 Hz tACS was almost absent. Maps were thresholded using clusters determined by P < 0.005 and a corrected cluster significance threshold of P < 0.05. Talairach coordinates for the peak activation voxels for all clusters are listed in Table 2. LH = left hemisphere; RH = right hemisphere.
Data acquisition
All images were acquired using a 3 Tesla Magnetom TIM Trio scanner (Siemens Healthcare, Erlangen, Germany) with a 12‐channel phased‐array head coil. First, a high‐resolution T1‐weighted anatomical scan (three‐dimensional (3D) turbo fast low angle shot, echo time (TE): 3.26 ms, repetition time (TR): 2,250 ms, inversion time: 900 ms, flip angle 9°, isotropic resolution of 1 × 1 × 1 mm3) was obtained. All functional data were acquired using T2*‐weighted gradient‐echo echo‐planar imaging (TE: 30 ms, TR: 2,000 ms, flip angle 70°, 33 slices of 3‐mm thickness, no gap between slices at an in‐plane resolution of 3 × 3 mm2). Four dummy scans were added at the beginning of each run to allow for T1‐equilibrium. A total of 221 whole brain volumes were acquired in each functional run for Experiment 1.1 and 210 for Experiment 1.2. Each subject underwent four fMRI sessions (one session rest condition, three sessions visual perception task).
fMRI data analysis
BrainVoyager QX Software version 2.8 (Brain Innovation, Maastricht, The Netherlands), and the Neuroelf 0.9c toolbox for Matlab (retrieved from http://neuroelf.net/) were used for the preprocessing and analysis of the functional data. Standard preprocessing steps included 3D motion correction, slice scan time correction and temporal filtering [linear trend removal and high pass filtering (2 cycles/run)]. The functional data were coregistered to the anatomical reference scans, transformed into Talairach space and spatially smoothed with a Gaussian kernel (full width at half maximum 8 × 8 × 8 mm3).
E1.1
To investigate the effect of the different tACS frequencies, three box‐car predictors modeling the 30 s tACS‐on periods for the different tACS frequencies were defined (10 Hz tACS‐on, 60 Hz tACS‐on and 80 Hz tACS‐on). Predictors were convolved with BrainVoyager's standard 2‐gamma hemodynamic response function. To evaluate motion artifacts a framewise displacement (FD) index was calculated by summing the absolute values of the differentials of the six head realignment estimates obtained from the rigid body head‐motion correction (three translation (x, y, z) and three rotation (x, y, z) parameters, rotation angles were transformed to mm on a 50‐mm sphere according to Power et al. [2012]). A temporal mask was created with all data points whose FD exceeded a 0.5‐mm cutoff. This mask was augmented by adding the data point preceding and the two data points succeeding all masked data points. The influence of the masked data points was removed at the level of the general linear model (GLM) by including a separate confound predictor for each data point in the mask (“motion scrubbing”). To further reduce the influence of motion artifacts, i.e. for the nonremoved data points, the six head alignment estimates and the FD were included as additional nuisance regressors in the GLM. In cases where the temporal masks removed more than 30% of the data, the whole functional run was removed from the final analysis to prevent wrong estimation of the main regressors (2.8% of the runs). If all functional runs from a subject in one condition had to be removed, then the subject was excluded from the final group analysis. For the group results, a random effects analysis using the GLM was performed with 12 participants. A repeated measures analysis of variance (rANOVA) was performed in BrainVoyager at the whole brain level with the within‐subject factor frequency (10, 60, and 80 Hz) in order to assess frequency‐specific effects. In case of statistical significance, the significant voxels were defined as regions of interest (ROIs) and post‐hoc t tests were implemented at the ROIs level for evaluating the specific contrasts. To look for specific effects of each tACS frequency a paired t test was implemented at the whole brain level comparing the periods with tACS to the periods without tACS for each frequency (tACS‐on > tACS‐off). Main effects of tACS were assessed by a t test with the following contrast: [(10 Hz tACS‐on + 60 Hz tACS‐on + 80 Hz tACS‐on) > tACS‐off].
For all statistical maps, multiple comparison correction was performed at the cluster level. Maps were thresholded at an initial cluster forming threshold with P < 0.005. The size of the resulting clusters was assessed for significance using Monte Carlo simulations as implemented in BrainVoyager's cluster‐level statistical threshold estimator plugin. Reported clusters are significant at a level of P < 0.05. For labeling the significant regions, the peak activation voxel from each cluster was entered into the Talairach client tool (http://www.talairach.org/client.html), a 5‐mm range cube was defined around the peak voxel and the cluster was labeled according to the region to which most of the defined voxels belong.
E1.2
To investigate the effect of the different tACS frequencies during the visual task performance, six box‐car predictors modeling the 30 s tACS‐on/off periods for the different tACS frequencies were defined (10 Hz tACS‐on, 10 Hz tACS‐off, 60 Hz tACS‐on, 60 Hz tACS‐off, 80 Hz tACS‐on, and 80 Hz tACS‐off). Note that the statistical analysis from Experiment 1.1 and Experiment 1.2 are different. In both experiments the defined predictors are implicitly contrasted to the baseline conditions (no tACS, no visual stimulation). However, in contrast to Experiment 1.1 (where only the tACS‐on periods were modeled), in Experiment 1.2 the tACS‐off periods are not assigned to the baseline but modeled with a different predictor which refers to the periods with the visual stimulation but without tACS. Predictors were convolved with BrainVoyager's standard 2‐gamma hemodynamic response function and the same nuisance regressors mentioned in Experiment 1.1 were included in the model. About 4.3% of the runs were excluded from the final analysis because the temporal masks removed more than 30% of the data due to excessive FD values. For the group results, a random effects GLM was performed with 12 participants. A two‐factor rANOVA was performed in BrainVoyager at the whole brain level with the within‐subject factors frequency (10, 60, and 80 Hz) and tACS state (on/off). In case of statistical significance, the significant voxels were defined as ROIs and post‐hoc t tests were implemented at the ROIs level for evaluating the specific contrasts. The basic effect of each frequency was assessed as described for Experiment 1.1.
For all statistical maps, multiple comparison correction and regions labeling was performed as described for Experiment 1.1.
Experiment 2 (E2). Task‐Dependent Effects of tACS
Participants
Eleven (6 females, mean age 28.5 ± 4.3 years) new subjects took part in the study. They were selected based on the same criteria used in Experiment 1.
tACS
Unless otherwise specified, tACS was applied using the same setup and parameters as described for Experiment 1. The two electrodes were placed over Oz (round electrode) and over FCz (square electrode) as determined by the International 10–20 EEG system. TACS was applied at 16 Hz or 80 Hz for periods of 12 s with variable inter‐stimulation intervals (see below description of each task).
fMRI
Experimental setup and design
Unless otherwise specified, experimental setup and design were identical to Experiment 1.
Behavioral and tACS paradigm
Effect of tACS on the BOLD signal during fixation only and a video viewing task (E2.1)
Subjects participated in multiple fMRI sessions where tACS was combined with a video viewing task (Fig. 3A). Each session started with an anatomical scan as described for Experiment 1 after which multiple functional runs were collected. For each functional run, subjects were instructed to fixate on a cross presented in the middle of the screen, in order to reduce eye movements. Each run lasted 12 min and 30 s, in which, periods of 30‐s video were interleaved with periods with only the fixation cross. The video stimulus consisted of a movie (http://www.youtube.com/watch?v=pSm7BcQHWXk). TACS was applied in a pseudorandomized order for 12 s, starting 10 s after the beginning of a video, or after the beginning of a fixation only period. For each subject, two different runs were implemented for each frequency (16 and 80 Hz). The frequency was kept constant during the single run but the order of the frequencies for every run during the fMRI sessions was pseudorandomized. Each run consisted of 12 video periods (6 stimulated and 6 non‐stimulated video periods) and 13 passive fixation periods (6 stimulated and 7 non‐stimulated passive fixations) and started always with a non‐stimulated rest period.
Figure 3.
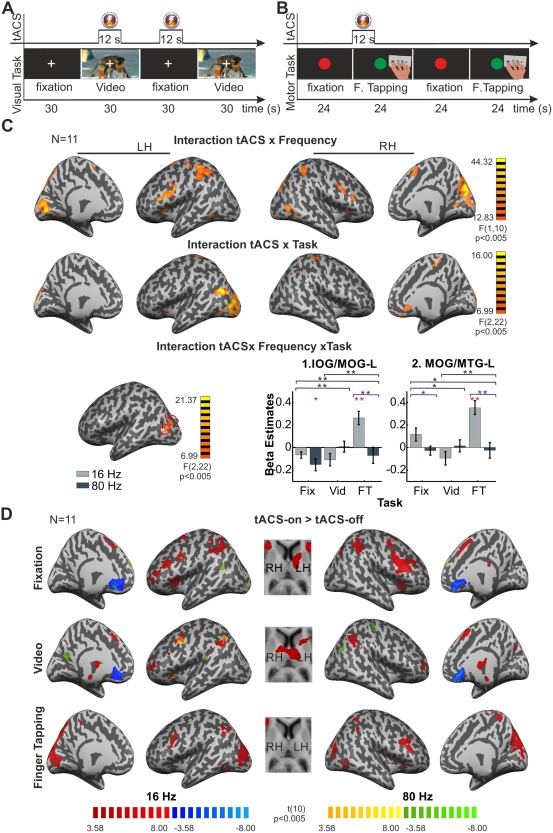
Task‐ and frequency‐dependent effects of tACS. (A) Schematic representation of the task used in Experiment 2.1. Within one fMRI run, the video was presented 12 times for 30 s interleaved with 13 corresponding periods of only passive fixation. TACS was applied for 12 s in a pseudorandomized order 10 s after the beginning of a video period or a blank screen period. Subjects had to maintain fixation through the whole run. (B) Schematic representation of the task used in Experiment 2.2. Twenty 24 s periods of finger tapping were interleaved with corresponding periods of passive fixation. Subjects had to maintain fixation on a central dot and to start tapping when the dot changed the color from red to green. TACS was applied for 12 s in a pseudorandomized order at the beginning of half of the motor periods. (C) F‐score maps for the regions that showed frequency‐dependent effects of tACS (interaction tACS × frequency), task‐dependent effects of tACS (interaction tACS × task) and the regions showing significant interaction between the frequency‐ and task‐dependent effects of tACS (interaction tACS × frequency × task). The bar graphs show the difference (tACS‐on) − (tACS‐off) in the beta estimates extracted from the two regions (numbered in the map in the bottom‐left part of the panel) showing significant effect of tACS × frequency × task. Error bars indicate SEM across observers. Significant differences for the different post‐hoc comparisons (tACS‐on vs. tACS‐off) are marked with red *. Significant differences for the planned comparisons showing the effect of frequency for each task [16 Hz (tACS‐on vs. tACS‐off) vs. 80 Hz (tACS‐on vs. tACS‐off)] are marked with lines and * in blue. Black * signalize the significant differences for the planned comparisons for the interaction effect tACS × frequency × task [contrasts: Fixation (16 Hz (tACS‐on vs. tACS-off) vs. 80 Hz (tACS‐on vs. tACS‐off)) vs. Video (16 Hz (tACS‐on vs. tACS‐off) vs. 80 Hz (tACS‐on vs. tACS‐off)), Fixation (16 Hz (tACS‐on vs. tACS‐off) vs. 80 Hz (tACS‐on vs. tACS‐off)) vs. Finger tapping (16 Hz (tACS‐on vs. tACS‐off) vs. 80 Hz (tACS‐on vs. tACS‐off)) and Video (16 Hz (tACS‐on vs. tACS‐off) vs. 80 Hz (tACS‐on vs. tACS‐off)) vs. Finger tapping (16 Hz (tACS‐on vs. tACS‐off) vs. 80 Hz (tACS‐on vs. tACS‐off)). *P < 0.05, **P < 0.01 (D) T‐score maps showing BOLD activity changes during 16 Hz tACS‐on (red‐blue) and 80 Hz (yellow‐green) when compared with the tACS‐off for each task condition. Maps were thresholded using clusters determined by P < 0.005 and a corrected cluster significance threshold of P < 0.05. Talairach coordinates for the peak activation voxels for all clusters are listed in Table 3. LH = left hemisphere; RH = right hemisphere.
Effect of tACS during a motor task (E2.2)
Subjects participated in multiple fMRI sessions where tACS was combined with a finger tapping task (Fig. 3B). Each run started with a red dot appearing in the middle of the screen for 24 s that was replaced with a green dot for the same period of time. Subjects were asked to keep their fixation on the target in the middle of the screen and were instructed to rest, while the red dot was visible and to perform sequential finger tapping with the fingers of their right hand (tapping from index to little finger and back) when the green dot was visible. TACS was applied for 12 s in a pseudorandomized order at the beginning of half of the motor periods. Subjects participated in two functional runs each lasting 16 min and 24 s. A different frequency was applied in each run (16 or 80 Hz). Each run consisted of 20 motor periods (10 stimulated motor periods and 10 non‐stimulated motor periods).
Data acquisition
All functional data were acquired using T2*‐weighted gradient‐echo echo‐planar imaging (gap between slices of 0.6 mm, otherwise same parameters as described for Experiment 1). A total of 375 whole brain volumes were acquired in each functional run for Experiment 2.1 and 492 for Experiment 2.2. Otherwise the data was acquired as described for Experiment 1.
fMRI data analysis
Preprocessing of functional data was performed as described for Experiment 1.
E2.1
Ten box‐car predictors were defined modeling for each frequency the video stimulus period (video_16Hz, video_80Hz), the periods where tACS was applied separated by task condition (fixation_16Hz_tACS‐on video_16Hz_tACS‐on, fixation_80Hz_tACS‐on, video_80Hz_tACS‐on) and equivalent time intervals without tACS (fixation_16Hz_tACS‐off, video_16Hz_tACS‐off, fixation_80Hz_tACS‐off, video_80Hz_tACS‐off). An example of the defined predictors for one tACS frequency is shown in Supporting Information Figure S1B. Predictors were convolved with BrainVoyager's standard 2‐gamma hemodynamic response function and the same nuisance regressors mentioned in Experiment 1.1 were included in the model. For the group results, a random effects GLM was performed with 11 participants.
E2.2
Six box‐car predictors were defined modeling for each frequency the motor stimulus period, the period where tACS was applied and equivalent time intervals without tACS during the motor task (finger tapping_16Hz, finger tapping_16Hz_tACS‐on, finger tapping_16Hz_tACS‐off, finger tapping_80Hz, finger tapping_80Hz_tACS‐on; finger tapping_80Hz_tACS‐off). Predictors were convolved with BrainVoyager's standard 2‐gamma hemodynamic response function and the same nuisance regressors mentioned in Experiment 1.1 were included in the model. For the group results, a random effects analysis GLM was performed with 11 participants.
To evaluate the task dependency of the effect of tACS on the BOLD signal, data from Experiment 2.1 and 2.2 were included in a three‐factors rANOVA at the whole brain level with the within‐subject factors frequency (10 and 80 Hz), tACS state (on and off) and task period (video viewing, passive fixation, finger tapping). In case of statistical significance, the significant voxels were defined as ROIs and post‐hoc t test were implemented at the ROIs level for evaluating the specific contrasts. The basic effect of each frequency in each task was assessed as described for Experiment 1.1.
For all statistical maps, multiple comparison correction and region labeling was performed as described for Experiment 1.1.
Experiment 3 (E3). Effect of Brain State (Eyes Open/Eyes Closed) and tACS Current Strength
Participants
Fourteen subjects (11 females, mean age 28.2 ± 6.5 years) took part in the study. Subjects were selected based on the same criteria used in Experiment 1.
tACS
TACS was applied at 16 Hz for 12 s with inter‐stimulation intervals of 24–32 s. Otherwise, the same setup and parameters as described for Experiment 2 were used.
fMRI
Experimental setup and design
Unless otherwise specified, experimental setup and design were the same as described for Experiment 1.
Behavioral and tACS paradigm
Effect of brain state (eyes open/eyes closed) (E3.1)
The experiment consisted of one fMRI session with two functional runs (Fig. 5A). For one of the functional runs subjects were instructed to fixate on a cross presented in the middle of the screen (eyes open condition, EO). In the other functional run subjects were instructed to keep their eyes closed but without falling asleep (eyes closed condition, EC). In each run eight periods of 12 s tACS were interleaved with non‐stimulation periods (24–32 s). Each run lasted 5 min and 47 s. TACS was applied at 16 Hz with a current strength of 1,000 µA. The order of the runs (EO/EC) was randomized. Subjects rated the strength of perceived phosphenes and cutaneous sensation intensities on a scale ranging from 0 to 5 after each run (for a detailed description of how subjects were instructed for the ratings see Supporting Information).
Figure 5.
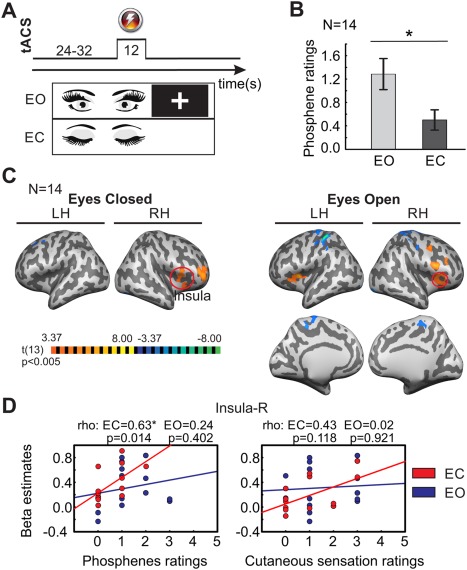
Effect of 16 Hz tACS on the BOLD signal under EO/EC resting conditions. (A) Schematic representation of the task used in Experiment 3.1. Periods of 12 s tACS at 16 Hz were interleaved with resting periods (24–32 s) under EO/EC conditions. (B) Permutation test results comparing the rating of phosphene perception intensities for each resting condition. The intensity of phosphenes was significantly lower under EC than under EO conditions. Error bars indicate SEM across observers. *P < 0.05. (C) T score maps showing BOLD activity changes during 16 Hz tACS under EC/EO conditions when compared to the tACS‐off condition. No significant difference was observed when comparing the two states. Maps were thresholded using clusters determined by P < 0.005 and a corrected cluster significance threshold of P < 0.05. Talairach coordinates for the peak activation voxels for all clusters are listed in Table 4. LH = left hemisphere; RH = right hemisphere. (D) Scatter plots correlating the phosphene and cutaneous sensation ratings with the beta estimates extracted from the right insula (marked with a red circle in panel C) for EC (red) and EO (blue) resting conditions. Only the correlation between phosphene rating and insula activation during the EC condition was significant. Spearman's rho and associated P values are given for each correlation. *P < 0.05. The plots were performed only with the right insula because it was the only region that was significantly modulated by tACS in both conditions. None of the other correlations was significant. For determining the regions for the scatter plots we selected all the voxels within the specific cluster (marked with red circle) showing a significant effect of tACS.
Effect of current strength (E3.2)
From the initial 14 subjects who participated in Experiment 3.1, 11 subjects (nine females, mean age 29.5 ± 6.8 years) participated in this experiment, in which a total of four functional runs were collected in multiple fMRI sessions. One session coincided with the session for Experiment 3.1. During each run subjects were asked to fixate on a cross that appeared in the middle of the screen. The same protocol as described for Experiment 3.1 in the eyes open condition was employed. Periods of 12 s tACS were interleaved with non‐stimulation periods (24–32 s) as described for Experiment 3.1. In each run tACS was applied at 16 Hz with a different current strength (four different levels: 500, 750, 1,000 and 1,500 µA). The order of the current strength levels was pseudorandomized across subjects. For the 11 subjects the data from tACS with 1,000 µA is the same included in Experiment 3.1 for the eyes open condition. Subjects rated the strength of perceived phosphenes and the intensity of the cutaneous sensation on a scale ranging from 0 to 5 after each run.
Data acquisition
All images were acquired with a 32‐channel phased‐array head coil. All functional data were acquired using T2*‐weighted gradient‐echo echo‐planar imaging (TR: 1800 ms, 34 slices of 3‐mm thickness, gap between slices of 0.6 mm, with integrated parallel acquisition technique: factor 2, otherwise same parameters as described for Experiment 1). A total of 193 whole brain volumes were acquired in each functional run for each experiment. Otherwise data were acquired as described for Experiment 1.
fMRI data analysis
Preprocessing steps were followed as described for Experiment 1.
E3.1
To investigate the effect of 16 Hz tACS under EO/EC conditions two box‐car predictors modeling the 12 s tACS‐on periods for each state were defined (EO_tACS‐on, EC_tACS‐on). Predictors were convolved with BrainVoyager's standard 2‐gamma hemodynamic response function and nuisance predictors were included in the GLM model as described for Experiment 1. At the group level, a random effects GLM was performed with 14 participants. To assess the brain state dependent effects of tACS a paired t test was conducted comparing EO_tACS‐on vs. EC_tACS‐on.
For all statistical maps, multiple comparison correction and regions labeling was performed as described for Experiment 1.1.
E3.2
To investigate the effect of tACS at different current strength levels four box‐car predictors modeling the 12 s tACS‐on periods for each current strength level were defined (16 Hz 500_μA_tACS‐on, 16 Hz 750_μA_tACS‐on, 16 Hz 1000_μA_tACS‐on, 16 Hz 1500_μA_tACS‐on). Predictors were convolved with BrainVoyager's standard 2‐gamma hemodynamic response function and nuisance regressors were included as described for previous experiments. For the group results, a random effects GLM was performed with 11 participants. A one‐factor rANOVA was performed in BrainVoyager at the whole brain level with the within‐subject factor current strength (500, 750, 1,000 and 1,500 µA). The basic effect of each current strength level was assessed as described for Experiment 1.1.
For all statistical maps, multiple comparison correction and region labeling was performed as described for Experiment 1.1.
Analysis of phosphenes and cutaneous sensation intensities ratings
For comparing the phosphenes and cutaneous sensation ratings between EO/EC conditions in Experiment 3.1, permutation tests for paired samples were implemented in MATLAB, version R2011b (The MathWorks, Natick, MA). For evaluating whether the observed effect of tACS on the BOLD signal can be explained by the perception of phosphenes or cutaneous sensation in both Experiments 3.1 and 3.2, the regions showing a significant effect of tACS were defined as ROIs and its beta estimates were correlated to the corresponding phosphene and cutaneous sensation ratings using the Spearman's rank correlation coefficient as implemented in STATISTICA, version 12 (StatSoft, 2014, http://www.statsoft.com).
Cortical Sheet Reconstruction
The cortical sheets of individual subjects were reconstructed as polygon meshes based on the high‐resolution T1‐weighted scans. The brain was segmented and the white‐gray matter boundary reconstructed, smoothed and inflated [Kriegeskorte and Goebel, 2001]. For visualization, all resulting maps are displayed on the inflated cortical surface of a single subject.
RESULTS
Effect of tACS on the BOLD Signal at Rest and During a Visual Perception Task
Experiment 1 evaluated the effect of tACS on the BOLD signal under two different task conditions. On the basis of a previous study modeling the electric field distribution with the electrode montage used here [Neuling et al., 2012], we expected to find tACS‐induced BOLD signal changes mainly in occipital and parietal cortices.
Effect of tACS on the BOLD signal during rest
Experiment 1.1 was aimed to measure the basic effect of tACS on the BOLD signal in the absence of an active task. Periods of 30 s tACS were applied, while subjects were lying in the scanner fixating on a cross in the middle of the screen (Fig. 1A, Methods). A significant main effect of tACS (contrast: (10 Hz tACS‐on + 60 Hz tACS‐on + 80 Hz tACS‐on) > tACS‐off) was found for the left claustrum/insula and middle frontal gyrus (MFG) such that beta estimates in these regions were higher for the tACS‐on than for the tACS‐off conditions (Supporting Information Fig. S2A, Table 1). The rANOVA with the within‐factor frequency (10, 60, and 80 Hz) showed frequency‐dependent effects of tACS (main effect of frequency (F(2,22) >6.81; P < 0.005)) in six main clusters localized in the left MFG, MFG/superior frontal gyrus (SFG), SFG/medial frontal gyrus (MedialFG), right putamen (Pu)/insula, right culmen in the cerebellum/parahippocampal gyrus (PHG) and left PHG (Fig. 1B, Table 1). To further test the effect of frequency, post‐hoc comparisons with the beta estimates extracted from the regions listed above were performed. The analysis showed higher increase of the BOLD signal for 10 Hz when compared to 60 Hz tACS in the clusters located in the left MFG/SFG and SFG/MedialFG while the opposite was found for the left PHG and right culmen/PHG. The effect of tACS at 10 Hz was also higher than at 80 Hz for all the clusters excluding the right culmen/PHG. The contrast 60 Hz > 80 Hz was significant only for the right Pu/insula, right culmen/PHG, and the left PHG (Table 1). To evaluate the effect of tACS separately for each frequency the BOLD signal obtained when tACS was applied at 10, 60, and 80 Hz was compared with the tACS‐off condition. Significant results are reported for clusters determined by P < 0.005 and a corrected cluster significance threshold of P < 0.05. In contrast to our predictions, 10 Hz tACS mainly resulted in an increase of the BOLD signal, in particular in fronto‐parietal regions in the left hemisphere, including MFG/inferior frontal gyrus (IFG), precentral gyrus (PrC), inferior/middle temporal gyri (ITG/MTG), inferior parietal lobule/intraparietal sulcus (IPL/IPS) and in the Pu/insula. The expected decrease of the BOLD signal with 10 Hz tACS was only observed in the anterior portion of the superior temporal sulcus (STS) (Fig. 1C, Table 1). Although 10 Hz tACS modulated the BOLD signal mainly in the left hemisphere, this needs to be taken with caution. If the forming threshold for the cluster was decreased to P < 0.05 (uncorrected), similar regions showed modulation in the right hemisphere when 10 Hz tACS was applied (Supporting Information Fig. S3A, red‐blue color map). This suggests that this apparent lateralization is influenced by the cluster threshold used for correcting the data for multiple comparisons, although even with the looser threshold 10 Hz tACS induced activity was more pronounced within the left hemisphere.
Table 1.
Experiment 1.1. Effect of tACS on the BOLD signal in a resting state condition
| Effect of tACS ((10 Hz tACS‐on + 60 Hz tACS‐on +80 Hz tACS‐on) > tACS‐off) | ||||
|---|---|---|---|---|
| x | y | z | P a | |
| Frontal | ||||
| MFG‐L | −34 | 52 | 0 | 0.000227 |
| Sublobar | ||||
| Claustrum/insula‐L | −31 | 13 | 6 | 0.000001 |
| Effect of tACS frequency | |||||||
|---|---|---|---|---|---|---|---|
| rANOVA | Post‐hoc comparison | ||||||
| x | y | z | P a | 10 Hz > 60 Hz df(22), P b | 10 Hz > 80 Hz df(22), P b | 60 Hz > 80 Hz df(22), P b | |
| Frontal | |||||||
| MFG‐L | −25 | 4 | 57 | 0.000984 | 0.061 | <0.001 | 0.101 |
| MFG/SFG‐L | −31 | 43 | 24 | 0.000013 | 0.008 | <0.001 | 0.168 |
| SFG/medialFG | −1 | 7 | 51 | 0.000443 | 0.010 | 0.001 | 0.592 |
| Sub‐lobar | |||||||
| Pu/insula‐R | 29 | 10 | 3 | 0.000091 | 0.490 | <0.001 | 0.001 |
| Limbic/anterior | |||||||
| Culmen/PHG‐R | 5 | −47 | −9 | 0.000011 | <0.001 | 0.156 | <0.001 |
| PHG‐L | −16 | −38 | 6 | 0.000317 | 0.033 | 0.005 | <0.001 |
| tACS‐on vs. tACS‐off | |||||||||
|---|---|---|---|---|---|---|---|---|---|
| 10 Hz tACS‐on> tACS‐off | 10 Hz tACS‐on< tACS‐off | ||||||||
| x | y | z | P a | x | y | z | P a | ||
| Frontal | Temporal | ||||||||
| MFG/IFG‐L | −34 | 46 | 0 | 0.000125 | STS‐L | −49 | −14 | −6 | 0.000035 |
| PrC‐L | −34 | −8 | 36 | 0.000141 | 60 Hz tACS‐on> tACS‐off | ||||
| Temporal | Limbic/Anterior | ||||||||
| ITG/MTG‐L | −58 | −53 | −6 | 0.000007 | Culmen/PHG‐R | 8 | −47 | −6 | 0.000001 |
| Parietal | 80 Hz tACS‐on< tACS‐off | ||||||||
| IPS/IPL‐L | −28 | −65 | 30 | 0.000040 | Temporal | ||||
| Sublobar | MTG ‐R | 41 | −62 | −3 | 0.000163 | ||||
| Pu/Insula‐L | −28 | 4 | 9 | 0.000010 | |||||
Note: Talairach coordinates are given for the most significant voxels with F(2, 22) > 6.81 for the rANOVA and |t| > 3.50 for the t test with uncorrected P < 0.005 in both cases. R and L mean right and left hemispheres, respectively. IFG: inferior frontal gyrus; IPL: inferior parietal lobule; IPS: intraparietal sulcus; ITG: inferior temporal gyrus; MedialFG: medial frontal gyrus; MFG: middle frontal gyrus; MTG: middle temporal gyrus; PHG: parahippocampal gyrus; PrC: precentral gyrus; Pu: putamen; SFG: superior frontal gyrus; STS: superior temporal sulcus.
Uncorrected P values for the peak voxels.
P values for post‐hoc comparisons with Tukey HSD test.
The effect of tACS at 60 Hz was considerably weaker, increasing the BOLD signal only in the right culmen/PHG (Supporting Information Fig. S3A, P < 0.005, orange‐green color map). TACS at 80 Hz decreased the BOLD signal only in the right MTG (Supporting Information Fig. S3A, P < 0.005, orange‐green color map). Table 1 shows a detailed list of statistical results and Talairach coordinates for the peak activation voxels for the rANOVA, post‐hoc comparisons and the contrast tACS‐on vs. tACS‐off for each frequency.
We shall mention that tACS effects were variable between participants. Supporting Information Figure S4 shows single subject examples for each tACS frequency showing this inter‐subject variability. These results point out the necessity of individualizing (e.g., by means of individual current density modeling) this method in order to have the desired effects.
Effect of tACS on the BOLD signal during a visual perception task
Experiment 1.2 was aimed to test whether the effect observed in Experiment 1.1 was similar under a different task condition. TACS was applied for periods of 30 s, while the participants were lying in the scanner performing a visual perception task (Fig. 2A). A rANOVA was performed with the within‐subject factors tACS (on, off) and frequency (10, 60, and 80 Hz). To simplify the results we will focus only on the main effect of tACS (showing the general effect of tACS regardless of the given frequency) and the interaction tACS × frequency (showing frequency‐specific effects of tACS). A significant main effect of tACS (F(1, 11) >12.23; P < 0.005) was found in the right IFG, left SFG, precuneus (PCu) and bilateral MTG such that beta estimates in these regions were higher for the tACS‐on than for the tACS‐off conditions (Supporting Information Fig. S2B, Table 2). The interaction tACS x frequency was significant (F(2, 22) >6.81; P < 0.005) for the right PrC/postcentral gyrus (PoC) and PoC/IPS (Fig. 2B, Table 2). This interaction can be understood as follows: in both regions, 10 Hz tACS tended to decrease the BOLD signal while 60 Hz increased it (Fig. 2B, bar graphs). tACS at 80 Hz did not show any significant effect in these regions. To further test frequency‐specific effects of tACS in these regions, planned comparison analyses were used comparing the effect of tACS between frequencies. In the PoC/IPS, significant differences were found between the effect of 10 and 60 Hz tACS and between 10 and 80 Hz tACS, while in the PrC/PoC a significant difference was found only between the effect of 10 and 60 Hz tACS (F(1, 11) ≥13.54; P ≤ 0.003, for all the comparisons). Figure 2B and Table 2 show the results of the rANOVA and the different post‐hoc comparisons. To evaluate the effect of tACS at each particular frequency the periods of tACS‐on were compared with the periods of tACS‐off individually for each tACS frequency. Significant results are reported for clusters determined by P < 0.005 and a corrected cluster significance threshold of P < 0.05. Unlike in the rest condition in Experiment 1.1, the strongest effect here was found with 60 Hz, which increased the BOLD signal in several regions including the bilateral IFG, right SFG and MedialFG, bilateral MTG, left IPL and PCu and in the right cuneus (Cu) (Fig. 2C, Table 2). Note that in this visual perception task tACS at 60 Hz modulated the BOLD signal in occipital and parietal regions as suggested by the studies modeling the current distribution with a similar electrode montage. TACS at 10 Hz decreased the BOLD signal in the right IPL while no significant effect of 80 Hz tACS was observed. Supporting Information Figure S3B shows the effect of each frequency when compared to the tACS‐off condition with the maps thresholded at uncorrected P < 0.05 (red‐blue color map) and P < 0.005 (orange‐green color map), and corrected at the cluster level with P < 0.05. In general, tACS effects on the BOLD signal during the visual perception task were very different from the effect observed during the rest condition, suggesting that the effect of tACS is task‐dependent. Generally, during the visual task, observed tACS effects were more consistent with our initial predictions, i.e. decreased BOLD activity with 10 Hz and increased BOLD in occipito‐parietal regions with 60 Hz.
Table 2.
Experiment 1.2. Effect of tACS on the BOLD signal during a visual perception task
| Effect of tACS (on/off) | |||||
|---|---|---|---|---|---|
| rANOVA | Post‐hoc comparison | ||||
| x | y | z | P a | df(11) | |
| Frontal | |||||
| IFG‐R | 32 | 31 | 3 | 0.000010 | P < 0.001 |
| SFG‐L | −16 | 46 | 21 | 0.000045 | P = 0.001 |
| Temporal | |||||
| MTG‐R | 53 | −68 | 15 | 0.000028 | P < 0.001 |
| ‐L | −46 | −68 | 18 | 0.000091 | P = 0.001 |
| Parietal | |||||
| PCu | 5 | −62 | 15 | 0.000013 | P < 0.001 |
| Effect of tACS frequency | |||||||
|---|---|---|---|---|---|---|---|
| x | y | z | P a | 10 Hz vs. 60 Hz df(22), P b | 10 Hz vs. 80 Hz df(22), P b | 60 Hz vs. 80 Hz df(22), P b | |
| Frontal | |||||||
| MFG‐R | 38 | −2 | 51 | 0.000053 | 0.330 | 0.014 | <0.001 |
| Temporal | |||||||
| MTG/MOG‐R | 32 | −65 | 6 | 0.000543 | 0.024 | 0.752 | 0.004 |
| ‐L | −49 | −65 | 0 | 0.000067 | 0.288 | 0.046 | 0.001 |
| Parietal | |||||||
| PCu | −4 | −59 | 27 | 0.000282 | 0.061 | 0.001 | 0.203 |
| Interaction tACS × frequency | |||||||
|---|---|---|---|---|---|---|---|
| x | y | z | P a | 10 Hz (on vs. off) df(22), P b | 60 Hz (on vs. off) df(22), P b | 80 Hz (on vs. off) df(22), P b | |
| Frontal | |||||||
| PrC/PoC‐R | 53 | −14 | 27 | 0.000154 | 0.440 | 0.034 | 0.959 |
| Parietal | |||||||
| PoC/IPS‐R | 30 | −41 | 69 | 0.000163 | 0.065 | 0.049 | 0.999 |
| tACS‐on vs. tACS‐off | |||||||||
|---|---|---|---|---|---|---|---|---|---|
| 10 Hz tACS‐on< tACS‐off | 60 Hz tACS‐on> tACS‐off | ||||||||
| x | y | z | P a | x | y | z | P a | ||
| Parietal | Frontal | ||||||||
| IPL‐R | 38 | −44 | 54 | 0.000104 | IFG‐R | 29 | 25 | −6 | 0.000037 |
| ‐L | −49 | 10 | 21 | 0.000329 | |||||
| SFG‐R | 17 | 4 | 48 | 0.000129 | |||||
| MedialFG | 5 | 43 | 33 | 0.000012 | |||||
| Temporal | |||||||||
| MTG‐R | 41 | −68 | 21 | 0.000001 | |||||
| ‐L | −49 | −68 | 21 | 0.000200 | |||||
| Parietal | |||||||||
| IPL‐L | −37 | −50 | 57 | 0.000563 | |||||
| PCu‐L | −13 | −62 | 45 | 0.000366 | |||||
| Occipital | |||||||||
| Cu‐R | 20 | −71 | 18 | 0.000165 | |||||
Note: Talairach coordinates are given for the most significant voxels with F(1,11) > 12.23 for the main effect of tACS in the rANOVA, F(2, 22) > 6.81 for the interaction tACS × frequency and |t| (11) > 3.50 for the t test with uncorrected P < 0.005 in all cases. R and L mean right and left hemispheres, respectively. Cu: cuneus; IFG: inferior frontal gyrus; IPL: inferior parietal lobule; IPS: intraparietal sulcus; MedialFG: medial frontal gyrus; MFG: middle frontal gyrus; MOG: middle occipital gyrus; MTG: middle temporal gyrus; PCu: precuneus; PoC: postcentral gyrus; PrC: precentral gyrus; SFG: superior frontal gyrus.
Uncorrected P values for the peak voxels.
P values for post‐hoc comparisons with Tukey HSD test.
Summary
Overall, the results of Experiment 1 suggest that tACS effects on the BOLD signal are frequency‐ and task‐dependent. Specifically, the strongest effect during rest was observed with 10 Hz, while 60 Hz was more effective during the visual perception task. An effect of tACS in visual areas was only observed during the visual perception task with stimulation at 60 Hz. However, due to different subjects in the experimental groups, we were not able of evaluating the task dependency by performing direct statistical comparisons between Experiment 1.1 and Experiment 1.2.
Task‐dependent Effects of tACS
To rule out that the task‐dependent effect of the stimulation suggested in Experiment 1 is not a consequence of inter‐subject variability, the aim of Experiment 2 was to specifically investigate task‐dependent effects of tACS on the BOLD signal within the same subject group. In addition, we wanted to verify whether this task dependency suggested in Experiment 1 extends to other tACS frequencies and task conditions. With that purpose, a new group of subjects participated in two experiments, in which tACS was applied for a duration of 12 s at 16 and 80 Hz interleaved with periods without stimulation. In Experiment 2.1, tACS was applied during passive fixation or video viewing periods, and in Experiment 2.2 tACS was applied while subjects were performing a finger tapping task (Fig. 3A,B; Methods). Data from both experiments were analyzed together. A rANOVA was performed with the within‐subject factors tACS (on, off), frequency (16 and 80 Hz) and task condition (fixation, video viewing and finger tapping). To simplify the results we will focus on one main effect and three interaction effects: main effect of tACS (showing the main effect of tACS regardless of the frequency and task), interaction tACS × frequency (showing frequency‐dependent effects of tACS regardless of the task condition), tACS × task (showing task‐dependent effects of tACS regardless of the frequency) and tACS x frequency × task (showing the interaction between the frequency and task‐dependent effects of tACS) (see Table 3 for all comparisons).
Table 3.
Experiment 3. Effect of tACS on the BOLD signal during different task conditions
| Effect of tACS (on/off) | |||||
|---|---|---|---|---|---|
| rANOVA | Post‐hoc comparison | ||||
| x | y | z | P * | df(10), P ** | |
| Frontal | |||||
| MFG/Insula‐R | 48 | 11 | 46 | 0.000005 | < 0.001 |
| MFG/Insula/Pu‐L | −36 | 50 | 4 | 0.000001 | < 0.001 |
| SFG‐R | 24 | 44 | 4 | 0.000051 | < 0.001 |
| Parietal | |||||
| IPL/IPS‐R | 33 | −49 | 37 | 0.000006 | < 0.001 |
| IPL/IPS‐L | −42 | −55 | 52 | 0.000002 | < 0.001 |
| Limbic | |||||
| ACC | −3 | 20 | −5 | 0.000002 | < 0.001 |
| PCC | −3 | −55 | 19 | 0.000004 | < 0.001 |
| Sub‐Lobar | |||||
| Pu/Thalamus‐R | 15 | −1 | 10 | 0.000526 | 0.001 |
| Effect of frequency | |||||
| x | y | z | P * | df(10), P ** | |
| Frontal | |||||
| PARC | 0 | −28 | 49 | 0.001093 | 0.001 |
| Occipital | |||||
| IOG/MOG‐L | −36 | −82 | −9 | 0.000018 | <0.001 |
| Effect of task | |||||||
|---|---|---|---|---|---|---|---|
| x | y | z | P * | Fixation vs. Video df(20), P ** | Fixation vs. Motor df(20), P ** | Video vs. Motor df(20), P ** | |
| Cortical Cluster a | 0.329 | <0.001 | <0.001 | ||||
| Frontal | |||||||
| MFG‐Rb | 36 | 38 | 40 | <0.000001 | |||
| MedialFG‐Lb | −9 | −10 | 52 | <0.000001 | |||
| Parietal | |||||||
| PoC‐Rb | 51 | −16 | 22 | <0.000001 | |||
| PCu‐Rb | 24 | −67 | 31 | <0.000001 | |||
| Occipital | |||||||
| MTG/MOG‐Lb | −42 | −67 | 4 | <0.000001 | |||
| Sub‐Lobar a | 0.364 | <0.001 | <0.002 | ||||
| Insula‐Rb | 30 | 20 | 7 | <0.000001 | |||
| Thalamus‐Rb | 6 | −16 | 4 | <0.000001 | |||
| Interaction tACS x frequency | ||||||
|---|---|---|---|---|---|---|
| x | y | z | P * | 16 Hz (tACS‐on vs. tACS‐off), df(10), P ** | 80 Hz (tACS‐on vs. tACS‐off), df(10), P ** | |
| Frontal | ||||||
| SFG/MFG‐L | −21 | 5 | 65 | 0.000141 | <0.001 | 0.994 |
| SFG‐L | −6 | 17 | 65 | 0.000114 | <0.001 | 0.950 |
| PrC/IFG‐R | 48 | 5 | 34 | 0.000389 | <0.001 | 0.736 |
| IFG‐L | −48 | 14 | 16 | 0.000017 | <0.001 | 0.906 |
| Parietal | ||||||
| PoC‐R | 27 | −37 | 46 | 0.000077 | 0.001 | 0.866 |
| PoC/IPL‐L | −42 | −37 | 55 | 0.000098 | 0.001 | 0.973 |
| Temporo‐Occipital | ||||||
| Cu/PCu‐R | 15 | −76 | 25 | 0.000001 | <0.001 | 0.990 |
| MTG/MOG‐R | 39 | −64 | 7 | 0.000291 | 0.002 | 0.431 |
| FUS/MOG‐L | −48 | −58 | −8 | 0.000038 | 0.006 | 0.077 |
| Interaction tACS x task | |||||||
|---|---|---|---|---|---|---|---|
| Fixation tACS‐on vs. off, df(20), P ** | Video tACS‐on vs. off, df(20), P ** | Motor tACS‐on vs. off, df(20), P ** | |||||
| Frontal/Parietal | |||||||
| PrC/PoC‐R | 33 | −28 | 68 | 0.000146 | 0.135 | 0.008 | 0.443 |
| PrC/PoC‐L | −21 | −28 | 64 | 0.000274 | 0.002 | 0.122 | 0.451 |
| Temporal | |||||||
| MTG‐L | −42 | −73 | 22 | 0.000014 | 0.003 | 0.008 | 0.560 |
| Occipital | |||||||
| Cu/MOG‐L | −12 | −94 | 10 | 0.000005 | 0.974 | 0.965 | < 0.001 |
| Sub‐lobar | |||||||
| Caudate‐R | 6 | 20 | 1 | 0.000257 | < 0.001 | 0.005 | 1.000 |
| LN‐L | −15 | −4 | 1 | 0.000007 | 0.001 | < 0.001 | 0.848 |
| Interaction frequency x task | |||||||
|---|---|---|---|---|---|---|---|
| x | y | z | P * | Fixation 16 Hz vs. 80 Hz df(20), P ** | Video 16 Hz vs. 80 Hz df(20), P ** | Motor 16 Hz vs. 80 Hz df(20), P ** | |
| Temporo‐Occipital | |||||||
| MTG/MOG‐L | −48 | −76 | 16 | 0.000171 | 0.934 | 0.009 | 0.927 |
| Interaction tACS x frequency x task | ||||||||||
|---|---|---|---|---|---|---|---|---|---|---|
| x | y | z | P * | Fixation | Video | Motor | ||||
| tACS‐on vs. tACS‐off | ||||||||||
| 16 Hz df(20), P ** | 80 Hz df(20), P ** | 16 Hz df(20), P ** | 80 Hz df(20), P ** | 16 Hz df(20), P ** | 80 Hz df(20), P ** | |||||
| Occipital | ||||||||||
| IOG/MOG | −33 | −73 | 1 | 0.000078 | 0.841 | 0.028 | 0.245 | >0.999 | < 0.001 | 0.795 |
| MOG/MTG | −36 | −82 | 13 | 0.000015 | 0.405 | 0.999 | 0.669 | >0.999 | < 0.001 | 0.999 |
| Paired t‐test, tACS‐on vs. tACS‐off | |||||||||
|---|---|---|---|---|---|---|---|---|---|
| Fixation | |||||||||
| 16 Hz tACS‐on> tACS‐off | 80 Hz tACS‐on< tACS‐off | ||||||||
| x | y | z | P * | x | y | z | P * | ||
| Frontal | |||||||||
| MFG‐R | 24 | 2 | 49 | 0.000008 | SFG | 0 | 56 | 31 | 0.000157 |
| MFG‐L | −48 | 29 | 31 | 0.000013 | |||||
| SFG/MedialFG‐R | 12 | 11 | 46 | 0.000047 | |||||
| SFG/MFG‐L | −24 | 2 | 58 | 0.000116 | |||||
| Parietal | |||||||||
| IPL/IPS‐R | 30 | −46 | 40 | 0.000267 | |||||
| IPL/IPS‐L | −39 | −50 | 61 | 0.000173 | |||||
| Occipital | |||||||||
| MOG/IOG‐L | −27 | −85 | −5 | 0.000021 | |||||
| Limbic | |||||||||
| ACC/MedialFG | 6 | 32 | −8 | 0.000012 | ACC/MedialFG | −3 | 20 | −12 | 0.000876 |
| Sub‐lobar | |||||||||
| Caudate‐L | −15 | 2 | 16 | 0.000340 | |||||
| Insula‐L | −36 | 17 | 13 | 0.000025 | |||||
| Insula‐R | 33 | 17 | 1 | 0.000164 | |||||
| Video | |||||||||
|---|---|---|---|---|---|---|---|---|---|
| 16 Hz tACS‐On > tACS‐Off | 80 Hz tACS‐On > tACS‐Off | ||||||||
| Frontal | |||||||||
| MFG/SFG‐R | 36 | 53 | 13 | 0.000831 | MFG/PrC‐L | −51 | 5 | 40 | 0.000031 |
| MFG/SFG‐L | −27 | 17 | 62 | 0.000028 | |||||
| MFG‐L | −42 | 32 | 40 | 0.000016 | |||||
| MFG/IFG‐L | −51 | 47 | 13 | 0.000001 | |||||
| Parietal | |||||||||
| IPL‐R | 42 | −52 | 46 | 0.000311 | IPL‐L | −39 | −55 | 49 | 0.000302 |
| IPL‐L | −51 | −52 | 3 | 0.000555 | |||||
| Limbic | |||||||||
| MedialFG/ACC | 0 | 32 | −11 | 0.000007 | |||||
| Sub‐Lobar | |||||||||
| Thalamus‐L | −12 | −22 | 16 | 0.000012 | 80 Hz tACS‐on< tACS‐off | ||||
| PoC/PrC‐R | 27 | −31 | 52 | 0.000366 | |||||
| PCC | 0 | −61 | 19 | 0.000143 | |||||
| Motor | |||||||||
|---|---|---|---|---|---|---|---|---|---|
| 16 Hz tACS‐on > tACS‐off | 80 Hz tACS‐on > tACS‐off | ||||||||
| Frontal | |||||||||
| MFG‐R | 45 | 23 | 25 | 0.000004 | ‐ | ||||
| MFG‐L | −42 | 14 | 31 | 0.000307 | |||||
| Parietal | |||||||||
| IPL/IPS‐R | 39 | −49 | 46 | 0.000389 | ‐ | ||||
| Occipital | |||||||||
| PCu/Cu‐R | 27 | −73 | 25 | <0.000001 | ‐ | ||||
Note: For the rANOVA analysis, Talairach coordinates are given for the most significant voxels with F(1, 10) > 12.83 for the main effect of tACS, main effect of tACS frequency and the interaction between them; F(2, 20) > 6.99 for the main effect of Task and the interactions Task × tACS, Task × Frequency and Task × tACS x Frequency. For the paired t test analysis comparing tACS‐on vs. tACS‐off for each frequency and task, Talairach coordinates are given for the most significant voxels with |t| (10) > 3.58. In all the analysis the uncorrected P was <0.005. R and L mean right and left hemispheres, respectively. ACC: anterior cingulate cortex; Cu: cuneus; FUS: fusiform gyrus; IFG: inferior frontal gyrus; IOG: inferior occipital gyrus; IPL: inferior parietal lobule; IPS: intraparietal sulcus; LN: lentiform nucleus; MedialFG: medial frontal gyrus; MFG: middle frontal gyrus; MOG: middle occipital gyrus; MTG: middle temporal gyrus; PARC: paracentral lobule; PCC: posterior cingulate cortex; PCu: precuneus; PoC: postcentral gyrus; PrC: precentral gyrus; Pu: putamen; SFG: superior frontal gyrus.
*Uncorrected P values for the peak voxels.
**P values for post‐hoc comparisons with Tukey HSD test.
aTwo main clusters were identified as showing a significant main effect of Task in the rANOVA, one cluster included many regions distributed along the cortex while the second cluster included subcortical areas. For the statistical analysis the beta values were extracted from the big clusters, however to better describe the regions included in each cluster, local peak voxels were defined in “b.”
Table 4.
Experiment 3.1. Effect of 16 Hz tACS on the BOLD signal during resting EC/EO conditions
| x | y | z | P* | |
|---|---|---|---|---|
| Eyes closed 16 Hz tACS‐on > tACS‐off | ||||
| MFG‐R | 41 | 49 | 9 | 0.000081 |
| Insula‐R | 44 | 10 | 9 | 0.000239 |
| Eyes closed 16 Hz tACS‐on < tACS‐off | ||||
| MFG‐L | −25 | 13 | 39 | 0.000206 |
| PHG R | 32 | −26 | −9 | 0.000012 |
| Eyes open 16 Hz tACS‐on>tACS‐off | ||||
| IFG‐R | 47 | 10 | 21 | 0.000124 |
| MFG/PrC‐R | 38 | −2 | 33 | 0.000151 |
| Insula‐R | 38 | 16 | 12 | 0.000192 |
| Insula‐L | −34 | 7 | 15 | 0.000003 |
| Eyes open 16Hz tACS‐on<tACS‐off | ||||
| PrC/PoC‐R | 47 | −23 | 58 | 0.000030 |
| PrC/PoC‐L | −46 | −29 | 57 | <0.000001 |
| IOG/FUS‐R | 35 | −74 | −18 | 0.000034 |
| IOG/FUS‐L | −43 | −68 | −15 | 0.000065 |
Note: Talairach coordinates are given for the most significant voxels with |t| (13) >3.37 and uncorrected P < 0.005. R and L mean right and left hemispheres, respectively. FUS: fusiform gyrus; IFG: inferior frontal gyrus; IOG: inferior occipital gyrus; MFG: middle frontal gyrus; PHG: parahipoccampal gyrus; PoC: postcentral gyrus; PrC: precentral gyrus. * Uncorrected P values.
A significant main effect of tACS (F(1,10) >12.83; P < 0.005) was found in eight clusters located in the right MFG/insula, left MFG/insula/Pu, right SFG, bilateral IPL/IPS, anterior cingulate cortex (ACC), posterior cingulate cortex (PCC) and right Pu/thalamus. Beta estimates in these regions were higher for the tACS‐on than for the tACS‐off conditions except for the ACC and PCC where the opposite was observed (Supporting Information Fig. S2C).
Significant frequency‐dependent effects of tACS (interaction tACS × frequency) were found (F(1,10) > 12.83; P<0.005) in the left MFG/SFG, left SFG, right IFG/PrC, left IFG, right PoC, left PoC/IPL, right Cu/PCu, right MTG/middle occipital gyrus (MOG) and left MOG/fusiform gyrus (FUS). Post‐hoc comparisons revealed that beta estimates for 16 Hz tACS‐on were significantly higher than for the 16 Hz tACS‐off conditions in each of the listed clusters, whereas no significant difference was found in any of the clusters for tACS at 80 Hz (Fig. 3C, Table 3).
Significant task‐dependent effects of tACS (interaction tACS × task) were found (F(2, 20) >6.99; P < 0.005) in the right and left PrC/PoC, left MTG, left Cu/MOG, right caudate nucleus and left lentiform nucleus. To clarify in which task tACS induced a significant change in BOLD activity, further post‐hoc comparisons were conducted with the beta estimates derived from the regions listed above. These post‐hoc tests revealed that tACS was more effective in all these regions during the fixation and video viewing periods. In the fixation task, tACS decreased the BOLD signal in the left PrC/PoC, left MTG, and in the right caudate nucleus, while increasing it in the left lentiform nucleus. In the passive video viewing periods, tACS decreased the activity in the clusters located in the right PrC/PoC, left MTG and in the right caudate nucleus while it increased it in the left lentiform nucleus. In the finger tapping task, from the clusters listed above, tACS only increased the activity in the left Cu/MOG. Interestingly these regions were distant from the clusters activated by the finger tapping task, which increased the BOLD signal mainly in motor‐related areas (Fig. 4). In summary, a similar pattern of BOLD activity changes in fronto‐parietal and subcortical regions was found for both, fixating and video viewing conditions, however this pattern seemed to be different for the finger tapping task where tACS modulated the activity in occipital areas (Cu/MOG) (Fig. 3C, Table 3).
Figure 4.
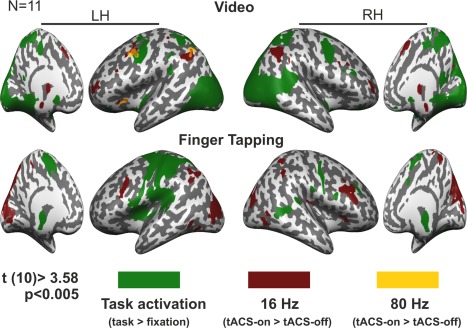
Overlap between task‐activated regions and tACS effects. T score maps showing task‐activated areas (green) overlapped with the effect of tACS at 16 Hz (dark red) and at 80 Hz (orange), for the video task in the upper panel and for the finger tapping in the lower panel. Maps were thresholded using clusters determined by P < 0.005 and a corrected cluster significance threshold of P < 0.05. LH = left hemisphere; RH = right hemisphere.
The interaction between task‐ and frequency‐dependent effects of tACS (tACS × frequency × task) on the BOLD signal was significant (F(2,20) >6.99; P < 0.005) in two independent clusters located in the left inferior occipital gyrus (IOG)/MOG and MOG/MTG. This interaction can be understood as follows: during the fixation periods, only 80 Hz tACS significantly decreased the BOLD signal in the left IOG/MOG while no significant effect of 16 Hz was found for these regions. None of the frequencies showed significant effects during the passive video viewing in these regions. During the finger tapping task, 16 Hz tACS increased the BOLD signal in both clusters while no significant effect of 80 Hz was found. In summary, these results show that tACS effects in these regions in the occipital cortex are frequency‐ and task‐dependent, increasing the activity when 16 Hz tACS is applied during a motor task and decreasing the activity when tACS is applied at 80 Hz during fixation periods (only in the IOG/MOG) (Fig. 3C, Table 3). To further test the task and frequency specificity of the effect of tACS on these regions, planned comparison analyses were conducted to compare the effect of tACS between frequencies and tasks. In the fixation condition, significant differences were found between the effect of 16 and 80 Hz tACS only for the left MOG/MTG, while the effect of both frequencies was significantly different during the finger tapping task in both clusters (F(1,10) ≥ 5.24, P ≤ 0.044, for all the comparisons). In addition, the frequency specific effect of tACS was significantly different between task conditions in both clusters for each task combination tested (F(1,10) ≥6.01, P ≤ 0.034, for all comparisons). Figure 3C (bar plots) shows these results.
To evaluate the effect of tACS at each particular frequency in each task condition the periods with tACS‐on were compared to the periods with tACS‐off individually for each tACS frequency and task. Significant results are reported for clusters determined by P < 0.005 and a corrected cluster significance threshold of P < 0.05. During the fixation period the strongest effect was observed with tACS at 16 Hz, which increased BOLD activity in the MFG (bilateral), right SFG/MedialFG, left MFG/SFG, bilateral IPL/IPS, ACC/MedialFG, left caudate nucleus and bilateral insula. TACS at 80 Hz induced a decrease in BOLD activity in the SFG, IOG/MOG and in the ACC/MedialFG (Fig. 3D, Table 3). The effect of 16 Hz tACS in the passive video viewing condition was observed in similar regions as in the fixation period, increasing BOLD activity in the bilateral MFG/SFG, left MFG/IFG, bilateral IPL, ACC/MedialFG and in the thalamus. Comparable with the effect of 16 Hz tACS, 80 Hz induced a BOLD activity increase in the left MFG/PrC and IPL. In addition, a BOLD activity decrease could be seen in the PrC/PoC and in the PCC (Fig. 3D, Table 3). None of the applied frequencies increased the BOLD signal in the regions that were activated by the video task (Fig. 4). As already described for the other two task conditions, during the finger tapping task 16 Hz tACS also increased the BOLD signal in fronto‐parietal regions, with clusters located mainly in the bilateral MFG and right IPL/IPS. However, unlike for the other conditions, 16 Hz tACS increased the BOLD signal in occipital areas with peak voxels located bilateral in the PCu/Cu. No significant effect of 80 Hz tACS was found during the finger tapping task (Fig. 3D, Table 3). As reported for the video task, none of the applied frequencies increased the BOLD signal in the regions that were activated by the finger tapping task (Fig. 4).
Summary
Overall, results from Experiment 2 lead to a similar conclusion as Experiment 1, i.e. showing that effects of tACS on the BOLD signal are frequency‐ and task‐dependent. In all task conditions the strongest tACS effects were found with lower frequencies, 16 Hz, which resembles the effect of 10 Hz tACS observed during the rest condition in Experiment 1. The latter could suggest that the effect of tACS in fronto‐parietal regions is mainly observed with tACS at alpha and beta frequencies, a finding that might be related to phosphene perception or cutaneous sensation. In addition, gamma tACS (80 Hz) was mainly effective during the video viewing task, comparable to Experiment 1, where tACS applied at 60 Hz increased the BOLD signal mainly during the visual perception task. Differences in the activated regions between both experiments might be related to the different visual stimuli presented during tasks. The effect of tACS in visual areas was frequency and task‐dependent and mainly observed with 16 Hz tACS during the finger tapping task. In general, for each task condition (passive video viewing and finger tapping task) tACS effects on the BOLD signal were mainly observed in regions that were not activated by the task itself (Fig. 4).
Effect of Brain State (Eyes Open/Eyes Closed) and Current Strength
Effect of brain state (eyes open/eyes close)
The aim of this control experiment was to evaluate the state dependency of tACS effects. TACS at 16 Hz with 1,000 µA was applied during rest under two conditions: eyes open (EO) and eyes closed (EC). Subjects were asked to rate the strength of perceived phosphenes and the intensity of cutaneous sensation at the end of each experimental run. We chose 16 Hz as this frequency was showing the strongest effects in Experiment 2. Previous EEG studies have shown a posterior topography of beta oscillations (13–23 Hz) during resting state, whose field power is reduced from eyes closed to the eyes open state [Chen et al., 2008]. It has previously been shown with EEG measurements that the power of the endogenous oscillations strongly affects the efficacy of tACS such that tACS at alpha is more effective when the power of alpha oscillations is lower [Neuling et al., 2013]. In consequence, we would expect a stronger effect of 16 Hz tACS during the eyes open condition than during the eyes closed condition. In addition, it has previously been shown that tACS‐induced phosphenes in the beta range are stronger during light conditions as compared to dark conditions [Kanai et al., 2008]. Thus, we would expect subjects to report higher phosphene intensities during EO when compared to EC. As predicted from previous studies, subjects' rating for phosphene perception were higher during the EO condition when compared to the EC condition (P = 0.0273, permutation test for paired samples) (Fig. 5B). No significant difference was found for the cutaneous sensation ratings between the two states although the same tendency was observed (P = 0.0938, permutation test for paired samples). Unlike for the phosphene ratings, no significant difference was observed between the effect of tACS on the BOLD signal during EO vs. EC. Although not statistically significant, the maps for the contrast tACS‐on > tACS‐off were slightly different for the two different states (Fig. 5C, Table IV). Significant results are reported for clusters determined by P < 0.005 and a corrected cluster significance threshold of P < 0.05. During the EC condition, tACS increased the BOLD signal mainly in the right MFG and insula and decreased it in the left MFG and PHG. During EO 16 Hz tACS increased the BOLD signal mainly in the right IFG and bilateral insula, and decreased activity in the bilateral PrC/PoC and IOG/FUS. When decreasing the cluster forming threshold to P < 0.05 the map is similar to the one reported in Experiment 2, showing an effect of 16 Hz tACS on subcortical structures including the bilateral Pu (Supporting Information Fig. S5). The fact that this effect is not visible at P < 0.005 might be due to the lower current strength used in this experiment (1,000 µA compared to 1,500 µA in Experiment 2). To evaluate the effect of phosphene and cutaneous sensation on the observed modulation of the BOLD signal, the beta estimates from the regions showing significant effect of tACS in each state were extracted and correlated to the phosphenes and cutaneous sensation ratings from each condition. The Spearman rank correlation was only significant for the right insula and the phosphene ratings in the EC condition (Spearman's rho = 0.63; P < 0.05) (Fig. 5D). Overall, the tACS‐induced modulation of the BOLD signal was not related to phosphenes or cutaneous sensation.
Effect of current strength
The aim of this control experiment was to evaluate the influence of tACS current strength on the BOLD signal. TACS at 16 Hz was applied during rest with eyes open with different current strength (500, 750, 1,000, and 1,500 µA). A significant effect of current strength was found in the right IFG/PrC, in the SFG/MedialFG and in the bilateral insular cortex (F(3,30) > 5.24; P < 0.005; Table 5). Figure 6A illustrates the regions showing a significant effect of current strength with (highlighted in white) and without correction for multiple comparisons. Regions like the left IPS did not survive the cluster size‐based correction for multiple comparisons with Monte Carlo simulations, nevertheless, the time‐courses for the different current strength levels showed that the BOLD signal increases when the current strength increases (Fig. 6A). Comparing tACS‐on with tACS‐off periods for each current strength level showed no significant effect of tACS at 500 µA, while tACS at 750 µA decreased the BOLD signal in the left PoC. TACS at 1,000 µA increased the BOLD signal in the right IFG and bilateral insula and decreased the BOLD signal in the bilateral PoC and IOG/FUS. TACS at 1,500 µA increased the BOLD signal in the bilateral IFG/PrC, left MFG, bilateral insula and left IPL/PoC and IPS (Fig. 6B; Table 5). Significant results are reported for clusters determined by P < 0.005 and a corrected cluster significance threshold of P < 0.05. To have a better impression about the reproducibility of tACS effects across different current strengths levels, Supporting Information Figure S5 shows the same comparison with the maps thresholded at P < 0.05. In general, the effects of tACS at 16 Hz were highly consistent mainly in fronto‐parietal regions (as previously observed also in Experiment 2 with a different group of subjects). However, our results indicate that in order to have a strong effect of tACS in parietal regions, one might need to apply the stimulation with a current strength of at least 1,500 µA, while low current strengths might not be effective enough to modulate the activity in these regions. Note that this conclusion is based on a group size of 11 subjects and a cluster forming threshold of P < 0.005. As phosphene and cutaneous sensation ratings are highly correlated to current strength (rho > 0.51, P < 0.001), the effect of current strength in our maps cannot be separated from a possible effect of phosphene perception or cutaneous sensation. To test for a possible influence of these factors on the effect of tACS, phosphene and cutaneous sensation ratings were correlated to the beta estimates extracted from the regions affected by tACS at a fixed current strength of 1,500 µA. We decided to focus on the dependency between phosphene intensity and cutaneous sensation with 1,500 µA because (1) we wanted to keep the current strength level constant and (2) this current strength gave us enough variability between subjects in respect to phosphene perception (ratings ranging from 0 ‐ 4). The Spearman rank correlation coefficient did not show any significant correlation between the phosphene ratings in any of the regions showing a significant effect of tACS, although a tendency to lower beta estimates with increasing phosphenes intensities was observed for the bilateral IFG/PrC (right: rho = −0.50, P = 0.110; left: rho = −0.58, P = 0.056) (Fig. 6C). One should stress that the lack of statistical significance might be due to the small sample size (11 subjects). Nevertheless, with this dataset we cannot argue that the observed effect of tACS on the BOLD signal is explained by the perception of phosphenes. If anything, there seems to be a negative association between these two measures. No significant correlation was found between the intensity of cutaneous sensations and the BOLD signal in any region showing an effect for tACS (16 Hz, 1,500 µA).
Table 5.
Experiment 3.2. Effect of 16 Hz tACS with different current strengths on the BOLD signal
| rANOVA | ||||
|---|---|---|---|---|
| Effect of current strength | ||||
| x | y | z | P* | |
| Frontal | ||||
| IFG/PrC‐R | 44 | 1 | 27 | 0.000333 |
| SFG/MedialFG | −4 | 7 | 51 | 0.000188 |
| PrC‐R | 56 | 7 | 6 | 0.000041 |
| Sublobar | ||||
| Insula‐R | 38 | 22 | 3 | 0.000773 |
| Insula‐L | −25 | 22 | 6 | 0.000314 |
| Paired t‐test, tACS‐on vs. tACS‐off | ||||
|---|---|---|---|---|
| 750 µA tACS‐on < tACS‐off | ||||
| Parietal | ||||
| PoC‐L | −19 | −47 | 66 | 0.000228 |
| 1 000 µA tACS‐on >tACS‐off | ||||
| Frontal/sublobar | ||||
| IFG/insula‐R | 47 | 13 | 18 | 0.000019 |
| Insula‐L | −25 | 22 | 6 | 0.000010 |
| 1 000 µA tACS‐on <tACS‐off | ||||
| Parietal | ||||
| PoC‐R | 14 | −47 | 69 | 0.000113 |
| PoC‐L | −46 | −26 | 57 | 0.000003 |
| Occipital | ||||
| IOG/FUS‐R | 35 | −89 | −13 | 0.000001 |
| IOG/FUS‐L | −40 | −68 | −15 | 0.000077 |
| 1 500 µA tACS‐on >tACS‐off | ||||
| Frontal | ||||
| IFG/PrC‐R | 35 | 28 | 12 | 0.000004 |
| IFG/PrC‐L | −52 | 7 | 12 | 0.000003 |
| MFG‐L | −37 | 31 | 12 | 0.000009 |
| Sub‐lobar | ||||
| Insula‐R | 38 | −2 | 3 | 0.000006 |
| Insula‐L | −37 | 29 | 12 | 0.000036 |
| Parietal | ||||
| IPL/PoC‐L | −55 | −23 | 24 | 0.0000282 |
| IPS‐L | −19 | −65 | 3 | 0.0000143 |
Note: Talairach coordinates are given for the most significant voxels with F(3, 30) >5.24 for the rANOVA and |t| (10) >3.58 for the t test with uncorrected P < 0.005 for both cases. R and L mean right and left hemispheres, respectively. FUS: fusiform gyrus; IFG: inferior frontal gyrus; IPL: inferior parietal lobule; IPS: intraparietal sulcus; IOG: inferior occipital gyrus; MedialFG: medial frontal gyrus; MFG: middle frontal gyrus; PoC: postcentral gyrus; PrC: precentral gyrus. SFG: superior frontal gyrus. *Uncorrected P values.
Figure 6.
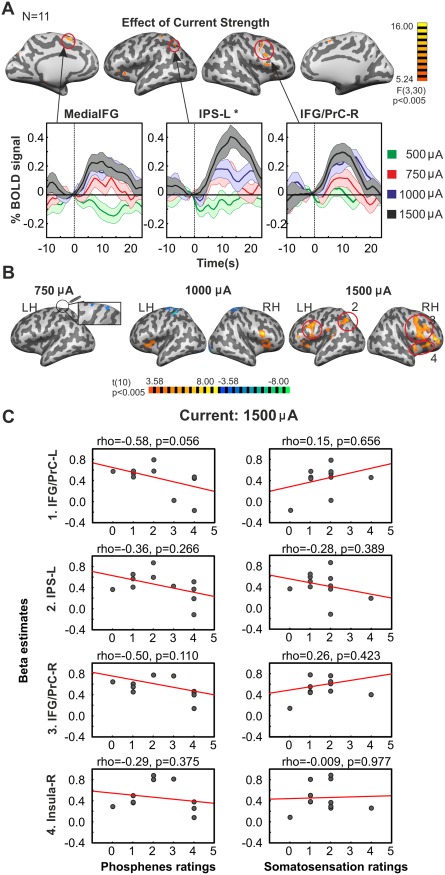
(A) Effect of current strength on the 16 Hz tACS‐induced modulation of the BOLD signal. F score maps showing a significant main effect of current strength in the one way rANOVA [within factor: current strength (500, 750, 1,000, and 1,500 µA)] for the effect of 16 Hz tACS. The regions bordered in white belong to the maps corrected for multiple comparisons with Monte Carlo simulations. The plots show the event related average time course of the BOLD signal for the tACS‐on periods for each current strength. Error regions indicate SEM across observers. Note that in a region like the left IPS, although it does not survive the cluster‐level correction for multiple comparisons, the plot shows a very consistent increase of the BOLD signal with increasing current strength. * Cluster not corrected for multiple comparisons. (B) T score maps showing BOLD activity changes during 16 Hz tACS for each current strength. No significant effect was found with tACS with 500 µA. Maps were thresholded using clusters determined by P < 0.005 and a corrected cluster significance threshold of P < 0.05. Talairach coordinates for the peak activation voxels for all clusters are listed in Table 5. LH = left hemisphere; RH = right hemisphere. (D) Scatter plots correlating the phosphene and cutaneous sensation ratings with the beta estimates extracted from different regions (marked with red circles and numbered in panel B) showing effect of tACS with 1,500 µA. No significant correlation was found for any of the variables although there was a tendency to decrease the beta values with increasing phosphenes rating for bilateral IFG/PrC. For the scatter plots, regions were defined as in Figure 5D.
Table 6.
Summary of the different experiments
| Exp | Task | Stimulation protocol | Frequency | Main results | N |
|---|---|---|---|---|---|
| 1 | Resting state | 30 s, 1,500 µA | 10, 60, and 80 Hz | Strongest effect with 10 Hz tACS increasing BOLD signal in insula and fronto‐parietal areas | 12 |
| 1 | Visual perception task (SfM) | 30 s, 1,500 µA | 10, 60, and 80 Hz | Strongest effect with 60 Hz tACS increasing BOLD signal mainly in visual areas | 12 |
| 2 | Fixation task | 12 s, 1,500 µA | 16 and 80 Hz | Strongest effect with 16 Hz increasing BOLD signal in insula and fronto‐parietal areas | 11 |
| 2 | Passive video viewing | 12 s, 1,500 µA | 16 and 80 Hz | Both 16 Hz and 80 Hz increased BOLD signal in insula and fronto‐parietal areas | 11 |
| 2 | Finger tapping task | 12 s, 1,500 µA | 16 and 80 Hz | Strongest effect with 16 Hz increasing BOLD signal in insula, fronto‐parietal and occipital areas | 11 |
| 3 | Eyes open–eyes closed | 12 s, 1,000 µA | 16 Hz | No significant difference between states, association with phosphenes only for the right insula during eyes closed conditions. | 14 |
| 3 | Varying current strength | 12 s, 500 µA, 750 µA, 1,000 µA, and 1,500 µA | 16 Hz | tACS‐induced BOLD signal increases increased with current strength. At a fixed current strength, tACS effects are not correlated with phosphene or cutaneous sensation intensities. | 11 |
Note: Summary of the different experiments including task conditions, stimulation protocols, and main results.
Summary
In agreement with the results from Experiment 2, tACS at 16 Hz affected the BOLD signal mainly in frontal regions, the insula, and parietal areas bilaterally. The strength of the BOLD signal modulation induced by tACS increased with increasing current strength. No significant difference was observed between EO/EC states. The effect of tACS on the BOLD signal seen in this experiment cannot be explained by the cutaneous sensations as we could not find a correlation between the intensity of cutaneous sensation and the magnitude of beta estimates derived from the tACS modulated regions. We could not find a positive correlation between the effect of tACS and phosphene perception ratings. If anything, there seems to be a negative association between these two measures.
Table VI summarizes the experimental design and main results for all the different experiments.
DISCUSSION
This study investigated the effects of tACS (applied over the posterior cortex) on brain activity as measured with fMRI. We profited from the good spatial resolution of BOLD fMRI to provide a characterization of the brain regions affected by tACS under different conditions. Our main findings are: (1) TACS affected BOLD activity in a frequency‐, task‐, and region‐dependent manner. (2) The expected decrease of BOLD signal within the visual cortex with 10 Hz/16 Hz was not observed. (3) The effects of tACS on the BOLD signal were not observed in the regions beneath the electrodes (i.e., occipital cortex) but mainly in fronto‐parietal areas. (4) TACS effects were predominantly seen in regions that were not activated by the task. (5) The effect of tACS increased with the current strength but at a fixed current strength it could not be explained by phosphene perception or cutaneous sensation intensities. Taken together, our results suggest that the effect of tACS on the BOLD signal is rather complex and the brain regions that are affected by a given tACS frequency are difficult to predict based on current density modeling alone.
Combination of tACS and fMRI
In this study, we used fMRI to investigate the effect of tACS on neural activity. While simultaneous tACS‐EEG might have been a logical choice for this purpose, tACS‐induced EEG artifacts occur exactly at the frequency of interest, spatial resolution is poor and activity within sulci and deeper brain structures cannot be evaluated [Herrmann et al., 2013]. Thus, we chose fMRI taking advantage of the lack of tACS‐induced electrical artifacts on the BOLD signal [Antal et al., 2014], and its good spatial resolution and brain coverage. To our knowledge, most of the studies combining tES and fMRI have been conducted with transcranial direct current stimulation (tDCS). However, results from tDCS cannot be generalized to tACS due to fundamental differences between both techniques. While tDCS is thought to decrease (cathodal tDCS) or increase (anodal tDCS) excitability [Nitsche et al., 2008], tACS is thought to entrain resonance in neuronal populations [Herrmann et al., 2013]. tACS interacts with the ongoing oscillations in the brain and its effects are possibly strongly determined by the peak frequency of the particular network [Reato et al., 2013]. In this sense, it might be possible that the spatial specificity of tACS is given by the varying susceptibility of brain regions to entrain to a given frequency [Thorn and Graybiel, 2014].
TACS Effects on the BOLD Signal are Frequency‐, Task‐, and Region‐dependent
In general, the regions primarily affected by tACS strongly differed between the different task conditions. Several cognitive and brain stimulation studies have already provided evidence that the impact of a specific sensory stimulus (or brain stimulation) is highly dependent on the initial state of the system (for a review see Silvanto et al. [2008]). The response properties of the neurons, the activity levels of the neuronal population, the balance between different functional brain networks or the predominant frequency of ongoing oscillations in the area (among other features) are highly dependent on the initial brain state and the sensory stimulus, and in consequence might determine the effect of tACS. Additional support for this notion has been provided by measuring tACS‐induced changes in motor excitability [Feurra et al., 2013]. In the latter study, the authors applied tACS under different task conditions (rest or motor imagery task) and showed that while theta‐tACS was more effective during the motor imagery task, during rest, the increase in excitability was higher with beta‐tACS, demonstrating that tACS effects on the motor system are also task‐ and frequency‐dependent. Our results are in agreement with this notion and show that this task‐ and frequency‐dependency of tACS effects is reflected in the BOLD signal.
The Expected Decrease of BOLD Signal within Visual Cortex with 10 Hz/16 Hz Was Not Observed
One aspect we have to consider is the relationship between brain oscillations and the BOLD signal. Several studies have shown that alpha/beta frequency power is negatively correlated with the BOLD signal in several brain regions including frontal, parietal, and occipital areas [Goncalves et al., 2006; Laufs et al., 2003; Mayhew et al., 2013; Moosmann et al., 2003; Scheeringa et al., 2011]. However, although less frequently, it has also been shown that the EEG alpha/beta power is positively correlated with the BOLD signal in the default mode network (DMN) during resting state [Mantini et al., 2007; Mo et al., 2013]. Moreover, in the latter study [Mo et al., 2013], the authors found this positive correlation with the alpha power only under an eyes open condition, suggesting that the correlation between the occipital alpha power and the DMN is state‐dependent. We did not find any significant difference between eyes open/eyes closed condition when tACS in the beta frequency band was applied. However we did not compare the effect of tACS at alpha between eyes open vs. eyes closed conditions. Overall, in the different experiments we observed that tACS effects on the BOLD signal are stronger with tACS at alpha/beta frequencies in comparison with gamma frequencies, with activity increases mainly observed in fronto‐parietal regions (together with insular cortex). The effects of alpha/beta tACS in fronto‐parietal regions is reminiscent of a previous magnetoencephalography (MEG) study showing that the correlation of power across cortical regions is stronger in the alpha/beta frequency range mainly in lateral parietal areas [Hipp et al., 2012]. Several studies have found activation of fronto‐parietal regions and insular cortex in different task conditions related to attention, stimulus salience or task difficulty among other processes [Sterzer and Kleinschmidt, 2010]. One could speculate that both (fronto‐parietal areas and insula) are related to attentional processes that are being modulated mainly by tACS at alpha/beta frequency.
The interpretation of the effect of tACS on the BOLD signal is more difficult if we take into account that tACS might also induce cross‐frequency coupling. For example, it has been shown in rat hippocampal slices that gamma oscillations can be strongly modulated by lower‐frequency stimulation (e.g., theta) [Reato et al., 2010]. Moreover, entrainment of gamma band oscillations has been found to decrease the oscillatory alpha power [Helfrich et al., 2014b]. Another interesting idea has been proposed by experiments with transcranial magnetic stimulation (TMS), suggesting that when distant but connected areas to the stimulated regions are significantly activated, they tend to respond with oscillations closer to their own natural frequency [Rosanova et al., 2009]. Taking these facts into account it could be possible that the observed effects on the BOLD signal described here are the result of power changes in different frequency bands via cross‐frequency coupling or that they reflect increased power of the preferred frequency of the area and not the entrainment in the tACS frequency. In addition, we cannot assume a linear relationship between tACS, evoked neurophysiological and BOLD activity, as previous animal studies have shown that applied electrical fields affect single neurons depending on several factors such as alignment of neurons relative to the induced electric field, active channel properties of the neurons and extracellular resistance [Deans et al., 2007; Francis et al., 2003]. Another factor that is not well understood is how neural oscillations are translated into the BOLD signal [Logothetis, 2008; Logothetis and Wandell, 2004]. In fact, it has been shown that in some regions such as the primary visual cortex, the BOLD activity does not always reflect the changes in neural activity [Logothetis, 2008; Maier et al., 2008; Sirotin and Das, 2009; Swettenham et al., 2013].
Another aspect that needs to be taken into account when trying to understand the effect of tACS is the inter‐subject variability that is present in respect to behavioral as well as physiological effects, a problem that tACS shares with other transcranial stimulation techniques such as tDCS and TMS [Li et al., 2015]. Thus, perhaps not surprisingly, in the present study we observed that tACS effects on the BOLD signal are variable between participants. As mentioned above, it has been proposed that the effect of tACS is dependent on the brain state and phase‐relationship between endogenous oscillations and applied tACS [Feurra et al., 2013; Fröhlich and Schmidt, 2013; Herrmann et al., 2013; Neuling et al., 2013]. Thus, the effect of the stimulation might also depend on the arousal and baseline levels of cognitive functions of the participant together with other factors such as neurotransmitter and hormonal levels among others [Krause and Cohen Kadosh, 2014]. The individual frequency of neuronal oscillations within a given region might differ between participants leading to a more or less effective stimulation under constant parameters [Fröhlich and Schmidt, 2013; Reato et al., 2013]. In addition, the current spread with our electrode configuration is not only inhomogeneous but will be influenced by skin, bone, dura mater, vessels, and cerebrospinal fluid [Francis et al., 2003; Jefferys, 1995; Merlet et al., 2013]. In this regard, the different properties of the different tissues (e.g., thickness or conductivity) vary between participants, leading to some variability in the current distribution between different subjects. Future studies could be improved by individualizing tACS parameters (e.g., individual peak frequency) and by using individual modeling of current flow (e.g., taking into account the individual anatomy [Ruffini et al., 2014]).
The Main Effects of tACS on the BOLD Signal Were Not Observed in the Regions Beneath the Electrodes (i.e., Occipital Cortex) But in Fronto‐parietal Areas
Despite our electrode configuration‐thought and shown to affect bilaterally the occipital cortex [Helfrich et al., 2014a; Neuling et al., 2012]‐no systematic effect of tACS was observed in visual areas (only 60 Hz during the visual perception task and 16 Hz during the finger tapping task increased the BOLD signal in visual areas). Instead, the regions that were mostly affected by tACS were located more anterior in temporal and parieto‐frontal cortices. The effect of tACS at 16 Hz was the most consistent finding in our study increasing the BOLD signal in fronto‐parietal areas under every experimental condition. Thus, possibly unlike with tDCS, some degree of region specificity can be achieved with tACS due to varying susceptibility of brain regions to entrain to a given frequency [Thorn and Graybiel, 2014].
One might assume that the direct effect of tACS on the local populations close to the electrodes is not observed in the BOLD signal. There are several aspects that need to be taken into account when interpreting this apparent lack of effect of tACS in the regions close to the electrodes. One aspect to be considered is the coupling between neuronal activity/oscillations and metabolic demand. Let us first assume that tACS entrains oscillations in the neuronal populations (possibly located close to the electrodes) at the applied frequency. While the electric field is applied, these oscillations are not endogenous but externally induced, and it is possible that externally induced oscillations do not lead to major changes in the metabolic demand. Albeit speculative, this might apply only for regions with a direct effect of tACS, but not for areas that show remote (polysynaptic) effects. Our results suggest that the brain regions that are affected by tACS are hard to predict from the electrode configuration alone [Neuling et al., 2012] without concurrent measurements of brain activity such as fMRI. This is of particular interest because most studies using tACS place the electrodes above the target area, assuming that the effect of the stimulation is going to be stronger under the electrodes. Multimodal approaches with combined modeling [Ruffini et al., 2014], tACS/fMRI and electrophysiological studies such as EEG/MEG and optimally intracranial cellular recordings are needed to better understand the brain regions affected by tACS and to validate whether these regions can be properly identified with fMRI. On the other hand, once better understood, tACS itself may facilitate the study of the relationship between neural oscillations and the BOLD signal.
tACS Effects Were Predominantly Seen in Regions That Were Not Activated by the Task
One puzzling result was that during the video viewing and motor task conditions, the effect of tACS was not observed in the regions activated by the specific task. It has previously been shown that tACS‐entrainment strongly depends on the ongoing oscillatory activity. For instance, in an (off‐line) EEG study tACS‐entrainment only occurred when the intrinsic power at this frequency was present, but relatively low [Herrmann et al., 2013]. One could speculate that during the task execution periods the amplitude of the oscillations at the applied frequency in most of the task‐related regions was already at (or close to) a maximum value [Ehm et al., 2011] and therefore tACS did not lead to any further enhancement. Other interpretations are also possible, such that tACS‐affected regions seen with fMRI are determined by the nature of the BOLD signal itself. One should note that the BOLD signal does not always reflect modulations in neural activity [Logothetis, 2008; Maier et al., 2008; Sirotin and Das, 2009; Swettenham et al., 2013]. For example, the metabolic demand of regions that are already optimally driven is less driven by electrical stimulation, as suggested by cortical microstimulation studies in monkeys [Ekstrom et al., 2008]. Also note, that BOLD fMRI might be insensitive to certain forms of modulation, such as changes in the oscillatory phase that is induced by tACS [Ozen et al., 2010] and that might be functionally relevant [Vanrullen, 2011]. Therefore, the lack of tACS‐induced BOLD response in some states does not necessarily reflect a total lack of activity change due to stimulation.
The Effect of tACS Increased With the Current Strength but Could Not Be Explained by Phosphene Perception or Cutaneous Sensation Intensities
We showed that 16 Hz tACS increased the BOLD signal in fronto‐parietal regions in all task conditions. Also, the effect at 16 Hz systematically increased with increasing current strength. This suggests that tACS applied with low currents might not be sufficient to induce changes in brain activity, or at least changes that are detectable with fMRI at our level of power. No significant correlation was observed between the effect of tACS, and phosphene perception and cutaneous sensation ratings. Although a tendency to decreasing the BOLD amplitudes with increasing the intensities of the perceived phosphenes was observed with tACS at 16 Hz with 1,500 µA. In the present study we evaluated phosphene perception and cutaneous sensation intensities by using rating scales. Rating scales of visual and somatosensory sensations have the disadvantage of relying on the introspection of the observer. In addition, rating scales might be susceptible to small variations in the rating strategies between participants. To overcome this limitations we calibrated participants before the fMRI session to rate similar (see Supporting Information for a detailed description). On the basis of the lack of correlation between phosphene perception/cutaneous sensation intensity ratings and the BOLD signal modulation induced by tACS at a fixed current intensity we infer that the increased BOLD activity in fronto‐parietal networks might be related to an increased oscillatory power in beta frequency induced by tACS at 16 Hz independent of any conscious sensory experience.
Limitations of the Current Study
The goal of the present study was to evaluate how tACS modulates regional fMRI BOLD signal as a function of frequency, current strength, and task condition. Accordingly, the experimental designs were adjusted to evaluate transient changes in the BOLD signal and not behavioral effects of tACS. Most of the studies showing tACS modulation of behavior have employed stimulation periods longer than the stimulation periods used in this study [Cabral‐Calderin et al., 2015; Helfrich et al., 2014a; Laczo et al., 2012]. Although our findings are independent of any behavioral modulation, it is possible that behavioral changes modify the strength or spatial distribution of the tACS‐induced effects on the BOLD signal. Future studies could test longer stimulation periods more equivalent to the protocols used in behavioral studies together with recordings of respective behavioral measures. Another aspect to take into account when generalizing our findings is that in the present study we did not compare between electrode montages. We chose a montage that has already been used in behavioral [Cabral‐Calderin et al., 2015; Laczo et al., 2012], computational modeling [Neuling et al., 2012] and EEG studies [Helfrich et al., 2014a] making it easier to have predictions about where to expect tACS effects. However, any generalization of our results to other electrode regimes might not be possible without directly comparing the effect of tACS under the same experimental conditions (e.g., tasks, frequencies) but varying the electrode montages.
CONCLUSION
In the present study we showed the suitability of combining tACS with fMRI to study the effects of tACS on the activity of different brain regions. In general, tACS applied over the posterior cortex affected the BOLD signal in a frequency‐, region‐, and task‐dependent manner and the main effect of tACS was mostly observed not in the targeted regions under the electrodes but in fronto‐parietal regions with lower frequencies. This suggests that region specificity might be achieved with tACS due to varying susceptibility of brain regions to entrain to a given frequency. In addition, our results provide evidence that tACS‐induced modulations of the BOLD signal might not only represent the direct effect of the stimulation but also reflects an interaction between current task/sensory stimulation and the applied tACS frequency.
Supporting information
Supporting Information S1
Supporting Information S2
Supporting Information S3
Supporting Information S4
Supporting Information S5
Supporting Information
ACKNOWLEDGMENTS
The authors thank Ilona Pfahlert and Britta Perl for technical assistance during functional imaging experiments and Severin Heumüller for computer support. They thank Andrea Antal for advice on the tACS stimulation. They also thank Igor Kagan and Julio Hechavarria for helpful comments on an earlier version of the manuscript.
These authors contributed equally to this work.
REFERENCES
- Ali MM, Sellers KK, Fröhlich F (2013): Transcranial alternating current stimulation modulates large‐scale cortical network activity by network resonance. J Neurosci 33:11262–11275. [DOI] [PMC free article] [PubMed] [Google Scholar]
- Antal A, Polania R, Schmidt‐Samoa C, Dechent P, Paulus W (2011): Transcranial direct current stimulation over the primary motor cortex during fMRI. Neuroimage 55:590–596. [DOI] [PubMed] [Google Scholar]
- Antal A, M Bikson, A Datta, B Lafon, P Dechent, LC Parra, W Paulus (2014): Imaging artifacts induced by electrical stimulation during conventional fMRI of the brain. Neuroimage 85:1040–1047. [DOI] [PMC free article] [PubMed] [Google Scholar]
- Brittain JS, Probert‐Smith P, Aziz TZ, Brown P (2013): Tremor suppression by rhythmic transcranial current stimulation. Curr Biol 23:436–440. [DOI] [PMC free article] [PubMed] [Google Scholar]
- Cabral‐Calderin Y, Schmidt‐Samoa C, Wilke M (2015): Rhythmic gamma stimulation affects bistable perception. J Cogn Neurosci 27:1298–30. [DOI] [PubMed] [Google Scholar]
- Chen AC, Feng W, Zhao H, Yin Y, Wang P (2008): EEG default mode network in the human brain: Spectral regional field powers. Neuroimage 41:561–574. [DOI] [PubMed] [Google Scholar]
- Deans JK, Powell AD, Jefferys JG (2007): Sensitivity of coherent oscillations in rat hippocampus to AC electric fields. J Physiol 583:555–565. [DOI] [PMC free article] [PubMed] [Google Scholar]
- Ehm W, Bach M, Kornmeier J (2011): Ambiguous figures and binding: EEG frequency modulations during multistable perception. Psychophysiology 48:547–558. [DOI] [PubMed] [Google Scholar]
- Ekstrom LB, Roelfsema PR, Arsenault JT, Bonmassar G, Vanduffel W (2008): Bottom‐up dependent gating of frontal signals in early visual cortex. Science 321:414–417. [DOI] [PMC free article] [PubMed] [Google Scholar]
- Fedorov A, Y Chibisova, A Szymaszek, M Alexandrov, C Gall, BA Sabel (2010): Non‐invasive alternating current stimulation induces recovery from stroke. Restor Neurol Neurosci 28:825–833. [DOI] [PubMed] [Google Scholar]
- Feurra M, Paulus W, Walsh V, Kanai R (2011): Frequency specific modulation of human somatosensory cortex. Front Psychol 2:13. [DOI] [PMC free article] [PubMed] [Google Scholar]
- Feurra M, P Pasqualetti, G Bianco, E Santarnecchi, A Rossi, S Rossi (2013): State‐dependent effects of transcranial oscillatory currents on the motor system: What you think matters. J Neurosci 33:17483–17489. [DOI] [PMC free article] [PubMed] [Google Scholar]
- Francis JT, Gluckman BJ, Schiff SJ (2003): Sensitivity of neurons to weak electric fields. J Neurosci 23:7255–7261. [DOI] [PMC free article] [PubMed] [Google Scholar]
- Fröhlich F, Schmidt SL (2013): Rational design of transcranial current stimulation (TCS) through mechanistic insights into cortical network dynamics. Front Hum Neurosci 7:804. [DOI] [PMC free article] [PubMed] [Google Scholar]
- Goncalves SI, JC de Munck, PJ Pouwels, R Schoonhoven, JP Kuijer, NM Maurits, JM Hoogduin, EJ Van Someren, RM Heethaar, FH Lopes da Silva (2006): Correlating the alpha rhythm to BOLD using simultaneous EEG/fMRI: Inter‐subject variability. Neuroimage 30:203–213. [DOI] [PubMed] [Google Scholar]
- Helfrich RF, TR Schneider, S Rach, SA Trautmann‐Lengsfeld, AK Engel, CS Herrmann (2014a): Entrainment of brain oscillations by transcranial alternating current stimulation. Curr Biol 24:333–339. [DOI] [PubMed] [Google Scholar]
- Helfrich RF, H Knepper, G Nolte, D Strüber, S Rach, CS Herrmann, TR Schneider, AK Engel (2014b): Selective modulation of interhemispheric functional connectivity by HD‐tACS shapes perception. PLoS Biol 12:e1002031. [DOI] [PMC free article] [PubMed] [Google Scholar]
- Herrmann CS, Rach S, Neuling T, Struber D (2013): Transcranial alternating current stimulation: A review of the underlying mechanisms and modulation of cognitive processes. Front Hum Neurosci 7:279. [DOI] [PMC free article] [PubMed] [Google Scholar]
- Hipp JF, Hawellek DJ, Corbetta M, Siegel M, Engel AK (2012): Large‐scale cortical correlation structure of spontaneous oscillatory activity. Nat Neurosci 15:884–890. [DOI] [PMC free article] [PubMed] [Google Scholar]
- Jefferys JG (1995): Nonsynaptic modulation of neuronal activity in the brain: Electric currents and extracellular ions. Physiol Rev 75:689–723. [DOI] [PubMed] [Google Scholar]
- Joundi RA, Jenkinson N, Brittain JS, Aziz TZ, Brown P (2012): Driving oscillatory activity in the human cortex enhances motor performance. Curr Biol 22:403–407. [DOI] [PMC free article] [PubMed] [Google Scholar]
- Kanai R, Chaieb L, Antal A, Walsh V, Paulus W (2008): Frequency‐dependent electrical stimulation of the visual cortex. Curr Biol 18:1839–1843. [DOI] [PubMed] [Google Scholar]
- Kar K, Krekelberg B (2014): Transcranial alternating current stimulation attenuates visual motion adaptation. J Neurosci 34:7334–7340. [DOI] [PMC free article] [PubMed] [Google Scholar]
- Krause B, Cohen Kadosh R (2014): Not all brains are created equal: The relevance of individual differences in responsiveness to transcranial electrical stimulation. Front Syst Neurosci 8:25. [DOI] [PMC free article] [PubMed] [Google Scholar]
- Kriegeskorte N, Goebel R (2001): An efficient algorithm for topologically correct segmentation of the cortical sheet in anatomical mr volumes. Neuroimage 14:329–346. [DOI] [PubMed] [Google Scholar]
- Laczo B, Antal A, Niebergall R, Treue S, Paulus W (2012): Transcranial alternating stimulation in a high gamma frequency range applied over V1 improves contrast perception but does not modulate spatial attention. Brain Stimul 5:484–491. [DOI] [PubMed] [Google Scholar]
- Laufs H, A Kleinschmidt, A Beyerle, E Eger, A Salek‐Haddadi, C Preibisch, K Krakow (2003): EEG‐correlated fMRI of human alpha activity. Neuroimage 19:1463–1476. [DOI] [PubMed] [Google Scholar]
- Li LM, Uehara K, Hanakawa T (2015): The contribution of interindividual factors to variability of response in transcranial direct current stimulation studies. Front Cell Neurosci 9:181. [DOI] [PMC free article] [PubMed] [Google Scholar]
- Logothetis NK (2008): What we can do and what we cannot do with fMRI. Nature 453:869–878. [DOI] [PubMed] [Google Scholar]
- Logothetis NK, Wandell BA (2004): Interpreting the BOLD signal. Annu Rev Physiol 66:735–769. [DOI] [PubMed] [Google Scholar]
- Logothetis NK, Pauls J, Augath M, Trinath T, Oeltermann A (2001): Neurophysiological investigation of the basis of the fMRI signal. Nature 412:150–157. [DOI] [PubMed] [Google Scholar]
- Magri C, Schridde U, Murayama Y, Panzeri S, Logothetis NK (2012): The amplitude and timing of the BOLD signal reflects the relationship between local field potential power at different frequencies. J Neurosci 32:1395–1407. [DOI] [PMC free article] [PubMed] [Google Scholar]
- Maier A, M Wilke, C Aura, C Zhu, FQ Ye, DA Leopold (2008): Divergence of fMRI and neural signals in V1 during perceptual suppression in the awake monkey. Nat Neurosci 11:1193–1200. [DOI] [PMC free article] [PubMed] [Google Scholar]
- Mantini D, Perrucci MG, Del Gratta C, Romani GL, Corbetta M (2007): Electrophysiological signatures of resting state networks in the human brain. Proc Natl Acad Sci USA 104:13170–13175. [DOI] [PMC free article] [PubMed] [Google Scholar]
- Mayhew SD, Ostwald D, Porcaro C, Bagshaw AP (2013): Spontaneous EEG alpha oscillation interacts with positive and negative BOLD responses in the visual‐auditory cortices and default‐mode network. Neuroimage 76:362–372. [DOI] [PubMed] [Google Scholar]
- Merlet I, G Birot, R Salvador, B Molaee‐Ardekani, A Mekonnen, A Soria‐Frish, G Ruffini, PC Miranda, F Wendling (2013): From oscillatory transcranial current stimulation to scalp EEG changes: A biophysical and physiological modeling study. PLoS One 8:e57330. [DOI] [PMC free article] [PubMed] [Google Scholar]
- Mo J, Liu Y, Huang H, Ding M (2013): Coupling between visual alpha oscillations and default mode activity. Neuroimage 68:112–118. [DOI] [PMC free article] [PubMed] [Google Scholar]
- Moosmann M, P Ritter, I Krastel, A Brink, S Thees, F Blankenburg, B Taskin, H Obrig, A Villringer (2003): Correlates of alpha rhythm in functional magnetic resonance imaging and near infrared spectroscopy. Neuroimage 20:145–158. [DOI] [PubMed] [Google Scholar]
- Neuling T, Wagner S, Wolters CH, Zaehle T, Herrmann CS (2012): Finite‐element model predicts current density distribution for clinical applications of tDCS and tACS. Front Psychiatr 3:83. [DOI] [PMC free article] [PubMed] [Google Scholar]
- Neuling T, Rach S, Herrmann CS (2013): Orchestrating neuronal networks: Sustained after‐effects of transcranial alternating current stimulation depend upon brain states. Front Hum Neurosci 7:161. [DOI] [PMC free article] [PubMed] [Google Scholar]
- Niessing J, B Ebisch, KE Schmidt, M Niessing, W Singer, RA Galuske (2005): Hemodynamic signals correlate tightly with synchronized gamma oscillations. Science 309:948–951. [DOI] [PubMed] [Google Scholar]
- Nitsche MA, LG Cohen, EM Wassermann, A Priori, N Lang, A Antal, W Paulus, F Hummel, PS Boggio, F Fregni, A Pascual‐Leone (2008): Transcranial direct current stimulation: State of the art 2008. Brain Stimul 1:206–223. [DOI] [PubMed] [Google Scholar]
- Ozen S, A Sirota, MA Belluscio, CA Anastassiou, E Stark, C Koch, G Buzsáki (2010): Transcranial electric stimulation entrains cortical neuronal populations in rats. J Neurosci 30:11476–11485. [DOI] [PMC free article] [PubMed] [Google Scholar]
- Polania R, Nitsche MA, Korman C, Batsikadze G, Paulus W (2012): The importance of timing in segregated theta phase‐coupling for cognitive performance. Curr Biol 22:1314–1318. [DOI] [PubMed] [Google Scholar]
- Power JD, Barnes KA, Snyder AZ, Schlaggar BL, Petersen SE (2012): Spurious but systematic correlations in functional connectivity MRI networks arise from subject motion. Neuroimage 59:2142–2154. [DOI] [PMC free article] [PubMed] [Google Scholar]
- Reato D, Rahman A, Bikson M, Parra LC (2010): Low‐intensity electrical stimulation affects network dynamics by modulating population rate and spike timing. J Neurosci 30:15067–15079. [DOI] [PMC free article] [PubMed] [Google Scholar]
- Reato D, Rahman A, Bikson M, Parra LC (2013): Effects of weak transcranial alternating current stimulation on brain activity—A review of known mechanisms from animal studies. Front Hum Neurosci 7:687. [DOI] [PMC free article] [PubMed] [Google Scholar]
- Ritter P, Moosmann M, Villringer A (2009): Rolandic alpha and beta EEG rhythms' strengths are inversely related to fMRI‐BOLD signal in primary somatosensory and motor cortex. Hum Brain Mapp 30:1168–1187. [DOI] [PMC free article] [PubMed] [Google Scholar]
- Rosanova M, A Casali, V Bellina, F Resta, M Mariotti, M Massimini (2009): Natural frequencies of human corticothalamic circuits. J Neurosci 29:7679–7685. [DOI] [PMC free article] [PubMed] [Google Scholar]
- Ruffini G, Fox MD, Ripolles O, Miranda PC, Pascual‐Leone A (2014): Optimization of multifocal transcranial current stimulation for weighted cortical pattern targeting from realistic modeling of electric fields. Neuroimage 89:216–225. [DOI] [PMC free article] [PubMed] [Google Scholar]
- Santarnecchi E, NR Polizzotto, M Godone, F Giovannelli, M Feurra, L Matzen, A Rossi, S Rossi (2013): Frequency‐dependent enhancement of fluid intelligence induced by transcranial oscillatory potentials. Curr Biol 23:1449–1453. [DOI] [PubMed] [Google Scholar]
- Scheeringa R, P Fries, KM Petersson, R Oostenveld, I Grothe, DG Norris, P Hagoort, MC Bastiaansen (2011): Neuronal dynamics underlying high‐ and low‐frequency EEG oscillations contribute independently to the human BOLD signal. Neuron 69:572–583. [DOI] [PubMed] [Google Scholar]
- Silvanto J, Muggleton N, Walsh V (2008): State‐dependency in brain stimulation studies of perception and cognition. Trends Cogn Sci 12:447–454. [DOI] [PubMed] [Google Scholar]
- Sirotin YB, Das A (2009): Anticipatory haemodynamic signals in sensory cortex not predicted by local neuronal activity. Nature 457:475–479. [DOI] [PMC free article] [PubMed] [Google Scholar]
- Sterzer P, Kleinschmidt A (2010): Anterior insula activations in perceptual paradigms: Often observed but barely understood. Brain Struct Funct 214:611–622. [DOI] [PubMed] [Google Scholar]
- Struber D, Rach S, Trautmann‐Lengsfeld SA, Engel AK, Herrmann CS (2014): Antiphasic 40 Hz oscillatory current stimulation affects bistable motion perception. Brain Topogr 27:158–171. [DOI] [PubMed] [Google Scholar]
- Swettenham JB, Muthukumaraswamy SD, Singh KD (2013): BOLD responses in human primary visual cortex are insensitive to substantial changes in neural activity. Front Hum Neurosci 7:76. [DOI] [PMC free article] [PubMed] [Google Scholar]
- Thorn CA, Graybiel AM (2014): Differential entrainment and learning‐related dynamics of spike and local field potential activity in the sensorimotor and associative striatum. J Neurosci 34:2845–2859. [DOI] [PMC free article] [PubMed] [Google Scholar]
- Vanrullen R (2011): Ongoing EEG phase as a trial‐by‐trial signature of perceptual and attentional rhythms. Perception 40:6–6. [DOI] [PMC free article] [PubMed] [Google Scholar]
- Wach C, V Krause, V Moliadze, W Paulus, A Schnitzler, B Pollok (2013): Effects of 10 Hz and 20 Hz transcranial alternating current stimulation (tACS) on motor functions and motor cortical excitability. Behav Brain Res 241:1–6. [DOI] [PubMed] [Google Scholar]
- Zaehle T, Rach S, Herrmann CS (2010): Transcranial alternating current stimulation enhances individual alpha activity in human EEG. PLoS One 5:e13766. [DOI] [PMC free article] [PubMed] [Google Scholar]
Associated Data
This section collects any data citations, data availability statements, or supplementary materials included in this article.
Supplementary Materials
Supporting Information S1
Supporting Information S2
Supporting Information S3
Supporting Information S4
Supporting Information S5
Supporting Information