

ABSTRACT
BACKGROUND
Brain lesions converting to chronic T1 hypointensities (“chronic black holes” [CBH]), indicate severe tissue destruction (axonal loss and irreversible demyelination) in multiple sclerosis (MS). Two mechanisms by which fingolimod could limit MS lesion evolution include sequestration of lymphocytes in the periphery or direct neuroprotective effects. We investigated the effect of fingolimod on the evolution of acute gadolinium‐enhancing (Gd+) brain lesions to CBH in patients with MS.
METHODS
This was a retrospective nonrandomized comparison of patients with Gd+ brain lesions at the time of starting oral fingolimod [.5 mg/day, n = 26, age (mean ± SD) 39.2 ± 10.6 years, Expanded Disability Status Scale (EDSS) score ‐ median (range): 1.75 (0, 6.5)] to those on no therapy [n = 30, age 41.7 ± 9.3 years; EDSS 1.0 (0, 6)]. Each lesion was classified by whether it converted to a CBH in the year following treatment.
RESULTS
In the fingolimod group, 99 Gd+ baseline lesions (mean ± SD, range: 3.8 ± 5.1; 1, 21 per patient) were identified of which 25 (25%) evolved to CBH (1.0 ± 2.0; 0, 10 per patient). The untreated group had 62 baseline Gd+ lesions (2.1 ± 2.3; 1, 13), 26 (42%) of which evolved to CBH (.9 ± 1.4; 0, 7) (P = .063). Thirteen patients (50%) receiving fingolimod and 17 untreated patients (57%) developed CBH (P = .79).
CONCLUSION
This pilot study shows a trend of fingolimod on reducing the conversion rate from acute to chronic destructive MS lesions. Such an effect awaits verification in larger randomized prospective studies.
Keywords: Black holes, fingolimod, gadolinium‐enhancing lesions, MRI, Multiple sclerosis
Introduction
Multiple sclerosis (MS) is an inflammatory autoimmune disease of the central nervous system with neurodegenerative consequences. Gadolinium‐enhancing (Gd+) lesions on postcontrast T1‐weighted MRI scans indicate localized disruption of the blood brain barrier and are a sensitive marker of active demyelination.1 On average, enhancement lasts for 3 weeks during which time the lesion often appears hypointense on noncontrast T1‐weighted images when compared to surrounding white matter.1 When enhancement ends, lesions evolve into either T1 isointense or persistently hypointense areas. The latter are commonly referred to as “chronic black holes” (CBHs) and represent irreversible demyelination and axonal loss.1, 2 Longitudinal MRI has shown that CBHs correlate better with disability than T2‐weighted hyperintense lesions, indicating a more clinically relevant surrogate of disease progression.2
During the past 2 decades, more than 10 disease‐modifying therapies (DMTs) have been approved for MS.3 The first orally administered of these therapies, fingolimod, limits clinical and MRI aspects of disease by reducing relapse rate, progression of physical disability, formation of new T2 hyperintense and Gd+ lesions, and brain atrophy.4, 5, 6 Other approved DMTs also limit the rate of evolution of new Gd+ lesions to CBH.7, 8, 9 The purpose of this pilot study was to explore the effect of fingolimod on such lesion conversion.
Methods
This was a nonrandomized 2‐arm retrospective study of 56 patients with MS (Table 1) who had Gd+ brain lesions while either newly started on fingolimod (.5 mg/day) or receiving no DMTs. There was a mean of 7 months (range 0, 81 months) between previous DMT use and fingolimod initiation. Baseline MRI was performed (mean ± SD) 1.8 ± 2.2 months within fingolimod initiation (range 3 months prior to 4 months after). Fifty‐seven percent of the patients in the untreated group had received DMTs in the past. These patients discontinued therapy, on average, 33.7 (range 2, 107) months prior to baseline MRI. The remaining patients in the untreated group had no prior exposure to DMTs. Follow‐up MRI was performed 12.6 ± 2.0 (range 9, 19) months later. All patients had MS by the International Panel criteria.10 A neurologist scored the Expanded Disability Status Scale (EDSS)11 and timed 25‐foot walk (T25FW).12 None had corticosteroids within 30 days prior to MRI. The Partners Institutional Review Board approved this study.
Table 1.
Patient Clinical, Demographic, and MRI Data
| Fingolimod (n = 26) | Untreated (n = 30) | P Value | |
|---|---|---|---|
| Age (years) (mean ± SD) | 39.2 ± 10.6 | 41.7 ± 9.3 | 0.36+ |
| Females, n (%) | 23 (88%) | 28 (93%) | 0.65* |
| Disease category, n (%) | |||
| Relapsing‐remitting | 24 (92%) | 29 (97%) | 0.21* |
| Secondary progressive | 2 (8%) | – | |
| Clinically isolated syndrome | – | 1 (3%) | |
| Disease duration† (years) (mean ± SD) | 8.0 ± 6.1 | 8.1 ± 6.1 | 0.91+ |
| Clinical data | |||
| ‐Baseline | |||
| EDSS score (median, range) | 1.75 (0, 6.5) | 1 (0, 6) | 0.10# |
| T25FW (median, range) | 4.7 (3.3, 99) | 5.0 (3.5, 7.0) | 0.89# |
| ‐1‐Year follow‐up | |||
| EDSS score (median, range) | 1.5 (0, 6) | 1 (0, 4) | 0.045# |
| T25FW (median, range) | 4.9 (3.7, 18.7) | 4.5 (3.0, 9.0) | 0.35# |
| Number of on‐study relapses | 8 | 6 | 0.38* |
| Gd+ lesions # (% per patient) | 99 (100%) | 62 (100%) | |
| Per patient mean ± SD (range) | 3.8 ± 5.1 (1, 21) | 2.1 ± 2.3 (1, 13) | 0.077# |
| CBH resulting from Gd+ lesions # (%) | 25 (25%) | 26 (42%) | 0.063^ |
| Per patient mean ± SD (range) | 1.0 ± 2.0 (0, 10) | 0.9 ± 1.4 (0, 7) | |
| Patients developing CBH from acute Gd+ lesions, n (%) | 13 (50%) | 17 (57%) | 0.79* |
SD = standard deviation; EDSS = expanded disability status scale; T25FW = timed 25 foot walk, seconds; Gd+ = gadolinium‐enhancing; CBH = chronic black hole.
†Since first symptoms.
+Two‐sample t‐test.
*Fisher's exact test.
#Wilcoxon rank sum test.
^Generalized estimating equations model.
Patients underwent MRI on 1.5T GE scanners which included dual‐echo conventional spin‐echo T2‐weighted, and pre‐ and postcontrast T1‐weighted images using axial 3 mm gapless slices. Two experienced observers, who were blind to clinical details, identified (by consensus) baseline Gd+ lesions which coincided with T2 hyperintensities and determined if they converted to CBHs.
Age and disease duration were compared using 2‐sample t‐tests. Gender, disease category, presence of an attack, and at least 1 CBH were compared using Fisher's exact tests. Wilcoxon rank sum tests compared ordinal or skewed variables (EDSS, T25FW, and number of baseline Gd+ lesions). A generalized estimating equations model with an exchangeable working correlation structure and robust standard errors compared the groups on the probability of conversion of a Gd+ lesion to a CBH, accounting for the correlation of within‐subject lesions. A P value <.05 was considered significant, and >.05 but <.10 was considered a trend.
Results
Results are summarized in Table 1 and Figure 1. The demographic and clinical characteristics were similar except that the fingolimod group had higher follow‐up EDSS scores (P = .045) and a trend toward higher baseline Gd+ lesions (P = .077) which may have caused a selection bias. In the fingolimod group, of 99 baseline Gd+ lesions, 25 (25%) evolved to CBH. In the untreated group, of 62 baseline Gd+ lesions, 26 (42%) evolved to CBH. Lesions trended to being more likely to convert to CBH in the untreated versus fingolimod group (OR = .48; 95% CI: .22, 1.04; P = .063). Thirteen patients (50%) receiving fingolimod and 17 untreated patients (57%) developed at least 1 CBH from acute lesions (P = .79).
Figure 1.
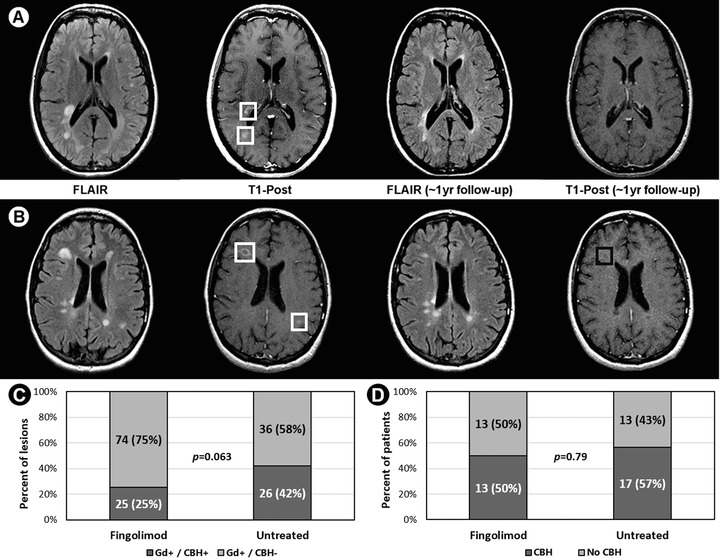
(A) Two baseline gadolinium‐enhancing (Gd+) lesions (white boxes) not converting to chronic black holes (CBH). (B) Two baseline Gd+ lesions (white boxes); 1 converted to a CBH (black box). (C) and (D) Fingolimod versus untreated groups on (C) percent of baseline Gd+ lesions converting to CBH at follow‐up, and (D) percent of patients developing CBH.
Key for A/B: FLAIR: fluid‐attenuated inversion‐recovery; T1‐Post: T1‐weighted post‐contrast gadolinium scan. Key for C: Gd+/CBH+: baseline Gd+ lesions converting to CBH; Gd+/CBH‐: baseline Gd+ lesions not converting to CBH.
Discussion
Previously completed randomized placebo‐controlled clinical trials demonstrated fingolimod's ability to limit the progression of cerebral lesion load and atrophy as defined by MRI.4, 5, 6 Our pilot study aimed to explore an additional aspect of a therapeutic effect of this agent, namely the effect on the evolution of acute lesions. While this study was limited by a retrospective design, possible selection bias, and small sample size, these preliminary results suggest that fingolimod favorably limits the conversion of acute lesions to chronic destructive lesions.
There are 2 potential mechanisms by which fingolimod could exert a treatment effect on lesion evolution. First, by modulating the sphinghosine‐1‐phosphate (S1P) receptor, fingolimod sequesters lymphocytes in secondary lymphoid organs, resulting in fewer circulating autoreactive T cells available to infiltrate the CNS.13 Thus, the acute lesions in our patients starting fingolimod therapy may have developed less inflammation infiltration in their early stages, leading to less severe long‐term injury. Second, fingolimod is hypothesized to have direct treatment effects within the brain.13, 14, 15 For example, Fingolimod's lipophilic properties allow it to cross the blood brain barrier where it may provide in situ neuroprotective effects by modulating the S1P receptor on neural cells.14, 15
Furthermore, all 3 pivotal phase III clinical treatment trials of fingolimod in patients with MS have shown an effect on limiting the rate of brain atrophy, appearing as early as 6 months after starting therapy.4, 5, 6, 16 Taken together, these findings suggest that one of the mechanisms by which fingolimod limits tissue destruction is through a favorable effect on limiting the damage resulting from new lesions.
In conclusion, these preliminary results suggest that fingolimod attenuates the evolution of newly formed lesions to a less destructive pathology. However, the effect was partial and showed a trend but did not reach statistical significance in this small single‐center study. Furthermore, the results appeared to be driven by large effects on a subset of patients rather than consistent effects throughout all subjects. More definitive results on such a treatment effect of fingolimod will likely be derived from post hoc analyses of large randomized placebo‐controlled multicenter clinical trial data sets. Such analyses are currently ongoing.17
Acknowledgment
We thank Mariann Polgar‐Turcsanyi for database management and Mark C. Anderson for technical assistance.
Disclosures of conflicts of interest: This study was supported by Novartis Pharmaceuticals. Dr. Healy received research support from Merck‐Serono, Genzyme, and Novartis. Drs. Malik and Diaz‐Cruz received research support from Merck‐Serono. Dr. Chitnis received consulting fees from Biogen, Merck‐Serono, and Alexion and research support from Merck‐Serono and Novartis. Dr. Bakshi received consulting fees from AbbVie, Alkermes, Biogen, Novartis, and Questcor and research support from Biogen, Merck‐Serono, Novartis, Genzyme and Teva. The other authors have nothing to disclose.
References
- 1. Zivadinov R, Bakshi R. Role of MRI in multiple sclerosis I: inflammation and lesions. Front Biosci 2004;9:665‐83. [DOI] [PubMed] [Google Scholar]
- 2. Truyen L, van Waesberghe JH, van Walderveen MA, et al. Accumulation of hypointense lesions (“black holes”) on T1 spin‐echo MRI correlates with disease progression in multiple sclerosis. Neurology 1996;47:1469‐76. [DOI] [PubMed] [Google Scholar]
- 3. Sorensen PS. New management algorithms in multiple sclerosis. Curr Opin Neurol 2014;27:246‐59. [DOI] [PubMed] [Google Scholar]
- 4. Calabresi PA, Radue E‐W, Goodin D, et al. Safety and efficacy of fingolimod in patients with relapsing‐remitting multiple sclerosis (FREEDOMS II): a double‐blind, randomised, placebo‐controlled, phase 3 trial. Lancet Neurol 2014;13:545‐56. [DOI] [PubMed] [Google Scholar]
- 5. Kappos L, Radue E‐W, O'Connor P, et al. A placebo‐controlled trial of oral fingolimod in relapsing multiple sclerosis. N Engl J Med 2010;362:387‐401. [DOI] [PubMed] [Google Scholar]
- 6. Cohen JA, Barkhof F, Comi G, et al. Oral fingolimod or intramuscular interferon for relapsing multiple sclerosis. N Engl J Med 2010;362:402‐15. [DOI] [PubMed] [Google Scholar]
- 7. Bagnato F, Gupta S, Richert ND, et al. Effects of interferon beta‐1b on black holes in multiple sclerosis over a 6‐year period with monthly evaluations. Arch Neurol 2005;62:1684‐8. [DOI] [PubMed] [Google Scholar]
- 8. Dalton CM, Miszkiel KA, Barker GJ, et al. Effect of natalizumab on conversion of gadolinium enhancing lesions to T1 hypointense lesions in relapsing multiple sclerosis. J Neurol 2004;251:407‐13. [DOI] [PubMed] [Google Scholar]
- 9. Filippi M, Rovaris M, Rocca MA, et al. Glatiramer acetate reduces the proportion of new MS lesions evolving into ‘black holes’. Neurology 2001;57:731‐3. [DOI] [PubMed] [Google Scholar]
- 10. Polman CH, Reingold SC, Edan G, et al. Diagnostic criteria for multiple sclerosis: 2005 revisions to the ‘McDonald Criteria’. Ann Neurol 2005;58:840‐6. [DOI] [PubMed] [Google Scholar]
- 11. Kurtzke JF. Rating neurologic impairment in multiple sclerosis: an expanded disability status scale (EDSS). Neurology 1983;33:1444‐52. [DOI] [PubMed] [Google Scholar]
- 12. Fischer JS, Rudick RA, Cutter GR, et al. The multiple sclerosis functional composite measure (MSFC): an integrated approach to MS clinical outcome assessment. National MS Society Clinical Outcomes Assessment Task Force. Mult Scler 1999;5:244‐ 50. [DOI] [PubMed] [Google Scholar]
- 13. Brinkmann V, Billich A, Baumruker T, et al. Fingolimod (FTY720): discovery and development of an oral drug to treat multiple sclerosis. Nat Rev Drug Discov 2010;9:883‐ 97. [DOI] [PubMed] [Google Scholar]
- 14. Cipriani R, Chara JC, Rodríguez‐Antigüedad A, et al. FTY720 attenuates excitotoxicity and neuroinflammation. J Neuroinflammation 2015;12:86. [DOI] [PMC free article] [PubMed] [Google Scholar]
- 15. Di Pardo A, Amico E, Favellato M, et al. FTY720 (fingolimod) is a neuroprotective and disease‐modifying agent in cellular and mouse models of Huntington disease. Hum Mol Genet 2014;23:2251‐65. [DOI] [PubMed] [Google Scholar]
- 16. Tsivgoulis G, Katsanos AH, Grigoriadis N, et al. The effect of disease modifying therapies on brain atrophy in patients with relapsing‐remitting multiple sclerosis: a systematic review and meta‐analysis. PLoS One. 2015;10(3):e0116511. [DOI] [PMC free article] [PubMed] [Google Scholar]
- 17. Sprenger T, Radue EW, Mueller‐Lenke N, et al. The effect of fingolimod on T1‐hypointense lesions developed on‐study and evolution of pre‐existing Gd+ lesions, stratified by lesion size: A posthoc analysis of FREEDOMS study (abstract). Neurology 2015;84(14 suppl):P7.245. [Google Scholar]