

Abstract
This study evaluated the effects of cytochrome P450 (CYP) 2C19 polymorphisms on tacrolimus pharmacokinetics when coadministered with voriconazole. Eighteen healthy volunteers, including 6 individuals in each CYP2C19 genotype (extensive metabolizers [EMs], intermediate metabolizers [IMs], and poor metabolizers [PMs]), received a single oral dose of 3 mg tacrolimus alone or in combination with 200 mg voriconazole twice daily at steady state. When tacrolimus was coadministered with voriconazole, a significant increase in area under its concentration‐time curve (AUC0‐24) was observed for all genotypes. AUC0‐12 of voriconazole in IMs and PMs were significantly higher than that in EMs (P < .05 and P < .01, respectively). Consequently, AUC0‐24 of tacrolimus in combination with voriconazole in IMs and PMs were also significantly higher than that in EMs (P < .05). These results demonstrate that CYP2C19 genotypes influenced the exposure of tacrolimus when coadministered with voriconazole, although tacrolimus is mainly metabolized by CYP3A.
Keywords: tacrolimus, voriconazole, drug interaction, CYP2C19 polymorphism, CYP3A
Voriconazole is a second‐generation triazole antifungal agent that has activity against both Candida and Aspergillus species. Because it is a substrate for and inhibitor of CYP2C19, CYP2C9, and CYP3A,1 the metabolism of other drugs that are substrates of these CYPs may be inhibited by voriconazole.2, 3 Furthermore, its coadministration can lead to toxic levels of those drugs if the therapeutic index is narrow. Calcineurin inhibitors such as cyclosporine and tacrolimus are immunosuppressive agents and substrates of CYP3A,4, 5, 6 so frequent therapeutic drug monitoring (TDM) of those drugs is essential to maximize their efficacy as well as minimize toxicities. Cyclosporine and tacrolimus are commonly administered concurrently with voriconazole in order to prevent fungal infections early after allogeneic hematopoietic stem cell transplantation (HSCT). However, it has been reported that tacrolimus trough levels are elevated when voriconazole is coadministered in transplant recipients.7, 8, 9
Voriconazole exposure depends on the CYP2C19 genotype. In particular, 15% to 20% of Asians and 3% to 5% of whites and blacks are estimated to be poor metabolizers (PMs).10 Clinical studies illustrated that CYP2C19 PMs and intermediate metabolizers (IMs) achieve 4‐ and 2‐fold higher voriconazole exposure (area under the concentration‐time curve, AUCτ), respectively, than that achieved by extensive metabolizers (EMs).2 Thus, it was expected that the extent of interaction between tacrolimus and voriconazole may be affected by CYP2C19 polymorphisms because the magnitude of inhibition of the metabolism of tacrolimus by CYP3A was dependent on the concentration of voriconazole within a specific range, in vitro, in human liver microsomes.7, 11
This study was conducted to determine the effect of CYP2C19 polymorphisms on pharmacokinetics of tacrolimus when coadministered with voriconazole and to assess the extent to which this interaction is impacted by the CYP2C19 genotype.
Methods
Study Conduct
The study protocol was approved by the Institutional Review Board of the P‐One Clinic and was conducted at the P‐One Clinic, Tokyo, Japan. The study was registered at the UMIN Clinical Trials Registry under the number UMIN000011278. The study procedures were in accordance with the ethical standards of the Declaration of Helsinki. Written informed consent was obtained from each subject prior to enrollment.
Study Population
Polymorphisms of CYP2C19 were determined before the study. Genomic deoxyribonucleic acid (DNA) was extracted from venous blood sample by DNA Extractor WB‐Rapid Kit (Wako Pure Chemical Industries, Ltd, Osaka, Japan). Detection of the CYP2C19*2 (681G>A, rs4244285) and *3 (636G>A, rs4986893) alleles was performed by polymerase chain reaction with confronting 2‐pair primers (PCR‐CTPP).12 The amplified DNA was visualized on a 2% agarose gel with ethidium bromide staining.
Eighteen healthy male Japanese volunteers, including 6 CYP2C19 EMs (*1/*1), 6 IMs (*1/*2 or *1/*3), and 6 PMs (*2/*2, *2/*3, or *3/*3), were enrolled in this study. None of the volunteers had a history of systemic disease or abnormal laboratory renal and hepatic function values. All volunteers were asked to abstain from any medications, supplements, and grapefruit products (1 week before) and smoking (4 weeks before) through the end of each sample collection period.
Study Design
A single‐center, open, crossover study with 2 treatment phases was conducted. The subjects were hospitalized during the study. Three milligrams of tacrolimus (3 capsules of Prograf, 1 mg; Astellas, Tokyo, Japan) were administrated orally together with 150 mL of water after an overnight fast at 10:00 am on days 1 and 5. Four hundred milligrams of voriconazole (2 tablets of Vfend, 200 mg; Pfizer, Karlsruhe, Germany) were administered twice daily at 10:00 am and 10:00 pm 2 hours after each meal as a loading dose on day 2 and 200 mg of voriconazole (1 tablet of Vfend, 200 mg) were administered orally twice daily on days 3, 4, and 5 together with 150 mL of water. Standard meals or snacks were served at 4, 6.5, and 10 hours after the administration of tacrolimus on days 1 and 5. Alcoholic and caffeinated beverages were not allowed during the study. Vital signs including blood pressure and pulse rate were monitored regularly during the study.
Blood Sampling
On days 1 and 5, serial venous blood samples were collected into EDTA‐containing vacuum tubes at the following times: immediately before and 1, 2, 3, 4, 5, 6, 8, 12, and 24 hours after tacrolimus administration to measure its whole blood concentration. On day 5, blood samples were also collected into heparinized vacuum tubes immediately before and 1, 2, 3, 4, 5, 6, 8, 12, and 24 hours after voriconazole administration in the morning to determine its plasma concentrations at steady state. Blood samples for tacrolimus were stored at 5°C. Those for voriconazole were immediately centrifuged, and separated plasma was stored at −20°C until analysis.
Bioanalytical Methods
The whole‐blood concentrations of tacrolimus were measured by ELISA (PRO‐TRAC II, FK506 ELISA KIT; Sceti Medical Lab, Tokyo, Japan). The limit of quantification of tacrolimus was 0.3 ng/mL, the calibration ranged between 0.3 and 30.0 ng/mL, and the coefficients of variation were always less than 15%.
Voriconazole concentrations in plasma were determined by a validated HPLC‐UV method. Voriconazole and an internal standard, UK‐115, were extracted from an alkalinized 0.5‐mL plasma sample with diethyl ether. The ether extract was evaporated to dryness, and the residue was reconstituted in a mobile phase. The chromatographic column was L‐column ODS (Chemicals Evaluation and Research Institute, Tokyo, Japan), and the detector wavelength was set at 254 nm. The concentration range of the standard curve was 0.1–40 µg/mL. The interday and intraday variabilities in precision (expressed as the coefficient of variation) ranged from 0.8% to 4.3% and from 2.4% to 5.7%, respectively.
Pharmacokinetic Data Analysis
Noncompartmental analysis using Phoenix WinNonlin software (version 6.3; Certara, LP, Princeton, New Jersey) was performed to determine the following pharmacokinetic parameters of tacrolimus and voriconazole: Cmax, time to reach Cmax (tmax), and AUC from time 0 to the last measureable concentration, calculated by use of the linear trapezoidal rule.
Statistical Analysis
Differences in the pharmacokinetic parameters of tacrolimus between administration alone and coadministration with voriconazole were assessed using the nonparametric Wilcoxon matched‐pairs signed‐rank test. The nonparametric Wilcoxon rank‐sum test was used to assess differences between CYP2C19 genotypes. P < .05 was considered significant. All analyses were performed using JMP 10.0 (SAS Institute Inc, Cary, North Carolina).
Results
Demographics
The ages of the subjects ranged from 22 to 38 years, and the range of body mass index values among these subjects was 18.6–24.8 kg/m2. No significant differences in age, height, weight, and body mass index were observed among the 3 genotypes (Table 1).
Table 1.
Demographic Characteristics
| CYP2C19 Genotype | |||
|---|---|---|---|
| EM | IM | PM | |
| Number of Subjects | |||
| 6 | 6 | 6 | |
| *1/*1: 6 | *1/*2: 2 | *2/*2: 2 | |
| *1/*3: 4 | *2/*3: 3 | ||
| *3/*3: 1 | |||
| Age (years) | 27.7 (23–38) | 28.7 (22–37) | 27.7 (22–36) |
| Height (cm) | 172.7 (167.6–178.9) | 173.6 (170.0–178.5) | 174.3 (166.7–182.3) |
| Weight (kg) | 63.9 (57.4–68.7) | 65.2 (57.0–74.3) | 61.3 (55.0–78.5) |
| BMI (kg/m2) | 21.5 (18.9–23.9) | 21.7 (18.6–24.8) | 20.1 (18.7–23.6) |
EM, extensive metabolizer; IM, intermediate metabolizer; PM, poor metabolizer. Data are shown as the mean (range) or number.
Whole‐Blood Concentrations of Tacrolimus
Coadministration of tacrolimus with voriconazole increased the whole‐blood concentrations of tacrolimus for all CYP2C19 genotypes (A for EMs, B for IMs, C for PMs in Figure 1). Pharmacokinetic analysis revealed significant increases of Cmax and AUC0–24 for tacrolimus when it was coadministered with voriconazole in EMs (48.3 ± 16.6 ng/mL vs 18.3 ± 7.9 ng/mL and 389.5 ± 111.9 ng · h/mL vs 88.3 ± 53.1 ng · h/mL, respectively, both P < .05), IMs (54.9 ± 12.0 ng/mL vs 20.5 ± 12.5 ng/mL and 540.6 ± 110.1 ng · h/mL vs 108.2 ± 79.7 ng · h/mL, respectively, both P < .05), and PMs (60.5 ± 16.7 ng/mL vs 16.3 ± 5.7 ng/mL and 570.5 ± 134.9 ng · h/mL vs 94.8 ± 29.1 ng · h/mL, respectively, both P < .05). Tmax was significantly prolonged by voriconazole coadministration only in PMs (2.8 ± 0.8 hours vs 1.8 ± 0.4 hours, P < .05). Compared to EMs, the AUC0‐24 of tacrolimus were also significantly higher in IMs and PMs when the drug was coadministered with voriconazole (both P < .05), although there were no significant differences among the genotypes when tacrolimus was administered alone (Table 2). Figure 2 shows the genotype‐dependent effect of voriconazole on the AUC0–24 of tacrolimus. The ratios of the mean AUC0–24 of tacrolimus when coadministered with voriconazole to that of tacrolimus alone were 4.4, 5.0, and 6.0 in EMs, IMs, and PMs, respectively, as shown in Table 2.
Figure 1.
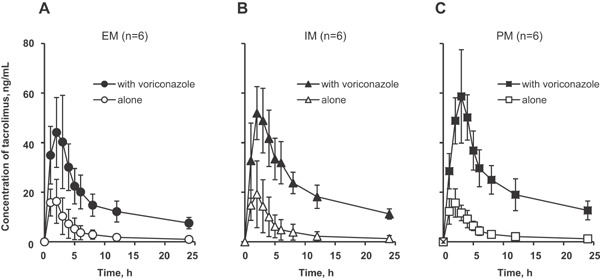
Mean (± SD) tacrolimus whole‐blood concentration‐time profiles after a single oral administration of 3 mg of tacrolimus alone or in combination with 200 mg of voriconazole twice daily at steady state to CYP2C19 EM (A), IM (B), and PM (C) subjects. EM, extensive metabolizer; IM, intermediate metabolizer; PM, poor metabolizer.
Table 2.
Pharmacokinetic Parameters by Noncompartmental Analysis of Tacrolimus Administered Alone or in Combination With Voriconazole According to CYP2C19 Genotype
| CYP2C19 Genotype | ||||||
|---|---|---|---|---|---|---|
| EM (n = 6) | IM (n = 6) | PM (n = 6) | ||||
| Alone | With Voriconazole | Alone | With Voriconazole | Alone | With Voriconazole | |
| Tmax (h) | 1.5 ± 0.5 | 2.3 ± 1.5 | 1.7 ± 0.8 | 2.3 ± 0.5 | 1.8 ± 0.4 | 2.8 ± 0.8 * |
| Cmax (ng/mL) | 18.3 ± 7.9 | 48.3 ± 16.6 * | 20.5 ± 12.5 | 54.9 ± 12.0 * | 16.3 ± 5.7 | 60.5 ± 16.7 * |
| AUC0‐24 (ng · h/mL) | 88.3 ± 53.1 | 389.5 ± 111.9 * | 108.2 ± 79.7 | 540.6 ± 110.1 * , # | 94.8 ± 29.1 | 570.5 ± 134.9 * , # |
| Ratio of AUC0–24 with voriconazole to alone | ─ | 4.4 | ─ | 5.0 | ─ | 6.0 |
EM, extensive metabolizer; IM, intermediate metabolizer; PM, poor metabolizer.
Data are shown as the mean ± SD.
P < .05 compared to tacrolimus alone for each corresponding CYP2C19 genotype as assessed using the Wilcoxon matched‐pairs signed‐rank test.
P < .05 compared to the CYP2C19 EM genotype when coadministered with voriconazole as assessed using the Wilcoxon rank‐sum test.
Figure 2.
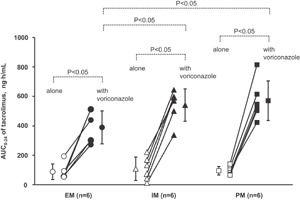
Mean (± SD) and individual area under the concentration‐time curve (AUC0–24) of tacrolimus after a single oral administration of 3 mg of tacrolimus alone or in combination with 200 mg of voriconazole twice daily at steady state to CYP2C19 EM, IM, and PM subjects. P values compared to tacrolimus administration alone for the corresponding CYP2C19 genotype were obtained using the Wilcoxon matched‐pairs signed‐rank test. P values compared to the CYP2C19 EM genotype were calculated using the Wilcoxon rank‐sum test. EM, extensive metabolizer; IM, intermediate metabolizer; PM, poor metabolizer.
Plasma Concentrations of Voriconazole
Figure 3 shows the plasma concentration‐time curves of voriconazole at steady state according to the CYP2C19 genotype. The Cmax and AUC0‐12 of voriconazole in IMs and PMs were significantly higher than those in EMs (P < .05 and P < .01, respectively), as shown in Table 3.
Figure 3.
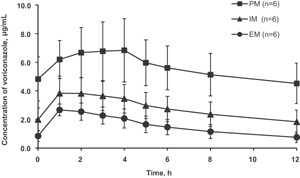
Mean (± SD) voriconazole plasma concentration‐time profiles at steady state to CYP2C19 EM, IM, and PM subjects. EM, extensive metabolizer; IM, intermediate metabolizer; PM, poor metabolizer.
Table 3.
Pharmacokinetic Parameters by Noncompartmental Analysis of Voriconazole at Steady State According to CYP2C19 Genotype
| CYP2C19 Genotype | |||
|---|---|---|---|
| EM (n = 6) | IM (n = 6) | PM (n = 6) | |
| Tmax (hours) | 1.5 ± 0.5 | 1.5 ± 0.8 | 2.8 ± 1.2 |
| Cmax (µg/mL) | 2.8 ± 0.4 | 4.0 ± 1.1 # | 7.0 ± 2.1## |
| AUC0–12 (µg · h/mL) | 18.8 ± 5.7 | 33.6 ± 11.0 # | 67.8 ± 19.2## |
EM, extensive metabolizer; IM, intermediate metabolizer; PM, poor metabolizer.
Data are shown as the mean ± SD.
P < .05, ## P < .01 compared to the CYP2C19 EM genotype as assessed using the Wilcoxon rank‐sum test.
Safety Evaluation
Transient mild visual disturbance, which has been reported as the most common adverse reaction of voriconazole,2 occurred in 12 subjects (4 subjects in each genotype). PMs and IMs, who exhibited significantly higher voriconazole exposure than EMs, did not develop abnormal liver function test results, which reportedly may be associated with higher plasma voriconazole concentrations.2
Discussion
The impact of CYP2C19 polymorphisms on the pharmacokinetics of tacrolimus coadministered with voriconazole at steady state was investigated in Japanese male healthy volunteers. The Japanese prescribing information for Vfend® states that steady‐state plasma concentrations of voriconazole were reached on the second day in EMs and IMs and on the third day in PMs, when the recommended oral loading dose regimen (400 mg twice daily on the first day followed by a maintenance dose of 200 mg twice daily) was administered to healthy Japanese male subjects.3 In this study, it was confirmed that steady state was reached at day 5 for all CYP2C19 genotypes for voriconazole at 0 and 12 hours on day 5 (EM 0.9 ± 0.4 and 0.8 ± 0.4 µg/mL, respectively; IM 2.0 ± 0.8 and 1.8 ± 0.8 µg/mL, respectively; PM 4.8 ± 1.6 and 4.5 ± 1.4 µg/mL, respectively), as shown in Figure 3.
Concentrations of tacrolimus in whole blood, but not in plasma, were measured and assessed in this study along with the TDM for tacrolimus in clinical practice, as the ratio of its whole‐blood concentration to its plasma concentration is 35 (range 12–67)13 due to its high affinity for erythrocytes. The dosing interval from the first phase of tacrolimus alone to the second phase of voriconazole coadministration was planned as 96 hours according to the previously reported elimination half‐life of tacrolimus.6 On day 5, the complete elimination of tacrolimus administered on day 1 was also confirmed in all subjects based on the concentrations at 0 hours, as shown in Figure 1.
The metabolism of tacrolimus is mainly mediated by CYP3A. It is well known that coadministering tacrolimus and voriconazole, which is a strong inhibitor of CYP3A, significantly increases tacrolimus concentrations,2, 3, 7, 8, 9, 13 Concerning this drug‐drug interaction (DDI), Trifilio et al reported a preemptive dose modification strategy for tacrolimus use in allogeneic stem cell transplant recipients receiving voriconazole.14 Peksa et al also suggested a dosing algorithm for the concomitant administration of tacrolimus and voriconazole after allogeneic HSCT.15 As noted in these studies, developing effective dose modification strategies for tacrolimus in consideration of this DDI for the prevention of graft‐vs‐host disease is a critical issue.
In our study, coadministration with voriconazole increased the AUC0–24 of tacrolimus significantly for all genotypes (P < .05) (Figures 1–2, Table 2). In addition, the AUC0–24 of tacrolimus when coadministered with voriconazole were significantly higher in IMs and PMs than in EMs (P < .05), whereas no significant difference was observed among the genotypes for tacrolimus administration alone (Figure 2, Table 2). It was confirmed that the AUC0–12 of voriconazole is related to the CYP2C19 (Figure 3) genotype, as reported previously.2, 3, 16, 17 The AUC0–12 of voriconazole was also significantly higher in IMs and PMs than in EMs (1.8‐ and 3.6‐fold, respectively, P < .05 and P < .01, respectively) (Table 3). Consequently, this finding demonstrates that CYP2C19 genotype‐dependent tacrolimus exposure when coadministered with voriconazole was a result of CYP2C19 genotype‐dependent voriconazole exposure, which was increased by 4.4‐, 5.0‐, and 6.0‐fold in EMs, IMs, and PMs, respectively, when the drugs were coadministered (Figure 2, Table 2). The results are explainable in terms of the in vitro human liver microsome experiments demonstrating that the magnitude of the inhibition of tacrolimus metabolism by voriconazole was related to the concentration of voriconazole.7, 11 Zhang et al reported the voriconazole concentration‐dependent inhibition of tacrolimus metabolism at various concentrations of voriconazole (0–285 µM; 0–100 µg/mL) and tacrolimus (62.2 nM; 50 ng/mL) in vitro.11 The concentrations of both voriconazole and tacrolimus of each subject in our study were similar to the range of the in vitro investigation. There are no data suggesting voriconazole influences erythrocyte binding of tacrolimus. If the extent of the binding is decreased by coadministration with voriconazole, tacrolimus metabolic clearance is increased due to an increment in its liver extraction. However, the actual data show a decrease in the metabolic clearance of tacrolimus (Figures 1, 2, Table 2). Therefore, metabolic inhibition is a major mechanism of this DDI. There is wide interindividual variability in whole‐blood tacrolimus concentrations among subjects (Figures 1, 2, Table 2). However, the effect of the CYP2C19 genotype on pharmacokinetics of tacrolimus can be purely evaluated using a crossover method to eliminate the effects of other factors for intraindividual variability such as genetic polymorphisms of CYP3A4, CYP3A5, and ABCB1,18, 19, 20 although their contribution for tacrolimus pharmacokinetics remains unclear.
Our report is the first to reveal that the CYP2C19 genotype affects the exposure of a CYP3A substrate when coadministered with voriconazole, which is an inhibitor of CYP3A and substrate of CYP2C19. It appears likely that voriconazole will similarly affect the pharmacokinetics of cyclosporine. Tacrolimus and cyclosporine exhibit a great degree of interindividual and intraindividual pharmacokinetic variability.6, 21 Owing to a narrow therapeutic index, TDM is required to avoid the risk of organ rejection at low blood concentrations and serious adverse reactions such as nephrotoxicity, hypertension, and hyperglycemia at high blood concentrations. In the US prescribing information of Prograf,13 the Drug Interactions section reads as follows: “Repeat oral dose administration of voriconazole increased tacrolimus (0.1 mg/kg single dose) AUCτ in healthy subjects by an average of 3‐fold.” The section also reads as follows: “When initiating therapy with voriconazole in patients already receiving tacrolimus, it is recommended that the tacrolimus dose be reduced to one‐third of the original dose and followed with frequent monitoring of the tacrolimus blood levels.” However, the average increase in the AUCτ (3‐fold) and reduction in the dose (one‐third) were not applicable to all patients in our findings because they are dependent on the CYP2C19 genotypes of the patients. Indeed, despite the description, there are reports that the rule‐of‐thumb reduction of the tacrolimus dose by one‐third may not be satisfactory.9, 15 In addition, when voriconazole is discontinued, tacrolimus levels should be carefully monitored, and the dose should be increased as necessary. Therefore, the dose of tacrolimus should be modified according to the CYP2C19 genotype when both initiating and discontinuing voriconazole cotreatment. Concerning the application of our findings to HSCT recipients, blood sampling to analyze CYP2C19 genotypes to determine voriconazole metabolism in their liver should be performed before transplantation.
In conclusion, the extent to which tacrolimus exposure is increased by voriconazole coadministration is dependent on CYP2C19 genotypes even though tacrolimus is mainly metabolized by CYP3A. The CYP2C19 genotype is one of the key factors that affect pharmacokinetics of tacrolimus when coadministered with voriconazole. It is particularly important to uncover the clinical impact of CYP2C19 genotypes for Asians because the frequencies of nonfunctional CYP2C19 alleles are higher in Asians than in white subjects.10
Conflict of Interest
The authors declare no conflict of interest.
The results of this study were presented at the 2014 Annual Meeting of the American Society for Clinical Pharmacology and Therapeutics (ASCPT); March, 2014; Atlanta, GA.
References
- 1. Roffey SJ, Cole S, Comby P, et al. The disposition of voriconazole in mouse, rat, rabbit, guinea pig, dog, and human. Drug Metab Dispos. 2003; 31:731–741. [DOI] [PubMed] [Google Scholar]
- 2.Pfizer Inc. Vfend Prescribing Information in the U.S.: voriconazole tablets, injection suspension: LAB‐0311‐11.0; February 2014.
- 3.Pfizer Inc. Vfend Prescribing Information in Japan: voriconazole tablets: Ver. 14; October 2014.
- 4. Kronbach T, Fischer V, Meyer UA. Cyclosporine metabolism in human liver: identification of a cytochrome P‐450III gene family as the major cyclosporine‐metabolizing enzyme explains interactions of cyclosporine with other drugs. Clin Pharmacol Ther. 1988; 43:630–635. [DOI] [PubMed] [Google Scholar]
- 5. Sattler M, Guengerich FP, Yun CH, Christians U, Sewing KF. Cytochrome P‐450 3A enzymes are responsible for biotransformation of FK506 and rapamycin in man and rat. Drug Metab Dispos. 1992; 20:735–761. [PubMed] [Google Scholar]
- 6. Venkataramanan R, Swaminathan A, Prasad T, et al. Clinical pharmacokinetics of tacrolimus. J Pharmacokinet. 1995; 29:404–430. [DOI] [PubMed] [Google Scholar]
- 7. Venkataramanan R, Zang S, Gayowski T, Singh N. Voriconazole inhibition of the metabolism of tacrolimus in a liver transplamt recipient and in human liver microsomes. Antimicrob Agents Chemother. 2002; 46:3091–3093. [DOI] [PMC free article] [PubMed] [Google Scholar]
- 8. Mori T, Aisa Y, Kato J, Nakamura Y, Ikeda Y, Okamoto S. Drug interaction between voriconazole and calcineurin inhibitors in allogeneic hematopoietic stem cell transplant recipients. Bone Marrow Transplant. 2009; 44:371–374. [DOI] [PubMed] [Google Scholar]
- 9. Capone D, Tarantino G, Gentile A, et al. Effects of voriconazole on tacrolimus metabolism in a kidney transplant recipient. J Clin Pharmacol Ther. 2010; 35:121–124. [DOI] [PubMed] [Google Scholar]
- 10. Shimada T, Yamazaki H, Mimura M, Inui Y, Guengerich FP. Interindividual variations in human liver cytochrome P‐450 enzymes involved in the oxidation of drugs, carcinogens and toxic chemicals: studies with liver microsomes of 30 Japanese and 30 Caucasians. J Pharmacol Exp Ther. 1994; 270:414–423. [PubMed] [Google Scholar]
- 11. Zhang S, Pillai VC, Mada SR, Strom S, Venkataramanan R. Effect of voriconazole and other azole antifungal agents on CYP3A activity and metabolism of tacrolimus in human liver microsomes. Xenobiotica. 2012; 42:409–416. [DOI] [PubMed] [Google Scholar]
- 12. Hamajima N. PCR‐CTPP: a new genotyping technique in the era of genetic epidemiology. Expert Rev Mol Diagn. 2001; 1:119–123. [DOI] [PubMed] [Google Scholar]
- 13.Astellas Pharma US, Inc. Prograf Prescribing Information in the U.S.: tacrolimus capsules, injection: 13H057‐PRG‐PI‐WPI; September 2013.
- 14. Trifilio SM, Scheetz MH, Pi J, Mehta J. Tacrolimus use in adult allogeneic stem cell transplant recipients receiving voriconazole: preemptive dose modification and therapeutic drug monitoring. Bone Marrow Transplant. 2010; 45:1352–1356. [DOI] [PubMed] [Google Scholar]
- 15. Peksa GD, Schultz K, Fung HC. Dosing algorithm for concomitant administration of sirolimus, tacrolimus, and an azole after allogeneic hematopoietic stem cell transplantation. J Oncol Pharm Pract. 2014:1–7. [DOI] [PMC free article] [PubMed] [Google Scholar]
- 16. Scholz I, Oberwittler H, Riedel KD, et al. Pharmacokinetics, metabolism and bioavailability of the triazole antifungal agent voriconazole in relation to CYP2C19 genotype. Br J Clin Pharmacol. 2009; 68:906–915. [DOI] [PMC free article] [PubMed] [Google Scholar]
- 17. Lee S, Kim BH, Nam WS, et al. Effect of CYP2C19 polymorphism on the pharmacokinetics of voriconazole after single dose and multiple doses in healthy volunteers. J Clin Pharmacol. 2012; 52:195–203. [DOI] [PubMed] [Google Scholar]
- 18. Cheung CY, Op den Buijsch RA, Wong KM, et al. Influence of different allelic variants of the CYP3A and ABCB1 genes on the tacrolimus pharmacokinetic profile of Chinese renal transplant recipients. Pharmacogenomics. 2006; 7:563–574. [DOI] [PubMed] [Google Scholar]
- 19. Cusinato DA, Lacchini R, Romea EA, Moyses‐Neto M, Coelho EB. Relationship of CYP3A5 genotype and ABCB1 diplotype to tacrolimus disposition in Brazilian kidney transplant patients. Br J Clin Pharmacol. 2014; 78:364–372. [DOI] [PMC free article] [PubMed] [Google Scholar]
- 20. Hesselink DA, Bouamar R, Elens L, van Schaik RH, van Gelder T. The role of pharmacogenetics in the disposition of and response to tacrolimus in solid organ transplantation. Clin Pharmacokinet. 2014; 53:123–139. [DOI] [PubMed] [Google Scholar]
- 21. Ptachcinski RJ, Venkataramanan R, Burckart GJ. Clinical pharmacokinetics of cyclosporine. Clin Pharmacokinet. 1986; 11:107–132. [DOI] [PubMed] [Google Scholar]