

Abstract
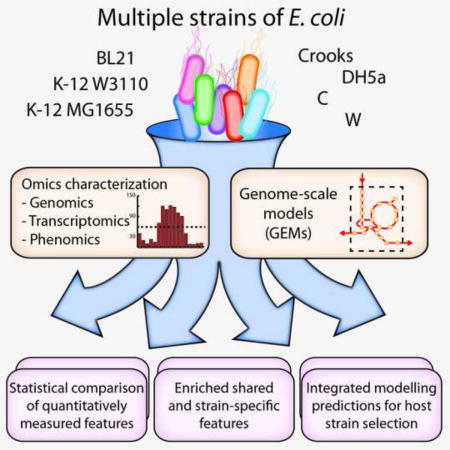
Escherichia coli strains are widely used in academic research and biotechnology. New technologies for quantifying strain-specific differences and their underlying contributing factors promise greater understanding of how these differences significantly impact physiology, synthetic biology, metabolic engineering, and process design. Here, we quantified strain-specific differences in seven widely used strains of E. coli (BL21, C, Crooks, DH5a, K-12 MG1655, K-12 W3110, and W) using genomics, phenomics, transcriptomics, and genome-scale modelling. Metabolic physiology and gene expression varied widely with downstream implications for productivity, product yield, and titre. These differences could be linked to differential regulatory structure. Analysing high-flux reactions and expression of encoding genes resulted in a correlated and quantitative link between these sets, with strain-specific caveats. Integrated modelling revealed that certain strains are better suited to produce given compounds or express desired constructs considering native expression states of pathways that enable high-production phenotypes. This study yields a framework for quantitatively comparing strains in a species with implications for strain selection.
Graphical abstract
Introduction
Escherichia coli are widely used as a model prokaryote for physiology studies. Some strains are important pathogens and others are key host strains for metabolic engineering and synthetic biology. This diversity in lifestyle and application reflects the high level of genetic diversity within the species. Thanks to the genomics revolution in microbiology that has enabled sequencing of diverse strains for any species, it is now known that the genomes of different strains of E. coli range in size from 4.5 to over 5.5 Mbp, and the species has a pan-genome composed of more than 15,000 unique proteins (Lukjancenko et al., 2010, Gordienko et al., 2013). Part of this large pan-genome consists of unique metabolic capabilities that have been shown to have important implications for infectious disease studies and pathogenic niches (Monk et al., 2013, Baumler et al., 2011, Vieira et al., 2011). This metabolic diversity is likely to be equally impactful on synthetic biology applications (Lee and Kim, 2015). The massive genomic diversity of the E. coli species provides a deep pool of strains to use for basic research and for metabolic engineering and synthetic biology applications. It also raises an important question: what range of phenotypic behaviours exist and how can these be leveraged to further exploit E. coli as a model organism and host strain?
A review of industrial biotechnology publications and patents that use E. coli as a host strain yielded seven representative E. coli strains that are used often and are good candidates for detailed study: the K-12 strains MG1655, W3110, and DH5a, as well as strains BL21, C, Crooks, and W (Figure 1A). These strains all have genetic tools available – a required factor when choosing a strain for metabolic engineering. The selection of both closely related strains (K-12 strains) and more distantly related strains also allowed an examination of whether close genetic relatedness is a useful predictor of physiological relatedness and production potential. The existing body of work evaluating different E. coli strains in metabolic engineering and synthetic biology (Archer et al., 2011, Arifin et al., 2014, Yoon et al., 2012, Vijayendran et al., 2007, Marisch et al., 2013, Chae et al., 2010) demonstrated a need for the comprehensive analysis of strain-specific differences. Despite significant success in engineering E. coli for industrial production of chemicals and proteins (Lee et al., 2012b, Kim et al., 2015), there is no unified fundamental basis for selection of one strain over another for a given metabolic engineering project or expression of a given construct. Previous studies have shown that the choice of host strain for production of a given compound has a significant impact on results (Na et al., 2013, Kim et al., 2014) and up until now represented a major brute force screening effort. Thus, an important question remains to be addressed: what strain of E. coli is best suited for production of a desired product?
Figure 1. Genetic and physiological differences between seven strains of E. coli.
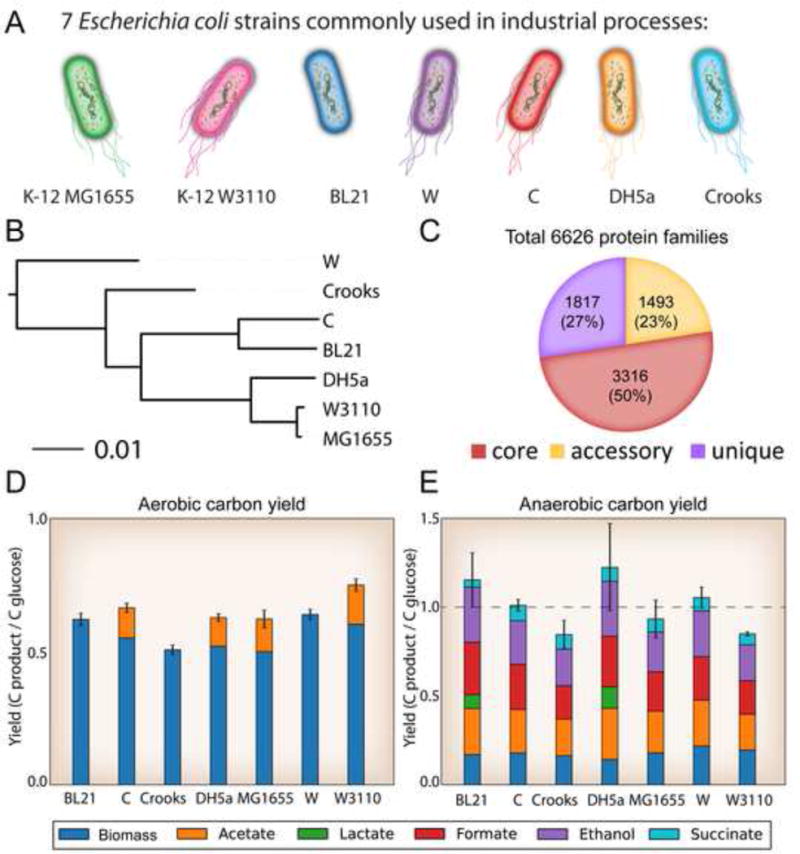
A) The seven industrial relevant E. coli strains selected for this study. This panel establishes the colour scheme that will be used to represent strain-specific data on these strains throughout the rest of the manuscript, as well as the motility characteristics of each strain. B) A phylogenetic tree based on full-genome DNA alignment of the seven strains. C) Total protein families in the strains examined. Core genes (red) are those that were present in all 7 strains, genes present in 2–6 strains are labelled accessory (yellow), and unique genes are only present in a single strain (purple). D & E) Physiological behaviour and comparison of the different strain’s carbon yield in aerobic and anaerobic growth conditions. Yields are calculated in terms of glucose uptake rates. Carbon dioxide was not measured. Overall, the by-product profiles differed across the strains and some anaerobic yields are not fully captured in the by-products measured. This is likely due to CO2 evolution from formate dehydrogenase.
Here, a comprehensive comparison incorporating transcriptomics, genomics, and phenomics with genome-scale modelling of seven common E. coli production strains is presented and a mechanistic basis for the selection of a given E. coli strain for production of particular compound is established. The data and models are further used to develop a general strategy for synthetic biology host strain selection that can be applied to any production organism with sufficient genetic diversity. The work presented here establishes a workflow (Figure S1) and represents a resource for similar efforts with other organisms and/or additional omics data types.
Results
Whole-genome sequencing and comparative analysis
Seven strains of E. coli were sequenced to comprehensively compare and examine their strain-specific genetic differences (Accession numbers and identified differences are available in Table S1, Data S1). Accurate genome sequences were determined to be essential due to recent studies that demonstrate several differences between the reference sequence of E. coli K-12 MG1655 and the stock strains of laboratory E. coli available from culture collections (Freddolino et al., 2012). These differences were shown to have substantial physiological effects that could confound experimental results and have downstream impacts on bioprocess design (Nahku et al., 2011). One of the widely used E. coli strains, C, had no public genome sequence available, thus whole genome sequencing was performed to establish the genetic parts list for this strain (STAR Methods). The E. coli C draft genome was predicted to be 4.54 Mbp in size and has 4,424 open reading frames.
The whole genome sequences of the seven strains were then used to classify the strains based on their genetic content. First, a classical MLST scheme (Jaureguy et al., 2008) was used to assign the E. coli strains to phylogroups (Figure S2). All strains were assigned to group A except for E. coli W that was assigned to group B1. All seven strains are generally regarded as safe and non-pathogenic. A full genome alignment and comparison of conserved proteins was also performed (STAR Methods). A total of 6,626 unique protein-coding sequences were discovered across all seven genomes. Of these, 3,316 genes were shared between all seven strains, forming a “core” genome. Of the non-core genes, 1,493 were present in 2 to 6 of the strains and 1,817 of the genes were unique to a single strain alone (Figure 1C, Data S1). A full-genome DNA alignment showed that the E. coli K-12 strains, MG1655, W3110, and DH5a were all part of the same clade. E. coli BL21 and C were also part of a similar clade, and E. coli Crooks and W strains were separate from the others with E. coli W being the most distantly related strain (Figure 1B). A full analysis of amino acid differences in shared coding sequences between E. coli K-12 MG1655 and each of the other strains was performed (Data S1). Such differences may have effects on protein activities including catalytic activity, protein folding, and translation efficiency.
Phenotypic characterization of host strains highlights physiological differences
To assess growth dynamics and by-product secretion rates, phenotypic characterizations were performed in aerobic and anaerobic M9 minimal media (STAR Methods). Major differences were observed between the strains during exponential growth phase. Aerobically, the growth rates ranged from 0.61 h−1 (W3110) to 0.97 h−1 (W), with a mean growth rate of 0.80 ± 0.12 h−1, see Table 1. Anaerobically, DH5a grew slowest (0.18 h−1) and W grew fastest (0.90 h−1), with a mean growth rate of 0.53 ± 0.25 h−1. These differences are stark given that the strains share more than 95% of genes in central metabolism at greater than 95% amino acid identity (STAR Methods) indicating vastly different utilization of similar central metabolic genetic content. It is also worth highlighting that some strains, such as W, could grow nearly as fast anaerobically as they did aerobically through a major increase (2.7×) in glucose uptake rate.
Table 1.
Growth, uptake, and production rates of seven E. coli strains in aerobic and anaerobic batch culture.
| Specific rate (mmol gDW−1 h−1)
|
Strain | |||||||
|---|---|---|---|---|---|---|---|---|
| Condition | BL21 | C | Crooks | DH5α | MG1655 | W | W3110 | |
| μmax (h−1) | Aerobic | 0.76 ± 0.02 | 0.83 ± 0.02 | 0.96 ± 0.02 | 0.77 ± 0.01 | 0.73 ± 0.01 | 0.97 ± 0.02 | 0.61 ± 0.01 |
| Anaerobic | 0.29 ± 0.05 | 0.61 ± 0.02 | 0.77 ± 0.04 | 0.18 ± 0.02 | 0.46 ± 0.02 | 0.90 ± 0.06 | 0.52 ± 0.00 | |
| Glucose | Aerobic | −8.01 ± 0.27 | −9.86 ± 0.09 | −12.47 ± 0.53 | −9.67 ± 0.35 | −9.53 ± 0.27 | −9.90 ± 0.1 | −6.65 ± 0.08 |
| Anaerobic | −11.32 ± 0.51 | −22.20 ± 0.75 | −30.88 ± 2.19 | −8.48 ± 1.72 | −16.69 ± 0.24 | −27.21 ± 1.39 | −17.49 ± 0.45 | |
| Acetate | Aerobic | 0.00 ± 0.00 | 3.35 ± 0.06 | 0.00 ± 0.00 | 3.12 ± 0.13 | 3.49 ± 0.50 | 0.00 ± 0.00 | 2.95 ± 0.12 |
| Anaerobic | 8.83 ± 0.91 | 16.33 ± 0.38 | 19.09 ± 1.27 | 7.34 ± 0.37 | 11.71 ± 1.14 | 21.06 ± 0.75 | 10.59 ± 0.12 | |
| Formate | Aerobic | 0.00 ± 0.00 | 0.00 ± 0.00 | 0.00 ± 0.00 | 0.00 ± 0.21 | 0.00 ± 0.00 | 0.00 ± 0.00 | 0.00 ± 0.00 |
| Anaerobic | 20.06 ± 0.89 | 33.85 ± 0.71 | 34.82 ± 2.45 | 14.51 ± 2.59 | 22.17 ± 1.69 | 40.03 ± 1.05 | 19.86 ± 0.18 | |
| Ethanol | Aerobic | 0.00 ± 0.00 | 0.00 ± 0.00 | 0.00 ± 0.00 | 0.00 ± 0.00 | 0.00 ± 0.00 | 0.00 ± 0.00 | 0.00 ± 0.00 |
| Anaerobic | 10.51 ± 1.27 | 16.33 ± 0.38 | 19.09 ± 1.27 | 7.85 ± 0.87 | 11.22 ± 0.60 | 16.32 ± 2.98 | 7.85 ± 0.87 | |
| Lactate | Aerobic | 0.00 ± 0.00 | 0.00 ± 0.00 | 0.00 ± 0.00 | 0.19 ± 0.06 | 0.00 ± 0.00 | 0.00 ± 0.00 | 0.00 ± 0.00 |
| Anaerobic | 1.75 ± 0.53 | 0.00 ± 0.00 | 0.00 ± 0.00 | 2.05 ± 0.14 | 0.00 ± 0.00 | 21.06 ± 0.75 | 0.00 ± 0.00 | |
| Succinate | Aerobic | 0.00 ± 0.00 | 0.00 ± 0.00 | 0.00 ± 0.00 | 0.00 ± 0.00 | 0.00 ± 0.00 | 0.00 ± 0.00 | 0.00 ± 0.00 |
| Anaerobic | 0.71 ± 0.2 | 2.90 ± 0.05 | 3.82 ± 0.27 | 1.00 ± 0.30 | 1.86 ± 0.40 | 3.08 ± 0.03 | 1.61 ± 0.07 | |
Means ± STDEV are shown (n=3). Means were compared by Tukey-Kramer HSD (α0.05).
While the overall biomass and by-product yields between strains were similar, the strains exhibited different organic acid secretion profiles. In aerobic conditions, four of the strains, C, DH5a, MG1655, and W3110 exhibited acetate overflow metabolism in this well-aerated experiment (Figure 1D), in agreement with past studies (Archer et al., 2011, Marisch et al., 2013). Anaerobically, all strains exhibited common mixed acid fermentation with production of acetate, formate, ethanol, and succinate. Only two strains, the slowest growers, BL21(DE3) and DH5a, produced lactate anaerobically (Figure 1E). This physiological characterization clearly shows that strains differ in their propensity to make certain molecules, e.g., lactate, an industrially relevant, biologically produced chemical, when growing in their wild-type state (Jang et al., 2012). The rate of substrate consumption in the different strains (Table 1, Figure S3) also exhibited significant variation (a 1.9 and 3.6 fold difference aerobically and anaerobically, respectively), a fact that has important implications for productivity and bioprocessing costs.
Strain-specific genome-scale models (GEMs) of metabolism reveal differences in metabolic capabilities
The large physiological differences across the selected E. coli strains motivated the construction of seven strain-specific GEMs (Data S1 and S2) that were used to integrate, model, and contextualize the measured physiological data. The models were first validated by demonstrating that they could recapitulate a functional flux state by setting the measured physiological data (i.e., inputs and outputs – glucose uptake rate, growth rate and by-product production rates – See Figure S9). All models passed this test, indicating consistency between the models and physiological data. Next, each model’s metabolic content was compared to classify reactions as part of “core” or “pan” metabolic capabilities. The core content (reactions present in all seven strains) consisted of 1,265 genes, catalysing 2,315 reactions that utilize 1,776 different metabolites. The total content, present in at least one strain, but not shared among all, consisted of 2,526 reactions – indicating that 211 reactions were variably present in different strains. The average model had 2,425 +/− 17 reactions. In a recent study of 55 strains of E. coli (Monk et al., 2013) including pathogens and environmental isolates, the average model had 2,337 +/− 52 reactions, indicating that there was more diverse metabolic content among the 55 strains than exists between the seven industrially useful strains examined here. However, several of the differences between the seven strains are present in subsystems important for metabolic engineering, including the pentose phosphate pathway and amino acid biosynthesis. For this reason, strain-specific GEMs of metabolism were used to examine maximum theoretical yield of growth precursors and industrial chemicals to explore the functional differences and metabolic capabilities of each strain.
Strain-specific metabolic models highlight differences in theoretical yields of industrially relevant compounds
The theoretical yields of industrially relevant native and non-native compounds were examined by utilizing strain-specific models. A total of 245 heterologous pathways for the production of non-native compounds (Campodonico et al., 2014) were integrated with each strain-specific model to compare theoretical yields. The yields were calculated using glucose as the sole carbon source in both aerobic and anaerobic conditions (Data S4). Overall, the majority of the maximum theoretical yields were similar across strains. However, several differences were identified between the seven strains. For example, the model of E. coli BL21 is unable to produce acrylic acid from heterologous pathways 23 and 24 (Data S4, Heterologous aerobic and anaerobic tabs) because it lacks N-acetylglucosamine kinase. Likewise, DH5a cannot make 3-hydroxypentanoic acid via a predicted heterologous route (pathway 223) due to the lack of homocysteine S-methyltransferase encoded for by mmuM (Song et al., 2015). A histogram of differential yield by pathway in each strain is given in Figure S4.
All seven strains have theoretical yields greater than 95% of the highest yield predicted for any of the strains in most of the 245 pathways. However, 582 (~17%) of the 3,340 combinations of 7 strains, 245 pathways, and 2 conditions have theoretical yields less than 95% of the highest yield predicted for any strain in a pathway. Strain W was alone or tied for the highest predicted yield in the most aerobic (218) and anaerobic (194) pathways; BL21 (76 and 41) and C (92 and 40) equalled the highest yield in the fewest pathways. A histogram of the 341 combinations of strain and condition that have predicted yields of 45–95% of the highest yield in the 245 pathways are given in Figure S4 and Data S4; another 240 combinations are predicted to yield no product. Strain BL21 had minor reductions in production yields of all compounds in aerobic conditions due to the lack of 6-phosphogluconolactonase (PGL) reaction activity (Meier et al., 2012) in the oxidative pentose phosphate pathway (PPP), encoded by the gene pgl. This requires an alternate pathway for production of ribulose-5-phosphate that does not generate NADPH, one of the primary purposes of the oxidative PPP (Fan et al., 2014) (Figure S5).
Analysis using strain-specific models revealed several increased maximum theoretical yield advantages. E. coli Crooks and W had a 4–12% greater yield of 2-oxobutanoate on five of the different heterologous pathways in anaerobic conditions because of an alternate isoleucine biosynthesis pathway (STAR Methods). Furthermore, models of BL21 and Crooks had 21% higher yield of 1,4-butanediol in anaerobic conditions for two of the heterologous pathways (i.e., pathways 176 and 177) due to the ornithine aminotransferase reaction (STAR Methods). These differences in maximum theoretical yields demonstrate that major differences in strain behavior exist based solely on internal reaction content and the unique metabolic network structure of each strain. Next, to gain a deeper understanding of strain specific behavior, the measured physiological data was integrated with each strain-specific model.
Integration of phenomics with strain specific models classifies shared and strain-specific high flux pathways
The analysis of theoretical yields presented above represents the maximum (i.e., ideal) capabilities of each strain. In vivo wild-type strain-specific behaviour can be analysed by integrating the measured strain-specific physiological data with its corresponding model. The constraint-based modelling techniques of flux variability analysis (FVA) (Mahadevan and Schilling, 2003) and Monte Carlo Markov Chain (MCMC) sampling (Schellenberger and Palsson, 2009) were performed to determine minimum, maximum, and likely flux through each reaction in each strain based on the imposed physiological constraints (for example E. coli C, Figure 2A, Figure S9). The resulting probable flux distributions were used to classify reactions that must carry high flux (STAR Methods) to achieve the measured physiological secretion and growth rates, and were compared in both aerobic (Figure 2B) and anaerobic (Figure 2C) conditions.
Figure 2. Computationally determined high flux reactions from physiological data.
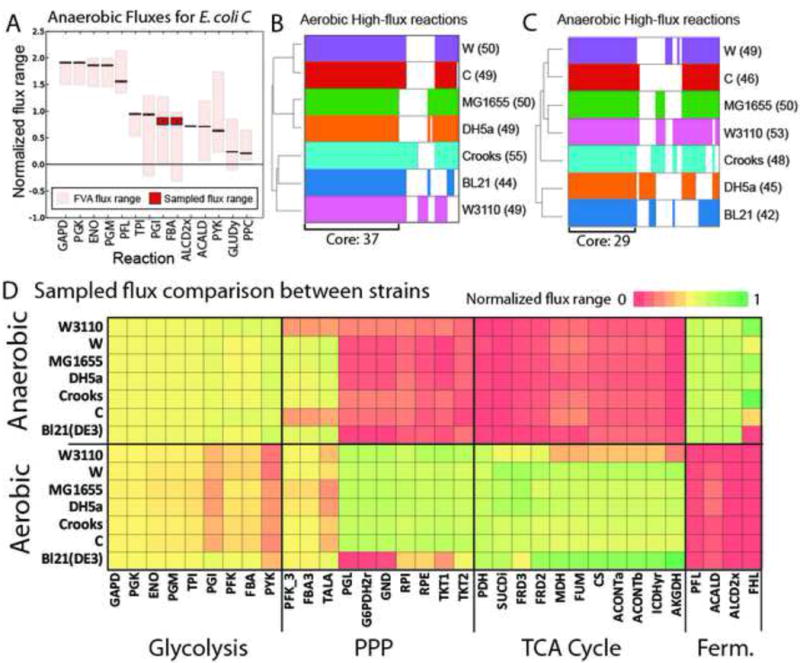
A) Each strain-specific model was constrained using measured physiological data. Flux variability analysis and sampling were performed on each constrained model. All fluxes were normalized to glucose uptake rate and sorted by mean sampled flux value. All graphs for each strain and each growth condition are available in Figure S7. The absolute values of normalized flux values were log transformed. High flux reactions were determined to be those reactions with sampled-flux values greater than 1.5 standard deviations above the mean of all sampled flux values. B and C) High flux reactions for each strain were clustered and plotted. The counts of high flux reactions for each strain are indicated next to the strain name in parentheses. Shared (core) and unique high flux reactions for each strain are shown for aerobic and anaerobic conditions. D) Sampled flux values were compared between the strains in aerobic and anaerobic conditions to highlight condition- and strain-specific behaviour. Reaction abbreviations are given in Data S3.
High flux reactions were compared across the different strains (Figure 2D). Aerobically, there were 62 reactions classified as high flux in at least one strain. Of these, 37 were shared among all seven strains. Most of the shared reactions were involved in glycolysis, the TCA cycle, and the PPP (Data S5). In addition, reactions involved in glutamate metabolism were classified as high flux across all seven strains. The remaining 25 reactions were classified as high flux in at least one strain, but not shared by all. Some of these differences were obvious on a genetic level – for instance, five reactions in the oxidative PPP were classified as high flux in all strains except BL21, because, as discussed above, BL21 lacks the pgl gene, disabling flux through the oxidative PPP in this strain. Other differences in high flux reactions were related to differences in physiological behaviour. For example, acetaldehyde dehydrogenase was only a high flux reaction in two strains (DH5a and MG1655 – two of the strains that exhibited acetate overflow metabolism). Acetate secretion negatively correlated with flux through TCA cycle reactions, including citrate synthase (CS), aconitase (ACONTa/b), and isocitrate dehydrogenase (ICDHyr) (Data S5). Under anaerobic conditions, there were a total of 64 high flux reactions classified in at least one strain. Of these, 29 reactions shared high flux across all seven strains. These included predominantly glycolysis reactions and pentose phosphate pathway reactions as well as pyruvate formate lyase (PFL).
Transcriptome analysis classifies shared and strain-specific gene expression profiles
To delve deeper into strain-specific behaviour and the observed genetic and physiological differences, RNA-seq was used to collect genome-wide transcriptomic profiles of each strain at exponential phase in aerobic and anaerobic conditions (Data S6). Pairwise differential expression was compared between each of the seven strains and correlation coefficients were calculated to quantify the level of similarity between full expression profiles of shared genes for the different strains (Figure 3A and B). A Principal Component Analysis (PCA) was also performed that focused on metabolic genes (Figure 3C and D). The analysis highlights major differences in expression states. For example, BL21 displayed significantly different expression profiles in anaerobic conditions due to high expression of TCA cycle genes. This difference is most likely due to a nonsense mutation in the gene encoding the global oxygen-responsive transcriptional regulator FNR (Pinske et al., 2011) making this strain’s gene expression behave more similarly to an aerobic state. Further differences are discussed in the STAR Methods Section: Transcriptome analysis classifies shared and strain-specific gene expression profiles.
Figure 3. Gene expression analysis.
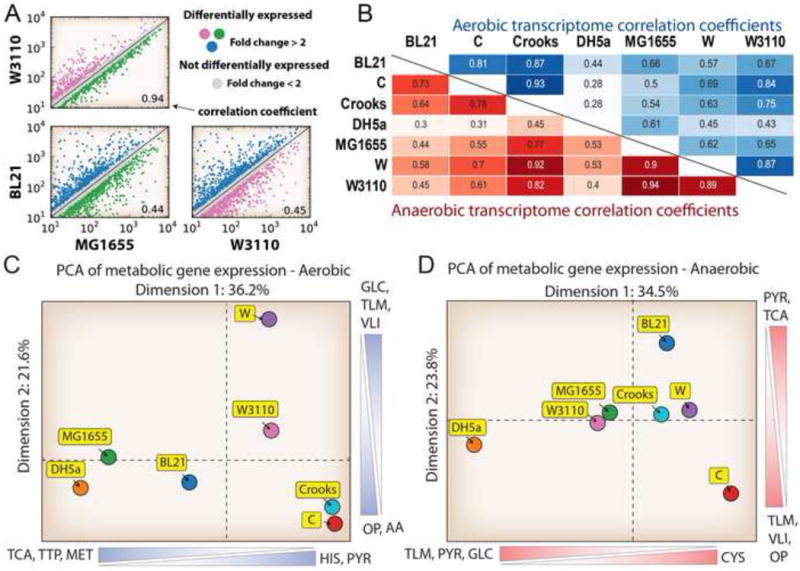
A) Example of a comparison of the transcript levels between strains W3110, MG1655, and BL21, as well as their correlation coefficient. Strains MG1655 and W3110 have a 0.94 correlation coefficient for expression of shared genes. In contrast, strain BL21 shows divergent gene expression compared to strains MG1655 and W3110 with a much lower correlation coefficient of 0.44 and 0.45, respectively. B) The pairwise correlation coefficients for each strain in both aerobic (top, green) and anaerobic (bottom, red) conditions. C) PCA plot of expression values for shared metabolic gene expression between strains aerobically and D) anaerobically. Scale bars represent metabolic subsystems that majorly contribute to the given dimension. Abbreviations: TCA: Citric Acid Cycle, APM: Arginine and Proline Metabolism, GLC: Glycolysis/Gluconeogenesis, MET: Methionine Metabolism, HIS: Histidine Metabolism, OP: Oxidative Phosphorylation, TLM: Threonine and Lysine Metabolism, VLI: Valine, Leucine and Isoleucine Metabolism, PYR: Pyruvate Metabolism, TTP: Tryptophan, Tyrosine and Phenylalanine Metabolism, AA: Aspartate and Alanine Metabolism.
As with reaction flux, gene expression values were analysed for each growth condition and classified into highly expressed gene sets (STAR Methods). This analysis identified a group of genes that were highly expressed species-wide. In aerobic conditions, 199 metabolic genes were classified as highly expressed in at least one of the seven strains (Figure S6, Data S5), but only 16 of these genes were significantly highly expressed across all strains. Three of these were involved in glycolysis: enolase (eno), fructose-bisphosphate aldolase (fbaA), and glyceraldehyde-3-phosphate dehydrogenase (gapA). In anaerobic conditions, 174 metabolic genes were classified as highly expressed in at least one of the strains, and 23 of the genes were highly expressed in all seven strains including eno and fbaA as well as acetaldehyde dehydrogenase (adhE) and methionine adenosyltransferase (metK).
Transcription factors involved in differential regulation illuminate distinct regulatory strategies
The major differences observed in transcription profiles demonstrate unique regulatory mechanisms between strains. Knowledge of transcriptional control is directly applicable to bioprocessing and synthetic biology applications for tuning gene expression levels. Most transcription factors (TFs) have been characterized in E. coli K-12 MG1655, thus gene expression profiles between this strain and the other six were compared in both aerobic and anaerobic conditions. An enrichment analysis of TFs known to regulate gene expression was performed (STAR Methods). There are 196 TFs with known regulons available in Regulon DB (Huerta et al., 1998). For each strain, an average of 28±3 TFs were enriched for differential control of expressed genes in aerobic conditions and 29±6 TFs were enriched in anaerobic conditions (Data S6). An informative example is that of the galactitol regulon which includes gatYZABCD and is negatively repressed by the gatR TF (Nobelmann and Lengeler, 1995). The gatR TF is highly enriched for differential expression in all of the strains except W3110. In MG1655 and W3110, the gatR gene is inactivated by an IS3E insertion leading to constitutive expression of these genes (Nobelmann and Lengeler, 1996). This aberrant regulation leads to expression and translation of gat genes that are ultimately responsible for nearly 1% of the wild-type E. coli K-12 MG1655 proteome (Li et al., 2014). In the other strains, gat gene expression is low, in part due to repression by gatR.
Other TFs that were significantly enriched for differential expression include, in aerobic conditions: arcA (anoxic redox control), cra (the catabolite repressor activator), and gadE (glutamic acid decarboxylase involved in maintenance of pH homeostasis), and anaerobically: fnr (mediates aerobic to anaerobic transistion), IHF (integration host factor, responsible for maintaining DNA architecture), and purR (controls purine nucleotide biosynthesis). Transcription factors known to control genes in a shift from aerobic to anaerobic states were also examined (Table S2). Examining TF enrichment between strains identifies unique, strain-specific control mechanisms for different genes, even those that are conserved between strains. Further analysis will aid in determining differential regulatory mechanisms between strains of E. coli with the ultimate goal of manipulating gene expression to enhance metabolic engineering strategies as well as combating additional pathogenic members of the species.
Intersection of high flux pathways with highly expressed genes
A quantified correlation between high flux reactions and gene expression is key to understanding overall cell physiology and is of great interest to industrial biotechnology as overexpression of genes desired to carry high flux is a widely adapted approach to increase production of a target molecule (Lee et al., 2012a). In this study, 50±8% of model-determined high flux reactions also had encoding genes that were highly expressed. This overlap occurred significantly more often than random (empirical p-value < 0.001, permutation test, STAR Methods, Figure S7). Several genes, such as eno, fbaA, and gapA, were consistently high flux and highly expressed in all seven strains (Figure 4A, Data S7). Other gene/reaction pairs were less conserved, including those involved in amino acid metabolism such as ilvD, serC, and aspC, perhaps indicating large differences in amino acid use and biosynthesis between each of the strains. While a correlation between high flux reactions and gene expression is observed, it is unsurprising that several genes/reactions do not correlate as it has demonstrated that gene expression can be a poor indicator of enzymatic activity (Machado and Herrgard, 2014).
Figure 4. A comparison of high flux reactions and highly expressed metabolic genes.
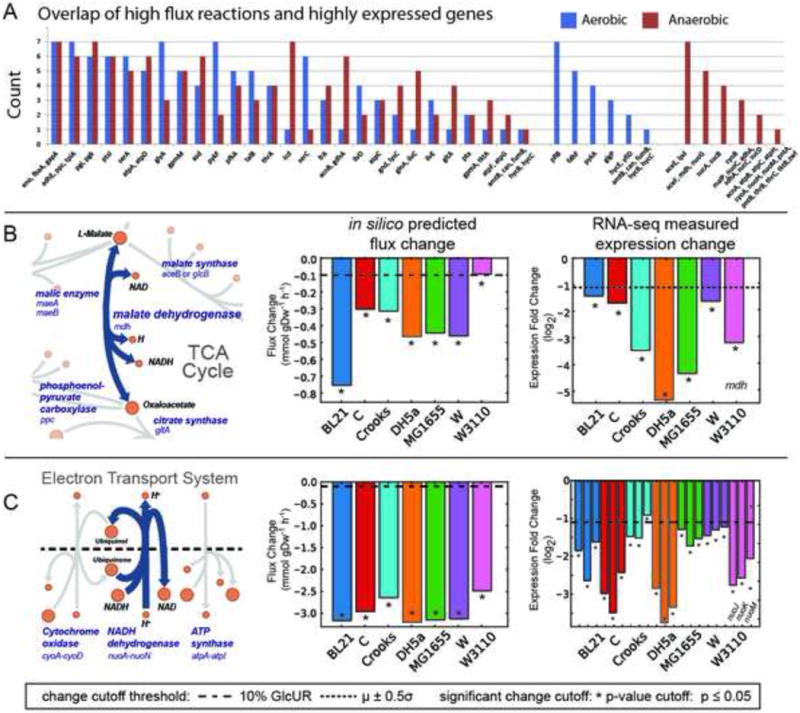
A) The occurrence of a given gene and the reaction it catalyses falling in the intersection of both high flux and highly expressed sets for the seven strains examined. Several pathways are enriched in this intersection set (e.g., lower glycolysis). Genes were grouped if they had identical counts under aerobic and anaerobic conditions. There were several genes that were in this intersection exclusively for aerobic or anaerobic conditions (right side of graph). B & C) The measured physiological data was integrated with genome-scale models to predict changes in gene expression during a shift from aerobic to anaerobic conditions. Shown are two examples for (B) malate dehydrogenase (MDH) and (C) the Electron Transport System. A map is shown of the predicted reaction and its neighbours (left) along with the prediction of the intracellular flux change between aerobic and anaerobic conditions (middle). The actual measured fold change in expression is graphed (right) for comparison with model-predicted flux changes (dashed lines indicate a threshold for minimum magnitude and * indicates significance for the predicted and measured changes). The example for prediction of mdh (B) demonstrates that the model correctly predicts a change in expression; all 7 models predicted a change in MDH flux that exceeded the minimum threshold and the measured expression change of mdh in each strain was large and significant. The nuo genes (C) that catalyse the NADH dehydrogenase reaction also demonstrate good model-based prediction of expression change.
Prior to determining which strain might be best suited to produce a given target compound, an analysis was performed to answer the question of whether GEMs can be used to a priori predict changes in gene expression from one state to another. Using physiological data in aerobic and anaerobic conditions, fluxes were predicted for a shift from aerobic to anaerobic conditions. Overlap between model-predicted changes in reaction fluxes and experimentally observed changes in gene expression were analysed. On average, the metabolic models correctly predicted major changes in flux during a shift from aerobic to anaerobic conditions for 82±8% of the major reaction flux changes (30±12 genes per strain, see Table S3 and S4, Data S7). The results of this analysis indicated a level of predictability suitable for de novo strain-specific prediction in production strains (examples are given in Figure 4B–C).
Model-driven analysis of production potential
An analysis was performed to determine the strain best suited for the production of a given compound as well as expression of a given construct from the set of E. coli strains examined in this study. A common metabolic engineering approach is to increase expression of the genes in a pathway of interest that lead to a product (Lee et al., 2007, Lee et al., 2012a, Huo et al., 2011). Based on this approach, it was reasoned that strains with natively high expression in a pathway of interest are likely better poised to produce a given product, as they would require fewer interventions to achieve a production goal. Therefore, genome-scale modelling was integrated with expression data to determine strains that are inherently best poised for production of a given product. Strain-specific models were used to predict the optimal flux distribution for production of two different sets of compounds in aerobic and anaerobic conditions: 1) all 20 amino acids using native E. coli pathways and 2) 20 non-native compounds using 245 heterologous pathways (Campodonico et al., 2014) (Data S8). Combining predicted fluxes with gene expression values allowed for the generation of a relative production potential score (‘R-score’, STAR Methods) that gauges a strain’s suitability for producing a given compound (e.g., Figure 5C and 5D).
Figure 5. Strain-specific production potential.
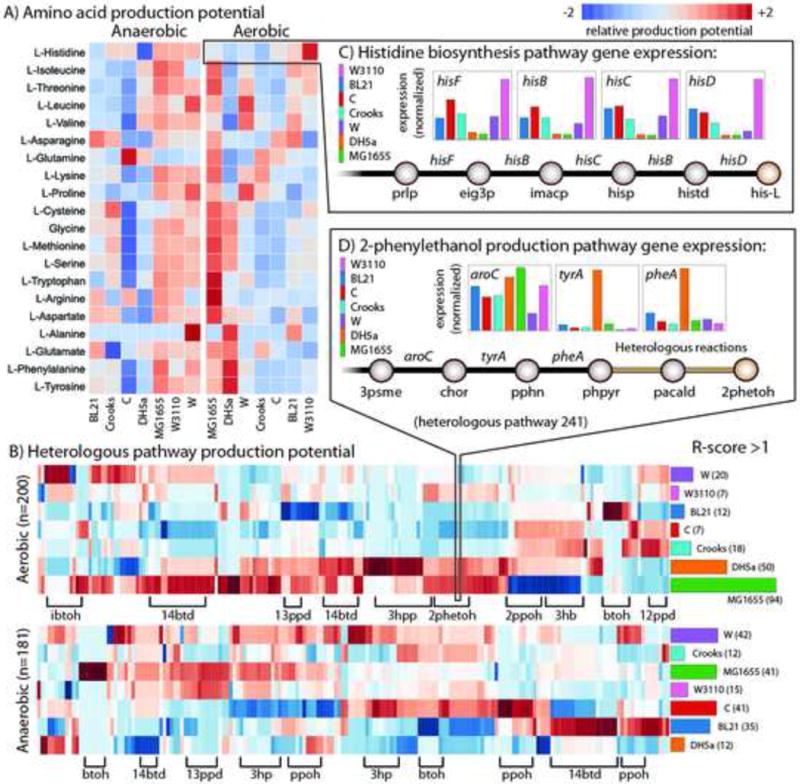
The product potential for targeted metabolites was evaluated based on native gene expression for high yield pathways of interest measured using RNAseq and genome-scale modelling (see main text and STAR Methods). A) A heat map displaying the relative production potentials for all 20 amino acids (left axis) for each strain (bottom axis) in aerobic and anaerobic conditions. Red indicates the highest potential and blue the lowest (see legend). B) A heat map of the relative production potential for 245 and 200 viable heterologous pathways in aerobic (top) and anaerobic (bottom) conditions, respectively. Heterologous pathways are clustered (columns) based on the target product (there can be many compounds for a given compound) and some of the most abundant are labelled on the bottom axis. The right axis shows a plot of the number of instances where each strain has an ‘R-score’ (relative production potential score, see STAR Methods) > 1. C) Example demonstrating the production potential for histidine biosynthesis. Shown are the final five reaction steps and relative expression levels of their catalysing genes for each strain. Strain W3110 (pink) has greater gene expression of these his operon genes, making it particularly well suited to produce histidine. D) A similar example demonstrating production potential for heterologous production of 2-phenylethanol. Here, the last three steps (before the heterologous pathway) are shown with their relative native expression levels. This heterologous pathway branches from phenylpyruvate (phpyr), an intermediate of tyrosine biosynthesis. DH5a has high native expression of these 3 steps along with others in the pathway. All metabolite abbreviations are listed in Data S3. The scores for each product and contributing expression values and flux profiles are available in Data S15.
An integrated analysis using transcriptomic data and genome-scale modelling revealed that each of the seven strains may be preferentially suited for production of different target metabolites. Strains that most often had an R-score >1 for amino acid production were MG1655 and DH5a for aerobic conditions (12/20 and 5/20, respectively) and MG1655 and W for anaerobic conditions (7/20 and 3/20, respectively). The targeted product also highlighted strain-specific differences. For example, in aerobic amino acid over-production (Figure 5A), it was found that E. coli W was predicted to be better at production of pyruvate-derived amino acids leucine and valine due to a more than two-fold greater expression of leuC, leuD, and ilvE compared to the other six strains. Variations in production potential were also prevalent across the 245 heterologous pathways examined (corresponding to one of 20 different industrial compounds, some targeted products originated from multiple native precursors in the cell). Similarly, R-scores >1 were distributed across all seven strains examined. K-12 MG1655 had the highest number of R-scores >1 for 94 pathways aerobically, and W and C had 42 and 41 under anaerobic conditions, respectively (Figure 5B).
Grouping the 20 different targeted heterologous products leads to a further characterization based on which strains were best suited for production of a particular class of compound. For example, strain W was best suited for production of 5/20 compounds (2-methyl-1-butanol, 1-butanol, 3-methyl-1-butanol, 2-keto-isovaleric acid, and 2,3-butanediol) independent of the heterologous pathway used (Table S5). In contrast, the best production strain for 1,4-butanediol varied based on the heterologous pathway used. For example, strain K-12 MG1655 had high expression of 2-oxogluterate dehydrogenase encoding genes sucA, sucB, and lpd (2-fold greater than expression for strains C, Crooks, DHa, and W3110) that produce succinyl-CoA, a branch point for several of the pathways leading to 1,4-butanediol production. However, other heterologous pathways leading to production of 1,4-butanediol start from 4-aminobutanal and DH5a was predicted to be best suited for these pathways.
Extending the model-driven analysis to selection of host strains (i.e., chassis) for synthetic biology applications revealed strain preferences based on amino acid requirements of a given construct. Coding sequences of synthetic biology constructs were obtained from the registry of standard biological parts (2015) and their amino acid composition was calculated. Further, the overall amino acid makeup of the E. coli proteome is stable (Li et al., 2014) and this trend holds true for amino acid frequencies across bacteria (Gilis et al., 2001, Hormoz, 2013, Latif et al., 2015). Thus, constructs with amino acid compositions that are significantly over-represented may require higher demand for a given amino acid if the goal is to significantly produce the construct as a large part of the host strain’s proteome. Analysing this concept, the R-score analysis for amino acid production capability was applied to each construct by comparing the overlap of a strain’s highly expressed amino acid biosynthetic pathways (found to be 1–4 amino acid pathways per strain based on the R-score) with those overrepresented in each construct. This approach led to a prediction of which strains may be best at expressing a certain synthetic biology construct considering both construct required and total amino acid pathways enriched in a strain (Figure S8). Under aerobic conditions, strain DH5a was predicted to be the best producer for the most constructs (568/3,983 or 14% of constructs) due to its inherent high expression of the biosynthetic pathways for tyrosine (Y) and phenylalanine (F) (amino acids that are often small fractions of the proteome) followed by BL21 (473/3,983 or 12% constructs) for similar reasons. This result aligns well with the fact that DH5a is often preferred and used in cloning applications (Taylor et al., 1993, Song et al., 2015) and BL21 is popular for expression of recombinant proteins (Robichon et al., 2011, Marisch et al., 2013).
In summary, this approach emphasized the importance of strain-specific advantages in terms of network structure and native expression states that should be considered when choosing a host strain or chassis. Full results are provided in Data S8 and S9.
Discussion
This study establishes a workflow to quantitatively compare strains in a species. This workflow was used to guide selection of the best host for applied biotechnology and, in general, presents a multi-omic resource for the important bacterial species E. coli. The omics data generated here addresses a gap in E. coli knowledge for comparing strains of this well-known species and its strain-specific information for seven industrially important strains grown in two well-defined conditions. This unified multi-omics dataset was integrated with GEMs to characterize strain-specific and species-wide properties of E. coli by comparing metabolic fluxes, gene expression, and differential regulation across the strains. New, quantified relationships between these datasets were drawn, along with an evaluation of the production potential of the strains based on maximum theoretical production yields and strain-specific native expression states. The compendium of data, GEMs, and production pathway analyses presented here provide the basis for analysing the overall diversity and production capabilities of the seven E. coli strains studied and could further be leveraged for additional applications such as antimicrobial strategies in healthcare. Key findings are available in Table S6.
A number of important strain-specific and species-wide properties for E. coli were identified. The K-12 strains are genetically very similar considering the overall genetic diversity of the 7 strains, yet their expression profiles under aerobic conditions showed significant variability (Figure 3). Previous studies have shown that W3110 has an amber mutation (stop codon) at position 33 in rpoS which is not found in MG1655 (Vijayendran et al., 2007). This mutation has been shown to reduce RpoS activity (Subbarayan and Sarkar, 2004). RpoS is one of the primary global regulators of E. coli’s complex regulatory network. Thus, a small change can have a large effect on cellular expression patterns. This highlights the need to better understand and elucidate transcription factor network architecture in even closely related strains of E. coli; the data presented here enables such a study.
The phenotypic differences observed between the strains, despite the fact that they have largely similar genomes and metabolic reaction networks compared to other sequenced E. coli strains (Monk et al., 2013, Baumler et al., 2011, Vieira et al., 2011), were among the most striking results from this study. The glucose uptake rates measured for the different strains were observed to vary more than 3-fold in anaerobic conditions. If the measured wild-type uptake rates can be even partially conserved when generating a bioprocessing strain, selection on this criterion alone could have major implications for strain productivity and bioprocess titres (Arifin et al., 2014). Also, there are a number of cases where some strains have additional or are lacking certain metabolic enzymes. The maximum theoretical production analysis presented here (Figure S4) demonstrates that these details are crucial to consider when selecting strains for a metabolic engineering project. Further, the pan-genome of this set is relatively small compared to all E. coli strains which have been sequenced thus far (Gordienko et al., 2013), implying that other strains may have pathways and enzymes available to mine for production purposes. Another key result was the identification of a 50±8% overlap of high-flux reactions with highly expressed genes that is in line with other studies (Holm et al., 2010, Ishii et al., 2007). This significant overlap defines an expected outcome for such data sets. Failure modes may be unnecessarily expressed for a given bioprocess and are therefore targets for expression reduction.
Maximum theoretical production and the native expression state of the cell are important considerations when choosing a strain. The case studies presented here show that specific strains have unique flux and gene expression patterns that, in turn, may affect the production capacity of a compound or construct. The native expression of genes within a pathway of interest is not the only factor influencing the generation of a successful production strain. For example, E. coli strain DH5a is often used in cloning applications due to an endA1 mutation that inactivates an intracellular endonuclease (Taylor et al., 1993) and BL21 is well established in recombinant protein production due to a lack of the Lon and OmpT proteases (Ratelade et al., 2009). Thus, aspects such as transformation efficiency (Liu et al., 2014), phage resistance (Furukawa and Mizushima, 1982), product tolerance (Lennen and Herrgard, 2014), and other traits must also be considered. Furthermore, maximizing theoretical yield does not necessarily lead to increases in titre or productivity. However, the workflow presented here, combining GEMs and omics data, could result in significant time and cost savings by reducing the number of genetic modifications necessary to develop high-level production strains or find a host to produce a construct of interest in a sufficiently high amount.
The new multi-omics data set provided in this study was generated using consistent and defined conditions for multiple strains of a species. Combined with the integrated analysis performed here, it will be of great use for industrial, basic biology, and human health applications. For example, this data and the R-score method could be applied to examine the production of reactive oxygen species across different strains to determine the impact on antimicrobial treatment (Brynildsen et al., 2013, Adolfsen and Brynildsen, 2015). This unified and normalized data set allows one to quantitatively compare strains and represents a comprehensive compendium of unique strain characteristics. The generation of similar datasets integrated with genome-scale modelling will enable rational strain-selection and design for metabolic engineering and synthetic biology projects in other common production host organisms.
Supplementary Material
Acknowledgments
The work was funded by the Novo Nordisk Foundation and by grant 1R01GM057089 from the NIH/NIGMS.
Footnotes
Publisher's Disclaimer: This is a PDF file of an unedited manuscript that has been accepted for publication. As a service to our customers we are providing this early version of the manuscript. The manuscript will undergo copyediting, typesetting, and review of the resulting proof before it is published in its final citable form. Please note that during the production process errors may be discovered which could affect the content, and all legal disclaimers that apply to the journal pertain.
Author Contributions
Conceptualization: JMM, AMF; Methodology: JMM, AK, MC, MH, AMF; Investigation, JMM, AK, MC, DM, JMS, BOP, AMF; Writing: JMM, AK, AMF, MJH, BOP; Funding Acquisition: AMF, MH, BOP; Resources: MJH, AMF, BOP; Supervision: MJH, BOP, AMF.
References
- 1.Registry of Standard Biological Parts v6.0 [Online] 2015 Available: http://parts.igem.org/Registry_API [Accessed]
- 2.ABRAMSKY T, ROWLAND LP, SHEMIN D. The formation of isoleucine from beta-methylaspartic acid in Escherichia coli W. J Biol Chem. 1962;237:PC265–PC266. [PubMed] [Google Scholar]
- 3.ABRAMSKY T, SHEMIN D. The Formation of Isoleucine from Beta-Methylaspartic Acid in Escherichia Coli W. J Biol Chem. 1965;240:2971–5. [PubMed] [Google Scholar]
- 4.ADOLFSEN KJ, BRYNILDSEN MP. Futile cycling increases sensitivity toward oxidative stress in Escherichia coli. Metab Eng. 2015;29:26–35. doi: 10.1016/j.ymben.2015.02.006. [DOI] [PMC free article] [PubMed] [Google Scholar]
- 5.ALTERTHUM F, INGRAM LO. Efficient ethanol production from glucose, lactose, and xylose by recombinant Escherichia coli. Appl Environ Microbiol. 1989;55:1943–8. doi: 10.1128/aem.55.8.1943-1948.1989. [DOI] [PMC free article] [PubMed] [Google Scholar]
- 6.ARCHER CT, KIM JF, JEONG H, PARK JH, VICKERS CE, LEE SY, NIELSEN LK. The genome sequence of E. coli W (ATCC 9637): comparative genome analysis and an improved genome-scale reconstruction of E. coli. BMC Genomics. 2011;12:9. doi: 10.1186/1471-2164-12-9. [DOI] [PMC free article] [PubMed] [Google Scholar]
- 7.ARIFIN Y, ARCHER C, LIM S, QUEK LE, SUGIARTO H, MARCELLIN E, VICKERS CE, KROMER JO, NIELSEN LK. Escherichia coli W shows fast, highly oxidative sucrose metabolism and low acetate formation. Appl Microbiol Biotechnol. 2014;98:9033–44. doi: 10.1007/s00253-014-5956-4. [DOI] [PubMed] [Google Scholar]
- 8.ATLAS R. Handbook of Microbiological Media. CRC Press; 2010. [Google Scholar]
- 9.BACHMANN B. Derivations and genotypes of some mutant derivatives of Escherichia coli K-12 in Escherichia coli and Salmonella typhimurium Cellular and Molecular Biology. Washington, DC: ASM Press; 1996. [Google Scholar]
- 10.BACHMANN BJ. Pedigrees of some mutant strains of Escherichia coli K-12. Bacteriol Rev. 1972;36:525–57. doi: 10.1128/br.36.4.525-557.1972. [DOI] [PMC free article] [PubMed] [Google Scholar]
- 11.BAUMLER DJ, PEPLINSKI RG, REED JL, GLASNER JD, PERNA NT. The evolution of metabolic networks of E. coli. BMC Syst Biol. 2011;5:182. doi: 10.1186/1752-0509-5-182. [DOI] [PMC free article] [PubMed] [Google Scholar]
- 12.BERTANI G. Studies on lysogenesis. I. The mode of phage liberation by lysogenic Escherichia coli. J Bacteriol. 1951;62:293–300. doi: 10.1128/jb.62.3.293-300.1951. [DOI] [PMC free article] [PubMed] [Google Scholar]
- 13.BERTANI G, WEIGLE JJ. Host controlled variation in bacterial viruses. J Bacteriol. 1953;65:113–21. doi: 10.1128/jb.65.2.113-121.1953. [DOI] [PMC free article] [PubMed] [Google Scholar]
- 14.BLATTNER FR, PLUNKETT G, 3RD, BLOCH CA, PERNA NT, BURLAND V, RILEY M, COLLADO-VIDES J, GLASNER JD, RODE CK, MAYHEW GF, GREGOR J, DAVIS NW, KIRKPATRICK HA, GOEDEN MA, ROSE DJ, MAU B, SHAO Y. The complete genome sequence of Escherichia coli K-12. Science. 1997;277:1453–62. doi: 10.1126/science.277.5331.1453. [DOI] [PubMed] [Google Scholar]
- 15.BLOUNT ZD, BORLAND CZ, LENSKI RE. Historical contingency and the evolution of a key innovation in an experimental population of Escherichia coli. Proc Natl Acad Sci U S A. 2008;105:7899–906. doi: 10.1073/pnas.0803151105. [DOI] [PMC free article] [PubMed] [Google Scholar]
- 16.BRUSCHI M, BOYES SJ, SUGIARTO H, NIELSEN LK, VICKERS CE. A transferable sucrose utilization approach for non-sucrose-utilizing Escherichia coli strains. Biotechnol Adv. 2012;30:1001–10. doi: 10.1016/j.biotechadv.2011.08.019. [DOI] [PubMed] [Google Scholar]
- 17.BRYNILDSEN MP, WINKLER JA, SPINA CS, MACDONALD IC, COLLINS JJ. Potentiating antibacterial activity by predictably enhancing endogenous microbial ROS production. Nat Biotechnol. 2013;31:160–5. doi: 10.1038/nbt.2458. [DOI] [PMC free article] [PubMed] [Google Scholar]
- 18.CAMPODONICO MA, ANDREWS BA, ASENJO JA, PALSSON BO, FEIST AM. Generation of an atlas for commodity chemical production in Escherichia coli and a novel pathway prediction algorithm, GEM-Path. Metab Eng. 2014;25:140–58. doi: 10.1016/j.ymben.2014.07.009. [DOI] [PubMed] [Google Scholar]
- 19.CHAE HS, KIM KH, KIM SC, LEE PC. Strain-dependent carotenoid productions in metabolically engineered Escherichia coli. Appl Biochem Biotechnol. 2010;162:2333–44. doi: 10.1007/s12010-010-9006-0. [DOI] [PubMed] [Google Scholar]
- 20.COVERT MW, KNIGHT EM, REED JL, HERRGARD MJ, PALSSON BO. Integrating high-throughput and computational data elucidates bacterial networks. Nature. 2004;429:92–6. doi: 10.1038/nature02456. [DOI] [PubMed] [Google Scholar]
- 21.DAEGELEN P, STUDIER FW, LENSKI RE, CURE S, KIM JF. Tracing ancestors and relatives of Escherichia coli B, and the derivation of B strains REL606 and BL21(DE3) J Mol Biol. 2009;394:634–43. doi: 10.1016/j.jmb.2009.09.022. [DOI] [PubMed] [Google Scholar]
- 22.DIAZ E. Bacterial degradation of aromatic pollutants: a paradigm of metabolic versatility. Int Microbiol. 2004;7:173–80. [PubMed] [Google Scholar]
- 23.DOBRINDT U, AGERER F, MICHAELIS K, JANKA A, BUCHRIESER C, SAMUELSON M, SVANBORG C, GOTTSCHALK G, KARCH H, HACKER J. Analysis of genome plasticity in pathogenic and commensal Escherichia coli isolates by use of DNA arrays. J Bacteriol. 2003;185:1831–40. doi: 10.1128/JB.185.6.1831-1840.2003. [DOI] [PMC free article] [PubMed] [Google Scholar]
- 24.DURIEZ P, CLERMONT O, BONACORSI S, BINGEN E, CHAVENTRE A, ELION J, PICARD B, DENAMUR E. Commensal Escherichia coli isolates are phylogenetically distributed among geographically distinct human populations. Microbiology. 2001;147:1671–6. doi: 10.1099/00221287-147-6-1671. [DOI] [PubMed] [Google Scholar]
- 25.DURINCK S, MOREAU Y, KASPRZYK A, DAVIS S, DE MOOR B, BRAZMA A, HUBER W. BioMart and Bioconductor: a powerful link between biological databases and microarray data analysis. Bioinformatics. 2005;21:3439–40. doi: 10.1093/bioinformatics/bti525. [DOI] [PubMed] [Google Scholar]
- 26.EBRAHIM A, LERMAN JA, PALSSON BO, HYDUKE DR. COBRApy: COnstraints-Based Reconstruction and Analysis for Python. BMC Syst Biol. 2013;7:74. doi: 10.1186/1752-0509-7-74. [DOI] [PMC free article] [PubMed] [Google Scholar]
- 27.ESSELEN WB, FULLER JE. The Oxidation of Ascorbic Acid as Influenced by Intestinal Bacteria. J Bacteriol. 1939;37:501–21. doi: 10.1128/jb.37.5.501-521.1939. [DOI] [PMC free article] [PubMed] [Google Scholar]
- 28.FAN F, MACNAB RM. Enzymatic characterization of FliI. An ATPase involved in flagellar assembly in Salmonella typhimurium. J Biol Chem. 1996;271:31981–8. doi: 10.1074/jbc.271.50.31981. [DOI] [PubMed] [Google Scholar]
- 29.FAN J, YE J, KAMPHORST JJ, SHLOMI T, THOMPSON CB, RABINOWITZ JD. Quantitative flux analysis reveals folate-dependent NADPH production. Nature. 2014;510:298–302. doi: 10.1038/nature13236. [DOI] [PMC free article] [PubMed] [Google Scholar]
- 30.FEIST AM, PALSSON BO. The biomass objective function. Curr Opin Microbiol. 2010;13:344–9. doi: 10.1016/j.mib.2010.03.003. [DOI] [PMC free article] [PubMed] [Google Scholar]
- 31.FREDDOLINO PL, AMINI S, TAVAZOIE S. Newly identified genetic variations in common Escherichia coli MG1655 stock cultures. J Bacteriol. 2012;194:303–6. doi: 10.1128/JB.06087-11. [DOI] [PMC free article] [PubMed] [Google Scholar]
- 32.FURUKAWA H, MIZUSHIMA S. Roles of cell surface components of Escherichia coli K-12 in bacteriophage T4 infection: interaction of tail core with phospholipids. J Bacteriol. 1982;150:916–24. doi: 10.1128/jb.150.2.916-924.1982. [DOI] [PMC free article] [PubMed] [Google Scholar]
- 33.GILIS D, MASSAR S, CERF NJ, ROOMAN M. Optimality of the genetic code with respect to protein stability and amino-acid frequencies. Genome Biol. 2001;2:RESEARCH0049. doi: 10.1186/gb-2001-2-11-research0049. [DOI] [PMC free article] [PubMed] [Google Scholar]
- 34.GORDIENKO EN, KAZANOV MD, GELFAND MS. Evolution of pan-genomes of Escherichia coli, Shigella spp., and Salmonella enterica. J Bacteriol. 2013;195:2786–92. doi: 10.1128/JB.02285-12. [DOI] [PMC free article] [PubMed] [Google Scholar]
- 35.GORDON DM, CLERMONT O, TOLLEY H, DENAMUR E. Assigning Escherichia coli strains to phylogenetic groups: multi-locus sequence typing versus the PCR triplex method. Environ Microbiol. 2008;10:2484–96. doi: 10.1111/j.1462-2920.2008.01669.x. [DOI] [PubMed] [Google Scholar]
- 36.GRAY CH, TATUM EL. X-Ray Induced Growth Factor Requirements in Bacteria. Proc Natl Acad Sci U S A. 1944;30:404–10. doi: 10.1073/pnas.30.12.404. [DOI] [PMC free article] [PubMed] [Google Scholar]
- 37.GUNSALUS CF, TONZETICH J. Transaminases for pyridoxamine and purines. Nature. 1952;170:162. doi: 10.1038/170162a0. [DOI] [PubMed] [Google Scholar]
- 38.GUNSALUS I, HAND D. The use of bacteria in the chemical determination of total vitamin C. J Biol Chem. 1941;141:853–858. [Google Scholar]
- 39.GUTKNECHT R, BEUTLER R, GARCIA-ALLES LF, BAUMANN U, ERNI B. The dihydroxyacetone kinase of Escherichia coli utilizes a phosphoprotein instead of ATP as phosphoryl donor. EMBO J. 2001;20:2480–6. doi: 10.1093/emboj/20.10.2480. [DOI] [PMC free article] [PubMed] [Google Scholar]
- 40.GUYER MS, REED RR, STEITZ JA, LOW KB. Identification of a sex-factor-affinity site in E. coli as gamma delta. Cold Spring Harb Symp Quant Biol. 1981;45(Pt 1):135–40. doi: 10.1101/sqb.1981.045.01.022. [DOI] [PubMed] [Google Scholar]
- 41.HANSEN KD, BRENNER SE, DUDOIT S. Biases in Illumina transcriptome sequencing caused by random hexamer priming. Nucleic Acids Res. 2010;38:e131. doi: 10.1093/nar/gkq224. [DOI] [PMC free article] [PubMed] [Google Scholar]
- 42.HOLM AK, BLANK LM, OLDIGES M, SCHMID A, SOLEM C, JENSEN PR, VEMURI GN. Metabolic and transcriptional response to cofactor perturbations in Escherichia coli. J Biol Chem. 2010;285:17498–506. doi: 10.1074/jbc.M109.095570. [DOI] [PMC free article] [PubMed] [Google Scholar]
- 43.HORMOZ S. Amino acid composition of proteins reduces deleterious impact of mutations. Sci Rep. 2013;3:2919. doi: 10.1038/srep02919. [DOI] [PMC free article] [PubMed] [Google Scholar]
- 44.HUERTA AM, SALGADO H, THIEFFRY D, COLLADO-VIDES J. RegulonDB: a database on transcriptional regulation in Escherichia coli. Nucleic Acids Res. 1998;26:55–9. doi: 10.1093/nar/26.1.55. [DOI] [PMC free article] [PubMed] [Google Scholar]
- 45.HUO YX, CHO KM, RIVERA JG, MONTE E, SHEN CR, YAN Y, LIAO JC. Conversion of proteins into biofuels by engineering nitrogen flux. Nat Biotechnol. 2011;29:346–51. doi: 10.1038/nbt.1789. [DOI] [PubMed] [Google Scholar]
- 46.ISHII N, NAKAHIGASHI K, BABA T, ROBERT M, SOGA T, KANAI A, HIRASAWA T, NABA M, HIRAI K, HOQUE A, HO PY, KAKAZU Y, SUGAWARA K, IGARASHI S, HARADA S, MASUDA T, SUGIYAMA N, TOGASHI T, HASEGAWA M, TAKAI Y, YUGI K, ARAKAWA K, IWATA N, TOYA Y, NAKAYAMA Y, NISHIOKA T, SHIMIZU K, MORI H, TOMITA M. Multiple high-throughput analyses monitor the response of E. coli to perturbations. Science. 2007;316:593–7. doi: 10.1126/science.1132067. [DOI] [PubMed] [Google Scholar]
- 47.JANG YS, KIM B, SHIN JH, CHOI YJ, CHOI S, SONG CW, LEE J, PARK HG, LEE SY. Bio-based production of C2-C6 platform chemicals. Biotechnol Bioeng. 2012;109:2437–59. doi: 10.1002/bit.24599. [DOI] [PubMed] [Google Scholar]
- 48.JANTAMA K, HAUPT MJ, SVORONOS SA, ZHANG X, MOORE JC, SHANMUGAM KT, INGRAM LO. Combining metabolic engineering and metabolic evolution to develop nonrecombinant strains of Escherichia coli C that produce succinate and malate. Biotechnol Bioeng. 2008;99:1140–53. doi: 10.1002/bit.21694. [DOI] [PubMed] [Google Scholar]
- 49.JAUREGUY F, LANDRAUD L, PASSET V, DIANCOURT L, FRAPY E, GUIGON G, CARBONNELLE E, LORTHOLARY O, CLERMONT O, DENAMUR E, PICARD B, NASSIF X, BRISSE S. Phylogenetic and genomic diversity of human bacteremic Escherichia coli strains. BMC Genomics. 2008;9:560. doi: 10.1186/1471-2164-9-560. [DOI] [PMC free article] [PubMed] [Google Scholar]
- 50.JNES E, OLIPHANT E, PETERSON PEA. SciPy: Open Source Scientific Tools for Python [Online] 2001 Available: http://www.scipy.org/ [Accessed 2015-04-26]
- 51.JOLLEY KA, CHAN MS, MAIDEN MC. mlstdbNet - distributed multi-locus sequence typing (MLST) databases. BMC Bioinformatics. 2004;5:86. doi: 10.1186/1471-2105-5-86. [DOI] [PMC free article] [PubMed] [Google Scholar]
- 52.JUNG SC, SMITH CL, LEE KS, HONG ME, KWEON DH, STEPHANOPOULOS G, JIN YS. Restoration of growth phenotypes of Escherichia coli DH5alpha in minimal media through reversal of a point mutation in purB. Appl Environ Microbiol. 2010;76:6307–9. doi: 10.1128/AEM.01210-10. [DOI] [PMC free article] [PubMed] [Google Scholar]
- 53.KESELER IM, BONAVIDES-MARTINEZ C, COLLADO-VIDES J, GAMA-CASTRO S, GUNSALUS RP, JOHNSON DA, KRUMMENACKER M, NOLAN LM, PALEY S, PAULSEN IT, PERALTA-GIL M, SANTOS-ZAVALETA A, SHEARER AG, KARP PD. EcoCyc: a comprehensive view of Escherichia coli biology. Nucleic Acids Res. 2009;37:D464–70. doi: 10.1093/nar/gkn751. [DOI] [PMC free article] [PubMed] [Google Scholar]
- 54.KIM B, KIM WJ, KIM DI, LEE SY. Applications of genome-scale metabolic network model in metabolic engineering. J Ind Microbiol Biotechnol. 2015;42:339–48. doi: 10.1007/s10295-014-1554-9. [DOI] [PubMed] [Google Scholar]
- 55.KIM B, PARK H, NA D, LEE SY. Metabolic engineering of Escherichia coli for the production of phenol from glucose. Biotechnol J. 2014;9:621–9. doi: 10.1002/biot.201300263. [DOI] [PubMed] [Google Scholar]
- 56.KIM KH. Isolation and Properties of a Putrescine-Degrading Mutant of Escherichia Coli. J Bacteriol. 1963;86:320–3. doi: 10.1128/jb.86.2.320-323.1963. [DOI] [PMC free article] [PubMed] [Google Scholar]
- 57.KIM KH. Purification and Properties of a Diamine Alpha-Ketoglutarate Transaminase from Escherichia Coli. J Biol Chem. 1964;239:783–6. [PubMed] [Google Scholar]
- 58.KIM KH, TCHEN TT. Putrescine–alpha-ketoglutarate trans-aminase in E. coli. Biochem Biophys Res Commun. 1962;9:99–102. doi: 10.1016/0006-291x(62)90095-5. [DOI] [PubMed] [Google Scholar]
- 59.KLEMAN GL, STROHL WR. Acetate metabolism by Escherichia coli in high-cell-density fermentation. Appl Environ Microbiol. 1994;60:3952–8. doi: 10.1128/aem.60.11.3952-3958.1994. [DOI] [PMC free article] [PubMed] [Google Scholar]
- 60.KOHARA Y, AKIYAMA K, ISONO K. The physical map of the whole E. coli chromosome: application of a new strategy for rapid analysis and sorting of a large genomic library. Cell. 1987;50:495–508. doi: 10.1016/0092-8674(87)90503-4. [DOI] [PubMed] [Google Scholar]
- 61.KUMAR VS, MARANAS CD. GrowMatch: an automated method for reconciling in silico/in vivo growth predictions. PLoS Comput Biol. 2009;5:e1000308. doi: 10.1371/journal.pcbi.1000308. [DOI] [PMC free article] [PubMed] [Google Scholar]
- 62.LATIF H, SZUBIN R, TAN J, BRUNK E, LECHNER A, ZENGLER K, PALSSON BO. A streamlined ribosome profiling protocol for the characterization of microorganisms. Biotechniques. 2015;58:329–32. doi: 10.2144/000114302. [DOI] [PubMed] [Google Scholar]
- 63.LEDERBERG EM, LEDERBERG J. Genetic Studies of Lysogenicity in Escherichia Coli. Genetics. 1953;38:51–64. doi: 10.1093/genetics/38.1.51. [DOI] [PMC free article] [PubMed] [Google Scholar]
- 64.LEE JW, NA D, PARK JM, LEE J, CHOI S, LEE SY. Systems metabolic engineering of microorganisms for natural and non-natural chemicals. Nat Chem Biol. 2012a;8:536–46. doi: 10.1038/nchembio.970. [DOI] [PubMed] [Google Scholar]
- 65.LEE KH, PARK JH, KIM TY, KIM HU, LEE SY. Systems metabolic engineering of Escherichia coli for L-threonine production. Mol Syst Biol. 2007;3:149. doi: 10.1038/msb4100196. [DOI] [PMC free article] [PubMed] [Google Scholar]
- 66.LEE SY, KIM HU. Systems strategies for developing industrial microbial strains. Nat Biotechnol. 2015;33:1061–72. doi: 10.1038/nbt.3365. [DOI] [PubMed] [Google Scholar]
- 67.LEE SY, LEE DY, KIM TY. Systems biotechnology for strain improvement. Trends Biotechnol. 2005;23:349–58. doi: 10.1016/j.tibtech.2005.05.003. [DOI] [PubMed] [Google Scholar]
- 68.LEE SY, MATTANOVICH D, VILLAVERDE A. Systems metabolic engineering, industrial biotechnology and microbial cell factories. Microb Cell Fact. 2012b;11:156. doi: 10.1186/1475-2859-11-156. [DOI] [PMC free article] [PubMed] [Google Scholar]
- 69.LENNEN RM, HERRGARD MJ. Combinatorial strategies for improving multiple-stress resistance in industrially relevant Escherichia coli strains. Appl Environ Microbiol. 2014;80:6223–42. doi: 10.1128/AEM.01542-14. [DOI] [PMC free article] [PubMed] [Google Scholar]
- 70.LENSKI RE, ROSE MR, SIMPSON SC, TADLER SC. Long-term experimental evolution in Escherichia coli. I. Adaptation and divergence during 2,000 generations. Am Nat. 1991;138:1315–1341. [Google Scholar]
- 71.LI GW, BURKHARDT D, GROSS C, WEISSMAN JS. Quantifying absolute protein synthesis rates reveals principles underlying allocation of cellular resources. Cell. 2014;157:624–35. doi: 10.1016/j.cell.2014.02.033. [DOI] [PMC free article] [PubMed] [Google Scholar]
- 72.LIU X, LIU L, WANG Y, WANG X, MA Y, LI Y. The Study on the factors affecting transformation efficiency of E. coli competent cells. Pak J Pharm Sci. 2014;27:679–84. [PubMed] [Google Scholar]
- 73.LUKJANCENKO O, WASSENAAR TM, USSERY DW. Comparison of 61 sequenced Escherichia coli genomes. Microb Ecol. 2010;60:708–20. doi: 10.1007/s00248-010-9717-3. [DOI] [PMC free article] [PubMed] [Google Scholar]
- 74.LULI GW, STROHL WR. Comparison of growth, acetate production, and acetate inhibition of Escherichia coli strains in batch and fed-batch fermentations. Appl Environ Microbiol. 1990;56:1004–11. doi: 10.1128/aem.56.4.1004-1011.1990. [DOI] [PMC free article] [PubMed] [Google Scholar]
- 75.LURIA SE, DELBRUCK M. Mutations of Bacteria from Virus Sensitivity to Virus Resistance. Genetics. 1943;28:491–511. doi: 10.1093/genetics/28.6.491. [DOI] [PMC free article] [PubMed] [Google Scholar]
- 76.MACHADO D, HERRGARD M. Systematic evaluation of methods for integration of transcriptomic data into constraint-based models of metabolism. PLoS Comput Biol. 2014;10:e1003580. doi: 10.1371/journal.pcbi.1003580. [DOI] [PMC free article] [PubMed] [Google Scholar]
- 77.MAHADEVAN R, SCHILLING CH. The effects of alternate optimal solutions in constraint-based genome-scale metabolic models. Metab Eng. 2003;5:264–76. doi: 10.1016/j.ymben.2003.09.002. [DOI] [PubMed] [Google Scholar]
- 78.MAHALIK S, SHARMA AK, MUKHERJEE KJ. Genome engineering for improved recombinant protein expression in Escherichia coli. Microb Cell Fact. 2014;13:177. doi: 10.1186/s12934-014-0177-1. [DOI] [PMC free article] [PubMed] [Google Scholar]
- 79.MARISCH K, BAYER K, SCHARL T, MAIRHOFER J, KREMPL PM, HUMMEL K, RAZZAZI-FAZELI E, STRIEDNER G. A comparative analysis of industrial Escherichia coli K-12 and B strains in high-glucose batch cultivations on process-, transcriptome- and proteome level. PLoS One. 2013;8:e70516. doi: 10.1371/journal.pone.0070516. [DOI] [PMC free article] [PubMed] [Google Scholar]
- 80.MCKINNEY W. pandas: a Foundational Python Library for Data Analysis and Statistics. PyHPC2011. 2011 Year. [Google Scholar]
- 81.MEGCHELENBRINK W, HUYNEN M, MARCHIORI E. optGpSampler: an improved tool for uniformly sampling the solution-space of genome-scale metabolic networks. PLoS One. 2014;9:e86587. doi: 10.1371/journal.pone.0086587. [DOI] [PMC free article] [PubMed] [Google Scholar]
- 82.MEIER S, JENSEN PR, DUUS JO. Direct observation of metabolic differences in living Escherichia coli strains K-12 and BL21. Chembiochem. 2012;13:308–10. doi: 10.1002/cbic.201100654. [DOI] [PubMed] [Google Scholar]
- 83.MILLER J. Experiments in Molecular Genetics. Cold Spring Harbor, NY: Cold Spring Harbor Laboratory; 1972. [Google Scholar]
- 84.MONK JM, CHARUSANTI P, AZIZ RK, LERMAN JA, PREMYODHIN N, ORTH JD, FEIST AM, PALSSON BO. Genome-scale metabolic reconstructions of multiple Escherichia coli strains highlight strain-specific adaptations to nutritional environments. Proc Natl Acad Sci U S A. 2013;110:20338–43. doi: 10.1073/pnas.1307797110. [DOI] [PMC free article] [PubMed] [Google Scholar]
- 85.NA D, YOO SM, CHUNG H, PARK H, PARK JH, LEE SY. Metabolic engineering of Escherichia coli using synthetic small regulatory RNAs. Nat Biotechnol. 2013;31:170–4. doi: 10.1038/nbt.2461. [DOI] [PubMed] [Google Scholar]
- 86.NAHKU R, PEEBO K, VALGEPEA K, BARRICK JE, ADAMBERG K, VILU R. Stock culture heterogeneity rather than new mutational variation complicates short-term cell physiology studies of Escherichia coli K-12 MG1655 in continuous culture. Microbiology. 2011;157:2604–10. doi: 10.1099/mic.0.050658-0. [DOI] [PMC free article] [PubMed] [Google Scholar]
- 87.NAKAHIGASHI K, TOYA Y, ISHII N, SOGA T, HASEGAWA M, WATANABE H, TAKAI Y, HONMA M, MORI H, TOMITA M. Systematic phenome analysis of Escherichia coli multiple-knockout mutants reveals hidden reactions in central carbon metabolism. Mol Syst Biol. 2009;5:306. doi: 10.1038/msb.2009.65. [DOI] [PMC free article] [PubMed] [Google Scholar]
- 88.NOBELMANN B, LENGELER JW. Sequence of the gat operon for galactitol utilization from a wild-type strain EC3132 of Escherichia coli. Biochim Biophys Acta. 1995;1262:69–72. doi: 10.1016/0167-4781(95)00053-j. [DOI] [PubMed] [Google Scholar]
- 89.NOBELMANN B, LENGELER JW. Molecular analysis of the gat genes from Escherichia coli and of their roles in galactitol transport and metabolism. J Bacteriol. 1996;178:6790–5. doi: 10.1128/jb.178.23.6790-6795.1996. [DOI] [PMC free article] [PubMed] [Google Scholar]
- 90.NORONHA SB, YEH HJ, SPANDE TF, SHILOACH J. Investigation of the TCA cycle and the glyoxylate shunt in Escherichia coli BL21 and JM109 using (13)C-NMR/MS. Biotechnol Bioeng. 2000;68:316–27. [PubMed] [Google Scholar]
- 91.O’KENNEDY RD, BALDWIN C, KESHAVARZ-MOORE E. Effects of growth medium selection on plasmid DNA production and initial processing steps. J Biotechnol. 2000;76:175–83. doi: 10.1016/s0168-1656(99)00187-x. [DOI] [PubMed] [Google Scholar]
- 92.OHTA K, BEALL DS, MEJIA JP, SHANMUGAM KT, INGRAM LO. Genetic improvement of Escherichia coli for ethanol production: chromosomal integration of Zymomonas mobilis genes encoding pyruvate decarboxylase and alcohol dehydrogenase II. Appl Environ Microbiol. 1991;57:893–900. doi: 10.1128/aem.57.4.893-900.1991. [DOI] [PMC free article] [PubMed] [Google Scholar]
- 93.ORTH J, FLEMING R, PALSSON BO. Reconstruction and use of microbial metabolic networks: the core Escherichia coli metabolic model as an educational guide. In: Karp PD, editor. EcoSal – Escherichia coli and Salmonella Cellular and Molecular Biology. 10.2.1. Washington, DC: ASM Press; 2010a. [DOI] [PubMed] [Google Scholar]
- 94.ORTH JD, CONRAD TM, NA J, LERMAN JA, NAM H, FEIST AM, PALSSON BO. A comprehensive genome-scale reconstruction of Escherichia coli metabolism–2011. Mol Syst Biol. 2011;7:535. doi: 10.1038/msb.2011.65. [DOI] [PMC free article] [PubMed] [Google Scholar]
- 95.ORTH JD, THIELE I, PALSSON BO. What is flux balance analysis? Nat Biotechnol. 2010b;28:245–8. doi: 10.1038/nbt.1614. [DOI] [PMC free article] [PubMed] [Google Scholar]
- 96.PHILLIPS AT, NUSS JI, MOOSIC J, FOSHAY C. Alternate pathway for isoleucine biosynthesis in Escherichia coli. J Bacteriol. 1972;109:714–9. doi: 10.1128/jb.109.2.714-719.1972. [DOI] [PMC free article] [PubMed] [Google Scholar]
- 97.PHUE JN, NORONHA SB, HATTACHARYYA R, WOLFE AJ, SHILOACH J. Glucose metabolism at high density growth of E. coli B and E. coli K: differences in metabolic pathways are responsible for efficient glucose utilization in E. coli B as determined by microarrays and Northern blot analyses. Biotechnol Bioeng. 2005;90:805–20. doi: 10.1002/bit.20478. [DOI] [PubMed] [Google Scholar]
- 98.PINSKE C, BONN M, KRUGER S, LINDENSTRAUSS U, SAWERS RG. Metabolic deficiences revealed in the biotechnologically important model bacterium Escherichia coli BL21(DE3) PLoS One. 2011;6:e22830. doi: 10.1371/journal.pone.0022830. [DOI] [PMC free article] [PubMed] [Google Scholar]
- 99.RATELADE J, MIOT MC, JOHNSON E, BETTON JM, MAZODIER P, BENAROUDJ N. Production of recombinant proteins in the lon-deficient BL21(DE3) strain of Escherichia coli in the absence of the DnaK chaperone. Appl Environ Microbiol. 2009;75:3803–7. doi: 10.1128/AEM.00255-09. [DOI] [PMC free article] [PubMed] [Google Scholar]
- 100.ROBICHON C, LUO J, CAUSEY TB, BENNER JS, SAMUELSON JC. Engineering Escherichia coli BL21(DE3) derivative strains to minimize E. coli protein contamination after purification by immobilized metal affinity chromatography. Appl Environ Microbiol. 2011;77:4634–46. doi: 10.1128/AEM.00119-11. [DOI] [PMC free article] [PubMed] [Google Scholar]
- 101.ROBINSON MD, MCCARTHY DJ, SMYTH GK. edgeR: a Bioconductor package for differential expression analysis of digital gene expression data. Bioinformatics. 2010;26:139–40. doi: 10.1093/bioinformatics/btp616. [DOI] [PMC free article] [PubMed] [Google Scholar]
- 102.SCHELLENBERGER J, PALSSON BO. Use of randomized sampling for analysis of metabolic networks. J Biol Chem. 2009;284:5457–61. doi: 10.1074/jbc.R800048200. [DOI] [PubMed] [Google Scholar]
- 103.SHILOACH J, BAUER S, DE GROOT N, LAPIDOT Y. The influence of the peptide chain length on the activity of peptidyl-tRNA hydrolase from E. coli. Nucleic Acids Res. 1975;2:1941–50. doi: 10.1093/nar/2.10.1941. [DOI] [PMC free article] [PubMed] [Google Scholar]
- 104.SHILOACH J, KAUFMAN J, GUILLARD AS, FASS R. Effect of glucose supply strategy on acetate accumulation, growth, and recombinant protein production by Escherichia coli BL21 (lambdaDE3) and Escherichia coli JM109. Biotechnol Bioeng. 1996;49:421–8. doi: 10.1002/(SICI)1097-0290(19960220)49:4<421::AID-BIT9>3.0.CO;2-R. [DOI] [PubMed] [Google Scholar]
- 105.SOBOTKOVA L, STEPANEK V, PLHACKOVA A, KYSLIK P. Development of a high-expression system for penicillin G acylase based on the recombinant Escherichia coli strain RE3 (pKA18) Enzyme Microb Technol. 1996;19:389–397. [Google Scholar]
- 106.SONG Y, LEE BR, CHO S, CHO YB, KIM SW, KANG TJ, KIM SC, CHO BK. Determination of single nucleotide variants in Escherichia coli DH5alpha by using short-read sequencing. FEMS Microbiol Lett. 2015;362 doi: 10.1093/femsle/fnv073. [DOI] [PubMed] [Google Scholar]
- 107.SPRENGER GA. Genetics of pentose-phosphate pathway enzymes of Escherichia coli K-12. Arch Microbiol. 1995;164:324–30. doi: 10.1007/BF02529978. [DOI] [PubMed] [Google Scholar]
- 108.STUDIER FW, DAEGELEN P, LENSKI RE, MASLOV S, KIM JF. Understanding the differences between genome sequences of Escherichia coli B strains REL606 and BL21(DE3) and comparison of the E. coli B and K-12 genomes. J Mol Biol. 2009;394:653–80. doi: 10.1016/j.jmb.2009.09.021. [DOI] [PubMed] [Google Scholar]
- 109.STUDIER FW, MOFFATT BA. Use of bacteriophage T7 RNA polymerase to direct selective high-level expression of cloned genes. J Mol Biol. 1986;189:113–30. doi: 10.1016/0022-2836(86)90385-2. [DOI] [PubMed] [Google Scholar]
- 110.SUBBARAYAN PR, SARKAR M. A comparative study of variation in codon 33 of the rpoS gene in Escherichia coli K12 stocks: implications for the synthesis of sigma(s) Mol Genet Genomics. 2004;270:533–8. doi: 10.1007/s00438-003-0944-x. [DOI] [PubMed] [Google Scholar]
- 111.TATUM EL. A case history in biological research. Science. 1959;129:1711–5. doi: 10.1126/science.129.3365.1711. [DOI] [PubMed] [Google Scholar]
- 112.TATUSOVA T, CIUFO S, FEDOROV B, O’NEILL K, TOLSTOY I. RefSeq microbial genomes database: new representation and annotation strategy. Nucleic Acids Res. 2014;42:D553–9. doi: 10.1093/nar/gkt1274. [DOI] [PMC free article] [PubMed] [Google Scholar]
- 113.TAYLOR RG, WALKER DC, MCINNES RR. E. coli host strains significantly affect the quality of small scale plasmid DNA preparations used for sequencing. Nucleic Acids Res. 1993;21:1677–8. doi: 10.1093/nar/21.7.1677. [DOI] [PMC free article] [PubMed] [Google Scholar]
- 114.UHLEN M, FAGERBERG L, HALLSTROM BM, LINDSKOG C, OKSVOLD P, MARDINOGLU A, SIVERTSSON A, KAMPF C, SJOSTEDT E, ASPLUND A, OLSSON I, EDLUND K, LUNDBERG E, NAVANI S, SZIGYARTO CA, ODEBERG J, DJUREINOVIC D, TAKANEN JO, HOBER S, ALM T, EDQVIST PH, BERLING H, TEGEL H, MULDER J, ROCKBERG J, NILSSON P, SCHWENK JM, HAMSTEN M, VON FEILITZEN K, FORSBERG M, PERSSON L, JOHANSSON F, ZWAHLEN M, VON HEIJNE G, NIELSEN J, PONTEN F. Proteomics. Tissue-based map of the human proteome. Science. 2015;347:1260419. doi: 10.1126/science.1260419. [DOI] [PubMed] [Google Scholar]
- 115.VAREMO L, NIELSEN J, NOOKAEW I. Enriching the gene set analysis of genome-wide data by incorporating directionality of gene expression and combining statistical hypotheses and methods. Nucleic Acids Res. 2013;41:4378–91. doi: 10.1093/nar/gkt111. [DOI] [PMC free article] [PubMed] [Google Scholar]
- 116.VIEIRA G, SABARLY V, BOURGUIGNON PY, DUROT M, LE FEVRE F, MORNICO D, VALLENET D, BOUVET O, DENAMUR E, SCHACHTER V, MEDIGUE C. Core and panmetabolism in Escherichia coli. J Bacteriol. 2011;193:1461–72. doi: 10.1128/JB.01192-10. [DOI] [PMC free article] [PubMed] [Google Scholar]
- 117.VIJAYENDRAN C, POLEN T, WENDISCH VF, FRIEHS K, NIEHAUS K, FLASCHEL E. The plasticity of global proteome and genome expression analyzed in closely related W3110 and MG1655 strains of a well-studied model organism, Escherichia coli-K12. J Biotechnol. 2007;128:747–61. doi: 10.1016/j.jbiotec.2006.12.026. [DOI] [PubMed] [Google Scholar]
- 118.WAEGEMAN H, BEAUPREZ J, MOENS H, MAERTENS J, DE MEY M, FOULQUIE-MORENO MR, HEIJNEN JJ, CHARLIER D, SOETAERT W. Effect of iclR and arcA knockouts on biomass formation and metabolic fluxes in Escherichia coli K12 and its implications on understanding the metabolism of Escherichia coli BL21 (DE3) BMC Microbiol. 2011;11:70. doi: 10.1186/1471-2180-11-70. [DOI] [PMC free article] [PubMed] [Google Scholar]
- 119.WAKSMAN S. Microbial Antagonisms and Antibiotic Substances. New York: The Commonwealth Fund; 1945. [Google Scholar]
- 120.WIMAN M, BERTANI G, KELLY B, SASAKI I. Genetic map of Escherichia coli strain C. Mol Gen Genet. 1970;107:1–31. doi: 10.1007/BF00433220. [DOI] [PubMed] [Google Scholar]
- 121.YOON SH, HAN MJ, JEONG H, LEE CH, XIA XX, LEE DH, SHIM JH, LEE SY, OH TK, KIM JF. Comparative multi-omics systems analysis of Escherichia coli strains B and K-12. Genome Biol. 2012;13:R37. doi: 10.1186/gb-2012-13-5-r37. [DOI] [PMC free article] [PubMed] [Google Scholar]
- 122.YURA T, MORI H, NAGAI H, NAGATA T, ISHIHAMA A, FUJITA N, ISONO K, MIZOBUCHI K, NAKATA A. Systematic sequencing of the Escherichia coli genome: analysis of the 0–2.4 min region. Nucleic Acids Res. 1992;20:3305–8. doi: 10.1093/nar/20.13.3305. [DOI] [PMC free article] [PubMed] [Google Scholar]
- 123.ZHANG X, JANTAMA K, MOORE JC, JARBOE LR, SHANMUGAM KT, INGRAM LO. Metabolic evolution of energy-conserving pathways for succinate production in Escherichia coli. Proc Natl Acad Sci U S A. 2009a;106:20180–5. doi: 10.1073/pnas.0905396106. [DOI] [PMC free article] [PubMed] [Google Scholar]
- 124.ZHANG X, JANTAMA K, SHANMUGAM KT, INGRAM LO. Reengineering Escherichia coli for Succinate Production in Mineral Salts Medium. Appl Environ Microbiol. 2009b;75:7807–13. doi: 10.1128/AEM.01758-09. [DOI] [PMC free article] [PubMed] [Google Scholar]
- 125.ZHU J, SHIMIZU K. The effect of pfl gene knockout on the metabolism for optically pure D-lactate production by Escherichia coli. Appl Microbiol Biotechnol. 2004;64:367–75. doi: 10.1007/s00253-003-1499-9. [DOI] [PubMed] [Google Scholar]
Associated Data
This section collects any data citations, data availability statements, or supplementary materials included in this article.