Abstract
A strip-line and waveform sampling based readout is a signal multiplexing method that can efficiently reduce the readout channels while fully exploiting the fast time characteristics of photo-detectors such as the SiPM. We have applied this readout method for SiPM-based time-of-flight (TOF) positron emission tomography (PET) detectors. We have prototyped strip-line boards in which 8 SiPMs (pitch 5.2 mm) are connected by using a single strip-line, and the signals appearing at the ends of the strip-line are acquired by using the DRS4 waveform sampler at a nominal sampling frequency of 1–5 GS/s. Experimental tests using laser and LYSO scintillator are carried out to assess the performance of the strip-line board. Each SiPM position, which is inferred from the arrival time difference of the two signals at the ends of the strip-line, is well identified with 2.6 mm FWHM resolution when the SiPMs are coupled to LYSO crystals and irradiated by a 22Na source. The average energy and coincidence time resolution responding to 511 keV photons are measured to be ~32% and ~510 ps FWHM, respectively, at a 5.0 GS/s DRS4 sampling rate. The results show that the sampling rate can be lowered to 1.5 GS/s without performance degradation. These encouraging initial test results indicate that the strip-line and waveform sampling readout method is applicable for SiPM-based TOF PET development.
Keywords: Positron Emission Tomography, Strip-Line Readout, Waveform Sampling, Multiplexing
1. Introduction
The silicon photo-multiplier (SiPM) [1–4] is an attractive photo-sensor for developing time-of-flight Positron Emission Tomography (TOF PET) scanner. It is considered a substitute for the vacuum-based photo-multiplier tube (PMT). Its advantageous features include high electrical gain comparable to the conventional PMT, fast time response, and in-sensitiveness to magnetic fields. In addition, the compact size of SiPMs makes it possible to couple scintillators to photo-detectors individually, therefore allowing flexible detector designs to achieve high spatial resolution or to increase the sensitivity [5]. On the other hand, SiPMs show a high dark count rate (~1 MHz/mm2) and are sensitive to temperature and voltage variations [6, 7]. Since the typical effective area of the SiPMs currently available in the market is ~1×1 – 6×6 mm2, a clinical PET scanner can use several thousands or more SiPMs. The signal readout of such a large number of SiPMs would be a challenge; for example, our brain PET design [8], with a diameter of 240 mm and an axial field-of-view (FOV) of 40 mm, requires 1152 SiPMs, assuming each SiPM pixel is 5×5 mm2 in size.
The charge division resistor network is a popular multiplexing readout method for SiPMs. In this method, outputs of SiPMs in an array, e.g., 4×4 or 8×8, are interconnected with resistors, and the position of the signal initiating SiPM in the array is calculated from the relative amount of charges measured at 4 corners of the resistor network. Although this method could achieve a large multiplexing ratio, the large capacitance of a SiPM coupled to resistors causes a long rise time of the output signal; therefore, it is not adequate for TOF PET applications. However, the method is commonly adopted by small animal PET systems because they do not need TOF ability. Some implementations based on the method have been reported in [9–12], and a comprehensive review on signal multiplexing for SiPMs is found in [13].
We have developed a signal multiplexing method based on strip-line readout that can keep the fast time characteristic of the SiPM. Initially, we developed the method to efficiently handle signals from large area micro-channel plate PMTs [14, 15]. In this approach, the micro-channel plate PMT signals are collected by anode strips placed in parallel across the photo-detector area. The signals on the strip-line propagate to both ends of the strip, and are digitized by using a high speed waveform sampler, e.g., a Domino Ring Sampler (DRS) [16]. The event information, including the energy and time of the gamma interaction, are obtained by processing the digitized waveform, and the position of the interaction is inferred from the difference in time when the signals arrive at the ends of the strip-line (called the differential time, or dT, below). This method is applicable to SiPM as well; therefore, we have prototyped strip-line boards for SiPMs and demonstrated the feasibility of the strip-line readout in a previous paper [17, 18]. Based on these early experiences, we have built second-generation strip-line boards intended for our brain PET system development. Another important feature of our readout is the use of waveform sampling [19] to ensure precise time measurement and fully exploit the fast time characteristics of the SiPMs. Using the DRS4 chip, we have developed a PDRS4 waveform sampling board [20] that provides a high channel density, an adjustable sampling rate, and adequate memory depth for PET applications. Experimental tests have been carried out using pulsed laser and Lutetium-Yttrium OxyorthoSilicate (LYSO) scintillator to characterize the performance of this strip-line and waveform sampling readout. The sampling rate of the DRS4 was varied to assess how the sampling rate affects the detector performance.
The remainder of this paper is organized as follows. In section 2, we explain the development of the strip-line board and PDRS4 waveform sampling board. The experimental test setup is also described. The test results using laser and LYSO scintillator are presented in section 3. Discussion and summary are given in section 4 and section 5, respectively.
2. Materials and Methods
2.1. Strip-line Boards
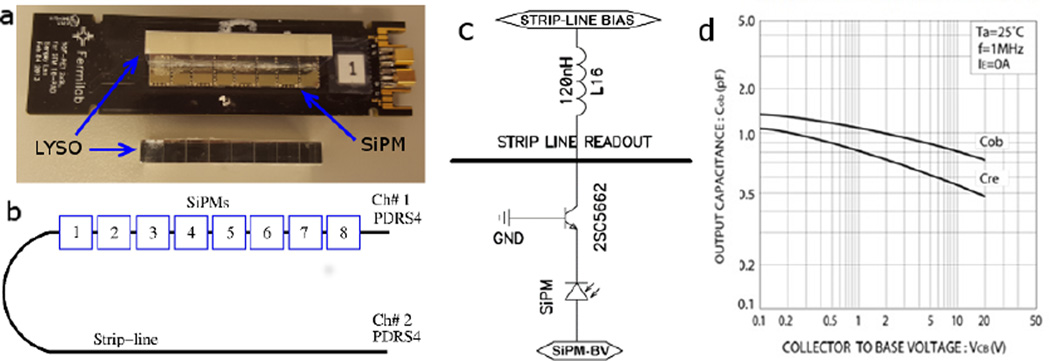
The strip-line board (SLB) has four strip-lines laid out in 8×3 cm2 FR4 substrate, and eight SiPMs in a row are connected by a strip-line. Currently, only two strip-lines in each board are installed with 16 (8 SiPMs on each strip-line) SPM42-75 SiPMs (STM, Italy) [21, 22]. Each SiPM has 3342 micro-pixels in a 4.0×4.4 mm2 active area with a 54% fill factor. The pitch between SiPMs is 5.2 mm. All SiPMs on the board are biased to the same voltage of −31.5 V. The nominal breakdown voltage of the SiPMs is about −28 V. Figure 1(a) shows a photo of the strip-line board in which the SiPMs on the top row are individually coupled to LYSO crystals. Figure 1(b) depicts SiPM numbering on a strip-line and PDRS4 readout channel assignment adopted in this paper. To decouple the capacitance of the SiPM and hence maintain the fast timing characteristics [23], a common base buffer transistor (2SC5662, ROHM Semiconductor) is used between the SiPM and strip-line as depicted in Figure 1(c). With this decoupling scheme, the low input impedance of a common base buffer minimizes response time of the SiPM, while low capacitance and high impedance of the output minimizes strip-line performance degradation and provides separation between SiPMs on a strip-line. The details of the circuit implementation of the board are described in [17]. In this study, two strip-line boards are used. One is configured with a 0.6 V strip-line bias (SLB#2), while the other uses a 0 V (SLB#1). The idea is to see whether the simplified biasing (0 V) can perform as well as the other. The use of different biases result in different transistor output capacitances (Figure 1(d)); therefore, the SiPM signals on the two SLBs will show different amplitude and rise time behaviors. When using the leading-edge discrimination with a fixed threshold for time measurement, the different signal shapes will result in an apparent difference in the signal propagation time on the strip-line board.
Figure 1.
(a) A strip-line board (SLB#1). A linear array of eight LYSO scintillators is coupled to 8 SiPMs on a strip-line on the board. (b) The numbering of SiPMs on a strip-line and PDRS4 readout channel assignment. (c) A schematic diagram shows the biasing scheme for a buffer transistor (ROHM 2SC5662). Two strip-line boards are used in this work and the strip-line bias is 0 V for SLB#1 and 0.6 V for SLB#2. (d) The output capacitance vs. bias voltage for the 2SC5662 transistor across the collector and base [24].
2.2. Waveform Sampling by PDRS4
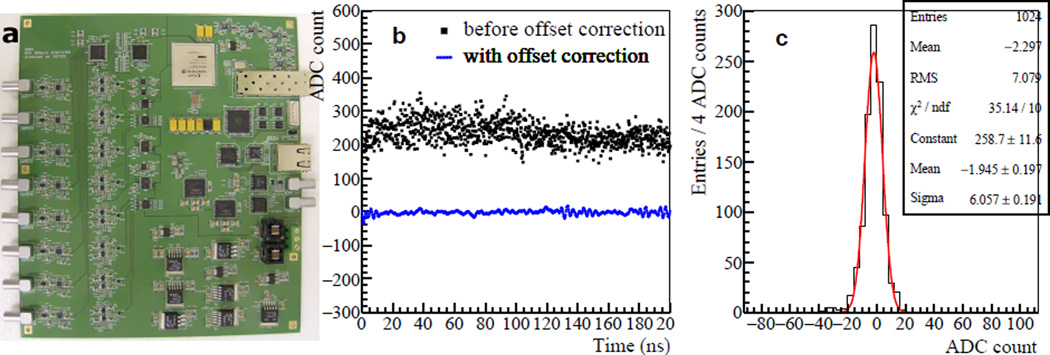
The waveforms of the strip-line board signals are acquired by using the PDRS4 board [20] developed by us and NOTICE. The PDRS4 board, shown in Figure 2(a), uses a DRS4 sampling chip [16], which is based on switched capacitor array technology. The board provides 8 input channels, each having a 1024 buffer depth, and the nominal sampling rate is adjustable between 0.7 – 5.0 giga-samples per second (GS/s). In the PDRS4 board, the capacitor voltages of the DRS4 are digitized by using a 12 bit octal Analog to Digital Converter (ADC) (AD9222, Analog Devices), and the digitized waveforms can be transferred through 100 Base-T Ethernet or a small form-factor pluggable transceiver to a data acquisition computer. The ground levels of the 8 input channels of the PDRS4 are adjustable by setting a 12 bit Digital to Analog Converter (DAC) (TLV5630IPW, Texas Instruments); in this work, the DAC values of all channels are set to 500 because the SiPM output signals have a positive polarity. The amplitude offset and gain variation of the 1024 capacitor cells in the DRS4 chip are measured by acquiring data with DC input signals, as described in [20]. Figure 2(b) shows a PDRS4 waveform of the DC input before and after the offset of each capacitor cell in the DRS4 is corrected by using the measured value. From the waveform after the offset correction, the PDRS4 noise level is measured to be ~6.1 ADC counts, shown in Figure 2(c), which is equivalent to ~1.5 mV [20]. The sampling interval between adjacent DRS4 sampled points is not uniform and needs to be measured individually for precise time measurement. The non-uniform sampling intervals of the DRS4 are determined by applying a newly developed time calibration method [25] that yields a measured electronic time resolution of ~5 ps RMS.
Figure 2.
(a) PDSR4 waveform sampling board. (b) A PDRS4 waveform with a DC input before/after offset correction. (c) ADC count histogram of 1024 sampled points after offset correction.
2.3. Experimental Setup
Two experimental tests are carried out for the strip-line board by using either laser and LYSO scintillators. First, the relative electrical gain of SiPMs on the strip-line are measured in a laser test bench. A pulsed laser beam generated by PIL040 (PiLas, Germany), with a 45 ps pulse width and a 405 nm wavelength, is injected to SiPMs through an optical fiber with a 0.2 mm core diameter (ST-U200D-FV, Mitsubish). The tip of the optical fiber, which is mounted on a translational stage (Velmex BiSlide MN-10), is kept 1 mm above the SiPM surface to avoid light spreading into adjacent SiPMs. The horizontal position of the fiber tip is moved along SiPMs on the strip-line in 1 mm steps. At each position, 1000 laser injections are performed and for each injection the waveforms at the two ends of the strip-line are acquired by using the PDRS4. The data are collected at a total of 48 positions scanning through the 8 SiPMs on the strip-line. During the scan, the laser intensity is fixed; therefore, the relative gains of the SiPMs can be calculated from the resulting amplitude profile. In addition to the relative gain, the electronic time resolution of the strip-line and PDRS4 is also measured from the data using the pulsed laser.
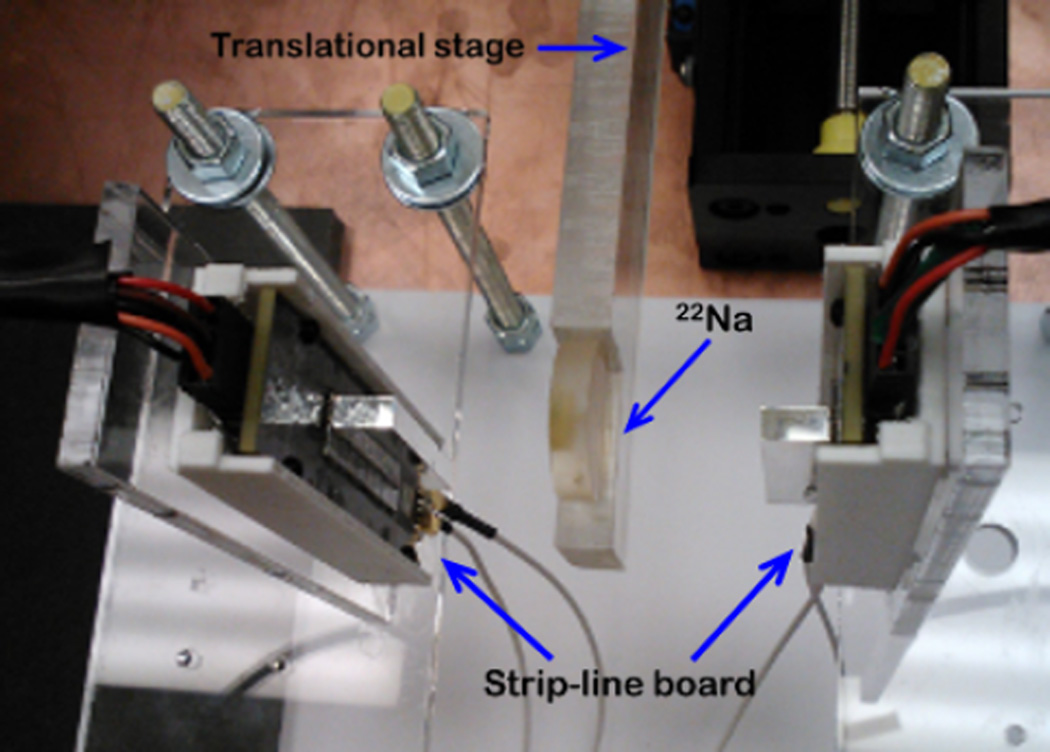
Figure 3 shows the setup for the 2nd experimental test. The SiPMs of one strip-line on a SLB are optically coupled to LYSO arrays by using optical gel. Each LYSO array consists of eight LYSO scintillators (Proteus Inc.) of 5×5×10 mm3 in a row and have a pitch of 5.2 mm so that SiPMs on the strip-line match LYSO scintillators individually, as shown in Figure 1(a). The outputs of the LYSO-mounted strip-line of SLB#1 (SLB#2) are connected to input channels #1 and #2 (#3 and #4) of the PDRS4 board. The distance between the two LYSO arrays is kept at 60 mm, and a 22Na positron source, with a 3µCi activity in a 1 mm diameter sphere, is placed at the middle of two strip-line boards. Since each strip-line board has 8 LYSO+SiPMs, there are a total of 64 possibilities for coincidence detection. In order to have coincidence events for all the 64 possible combinations, the position of 22Na source is moved in 1 mm steps along the middle of the two detectors by the translation stage. At each position, 5000 coincidence events are collected, and a total of 190K coincidence events are acquired at 38 positions. The trigger for data acquisition uses the discriminators on the PDRS4 board; the triggering threshold is set to 20 mV, which amounts to ~400 ADC counts.
Figure 3.
The coincidence test setup using two SLBs coupled with LYSO arrays. A 22Na source sitting on a translational stage is positioned at the middle of two SLBs.
In order to measure the detector performance dependence on the waveform sampling rate, both experimental tests described above are repeated at 9 different PDRS4 sampling rates from 1.0 to 5.0 GS/s. Calibrations for the offset and gain as described in the previous section are separately performed for each sampling rate.
2.4. Waveform Signal Processing
The sampled waveforms are processed as described below to extract the event time and energy.
The individual offsets and gains of the DRS4 capacitor cells are corrected by using the measured data as described in section 2.2.
The base-line shift of the strip-line signal is corrected using the first 100 samples in each waveform: the average of the 100 samples is subtracted from all 1024 samples.
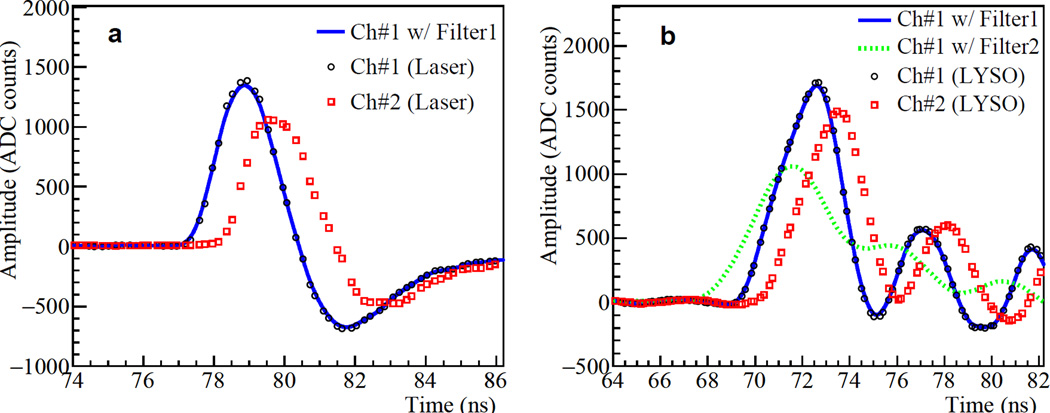
The calibrated sampling intervals of the 1024 capacitor cells of the DRS4, which are determined from the time calibration method as described in section 2.2, are used to reconstruct the waveform. Figure 4 shows examples of the sampled waveform after the above corrections.
The waveform is up-sampled to have a uniform sampling interval of 5 ps by using cubic spline interpolation implemented in the GNU scientific library [26]. A moving average filter is then applied to suppress the noise. The width of the moving filter is set to 0.5 ns (filter1) or 5.0 ns (filter2); these widths are chosen in order to obtain better timing performance for the test results with laser and LYSO, respectively. The waveforms after applying the filters are indicated by the solid (filter1) and dotted (filter2) lines, respectively, in Figure 4. Because of its larger width, filter2 produces a smoother waveform than filter1; however, as it will be shown below, it leads to a better timing result for the second experimental test.
To determine the start time of the signal, the leading-edge discrimination (LED) method is applied to the filtered waveforms: the time at which the signal amplitude equals the discrimination threshold is calculated from the time of the two samples on the leading edges that are closest to the threshold by using linear interpolation. The difference in this calculated start time of the two waveforms acquired at two ends of the strip-line, which will be referred to as the strip-line differential time below or simply the differential time (dT) for short, is related to the position of the SiPM on the strip-line. On the other hand, the average time is the event time of the gamma-ray hit on the strip-line board. The coincidence differential time is the difference between the event time of two gamma-ray hits, one on each SLB.
The event energy is estimated by integrating the area under the waveform before applying the moving average filters. In an attempt to improve timing performance, at the outputs of the strip-line board the signal is shaped by using a 30 pF series capacitor, which leads to a short shaping constant of 1.5 ns [27]. As a result, an undershoot is observed for the pulse measured for laser, and oscillations are observed in the waveform obtained with LYSO scintillator (which has a ~40 ns decay time that is much longer than the shaping time constant). Because of the oscillations, the event energy is calculated by using only the first peak of the waveform, with 5–6 ns width at base-line; summation of the waveform amplitudes is carried out until the first zero-crossing point is reached. The two energies thus obtained from the two waveforms at the ends of the strip-line are then averaged to yield the energy for the event.
Figure 4.
(a) PDRS4 waveforms on a strip-line (SLB#1) obtained in the first experimental test by using a laser. (b) PDRS4 waveforms on the same strip-line when it is coupled to LYSOs. For both (a) and (b), the waveforms (Ch#1 only) obtained by applying moving average filters are superimposed on the original waveforms. The sampling rate of PDRS4 is 5.0 GS/s.
3. Results
3.1. Results of the first experimental test using laser
3.1.1. Relative Gain of SiPMs
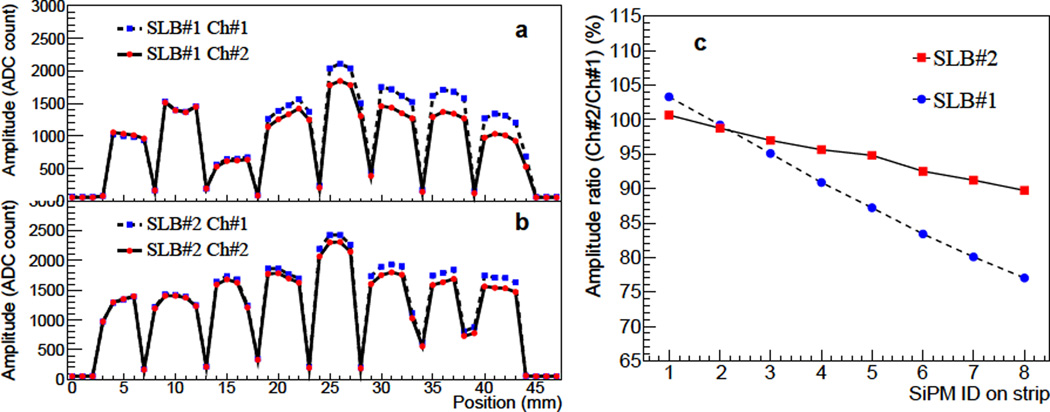
The relative gain of SiPMs on the strip-lines are measured from the data acquired by moving a pulsed laser light along the surface of the SiPMs. Figures 5(a) and 5(b) show the signal amplitude profile of strip-lines in SLB#1 and SLB#2, respectively. Each point in the profile is the mean of 1000 repeated measurements obtained at one laser position. On the profile, the peaks and valleys manifest the positions of the SiPMs (5.2 mm pitch), and the amplitudes of the peaks reflect the relative electrical gains of the SiPMs. The large gain variation between the SiPMs observed in the profile is mainly due to the breakdown voltage variation within SiPMs [17]. Since each strip-line has two outputs, two amplitude profiles are shown in the figure for each strip-line. Although our readout method exploits the strong correlation in shape and amplitude of the two waveforms appearing at the ends of a strip-line, the measured amplitudes can be different depending on the initiation position on the strip-line. This is more evident in the amplitude ratio shown in Figure 5(c) in which the 3 largest amplitudes at each peak are averaged to obtain the amplitude for the corresponding SiPM. This plot shows that, compared to the signal amplitude at Ch#1, the signal amplitude at Ch#2 is initially approximately identical for SiPM#1 and then continually decreases toward SiPM#8. This trend is related to the strip-line layout on the board shown in Figure 1(b): the signal path lengths to the PDRS4 inputs are similar for SiPM#1, which is close to the middle of the strip-line, but for SiPM#8 the path to Ch#2 is longer than that to Ch#1 and hence the signal at Ch#2 is attenuated more.
Figure 5.
The amplitude profiles along strip-lines of SLB#1 (a) and SLB#2 (b) obtained by a scanning laser beam. The relative gains of the SiPMs are manifested in the relative amplitude at the peaks. (c) The amplitude ratio (Ch#2/Ch#1) obtained for SiPMs on a strip-line. See Figure 1(b) for the assignment of the SiPM ID and output channel number.
3.1.2. Rise Time Measurement
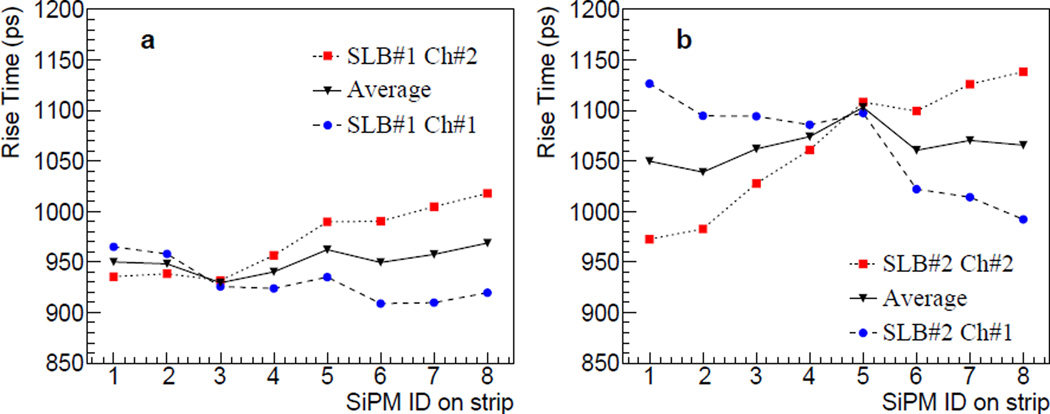
The rise time of the signals is also found to change along the strip-line. The measured rise time, which is defined as the time lapse from 10% to 90% of the peak amplitude on the rising edge of the signal, at each SiPM position is shown in Figures 6(a) and 6(b) for SLB#1 and SLB#2, respectively. The rise time is calculated before applying the moving average filters. With reference to the configuration shown in Figure 1(b), the result in Figure 6 indicates that generally speaking the rise time decreases (increases) from SiPM#1 to SiPM#8 for Ch#1 (CH#2), which indicates that, as expected, the rise time increases when the signal needs to travel a longer path. However, unlike the approximately linear dependence of the amplitude ratio with the SiPM ID (i.e., the SiPM position on the strip-line), the dependence of the rise time is more varied. For example, the rise time at the SiPM#5 in Figure 6(b) is larger than the value expected from the linear increase.
Figure 6.
The signal rise time (10% to 90%) along the strip-line measured for SLB#1 (a) and SLB#2 (b).
3.1.3. Differential Time Measurement
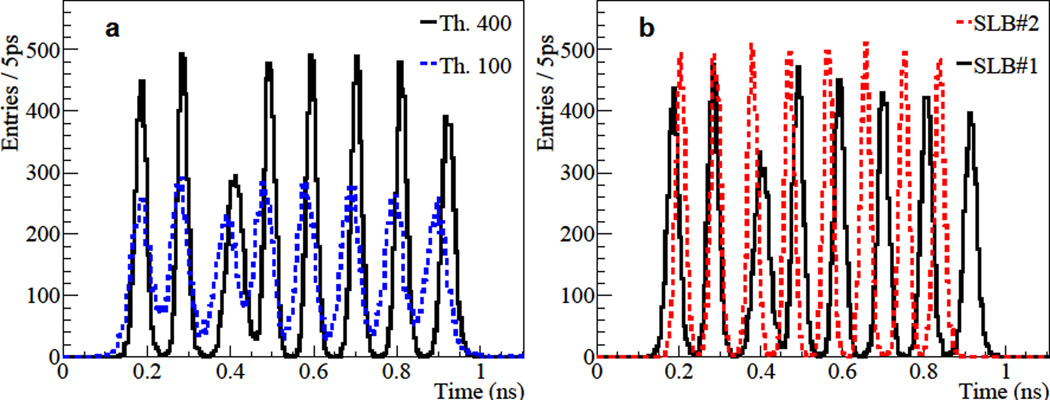
The differential time (dT) on the strip-line is determined from the arrival time difference of the two waveforms propagating oppositely on a strip-line: TPDRS Ch#2 − TPDRS Ch#1. Figure 7(a) shows differential time histograms of SLB#1 acquired by using two LED thresholds: 100 and 400 ADC counts. The data are acquired at a 5.0 GS/s sampling rate. The peaks in these histograms represent the position of the SiPMs along the strip-line. The separation of the peaks, and hence the discrimination of the SiPMs, depends on the applied LED threshold. The histogramobtained by using the 400 ADC-count threshold shows lower valleys than the one obtained by using the 100 ADC-count threshold. The separation between peaks is also smaller when the lower threshold is used. This is due to the signal rise time changing on the strip-line. Figure 7(b) shows the dT histograms for the strip-lines of SLB#1 and SLB#2 by using the same LED threshold (300 ADC counts). The FWHM of each peak in the histogram is calculated, and we obtain a range of 20–41 ps FWHM for SLB#1 and a range of 27–29 ps for SLB#2. The variation in the FWHM reflects the gain variation between SiPMs: for example, the third peak in the dT histogram for SLB#1 has the largest FWHM among the peaks of the board and in Figure 5(a) the corresponding SiPM also has the smallest gain. The results also suggests that the signal propagation speed on strip-line is slower in SLB#1 than in SLB#2; we postulate that this difference can be attributed to the different strip-line bias used.
Figure 7.
(a) Differential time (dT) histograms measured on a strip-line of SLB#1 with two LED thresholds. (b) dT histograms measured for SLB#1 and SLB#2 by using the same LED threshold (300 ADC counts)
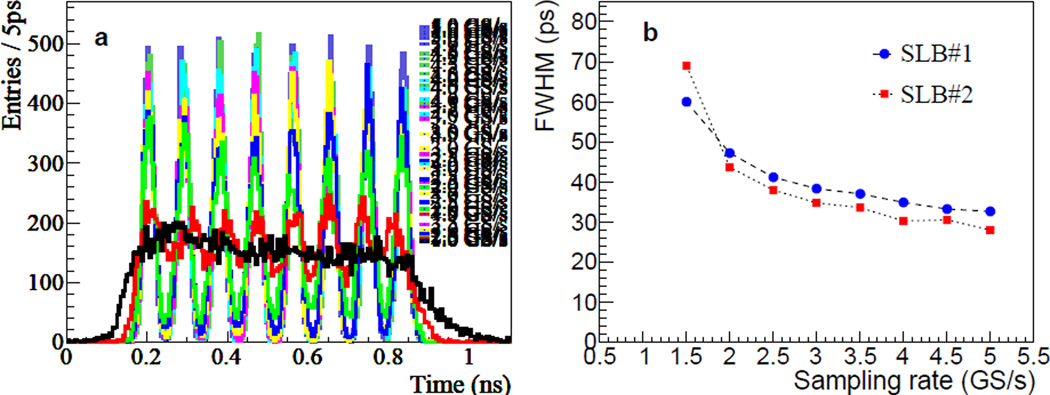
The differential time on the strip-line is also measured by varying the sampling rate of the DRS4. Figure 8(a) shows the dT histograms obtained for SLB#1 at 9 different sampling rates from 1.0 to 5.0 GS/s. The LED threshold is fixed to 300 ADC counts. The average FWHM of the 8 peaks in the dT histogram measured at each sampling rate for both SLB#1 and SLB#2 are plotted in Figure 8(b). As no peak can be clearly identified in the 1.0 GS/s case, its average FHWM is not calculated or included in the plot. The averaged FWHM at 1.5 GS/s is calculated using the results at the peaks which give FWHM in the dT histogram. The result shows that the average of the FWHMs of the peaks in the dT histogram (below it is called dT FWHM for short) gradually decreases as the sampling rate increases. Also, it is noted that the dT resolution of 32 (28) ps FWHM obtained at 5.0 GS/s for SLB#1 (SLB#2) is equivalent to a 1.6 mm FWHM positioning uncertainty along the strip-line; the conversion from dT to distance is based on the average separation of the peaks in dT and the known 5.2 mm pitch of the SiPMs.
Figure 8.
(a) dT histograms measured for SLB#1 by varying the DRS4 sampling rate. (b) The averaged FWHM of the peaks in the dT histogram as a function of DRS4 sampling rate. (The reader is referred to the web version of this paper that shows the plot in (a) more clearly in color.)
3.2. Results of the second experimental test using LYSO
In the analysis, firstly the position of the SiPM + LYSO with which 511 keV photon interacts is determined from the dT on the strip-line. Then the energy spectra for all the SiPMs on the strip-line are obtained separately based on the position identified using dT. Using the energy spectra, the 511 keV photo-peak events are identified, and coincidence time resolutions are measured by using only the photo-peak events. The test results are presented following the order as in data analysis.
3.2.1. Differential Time Measurement
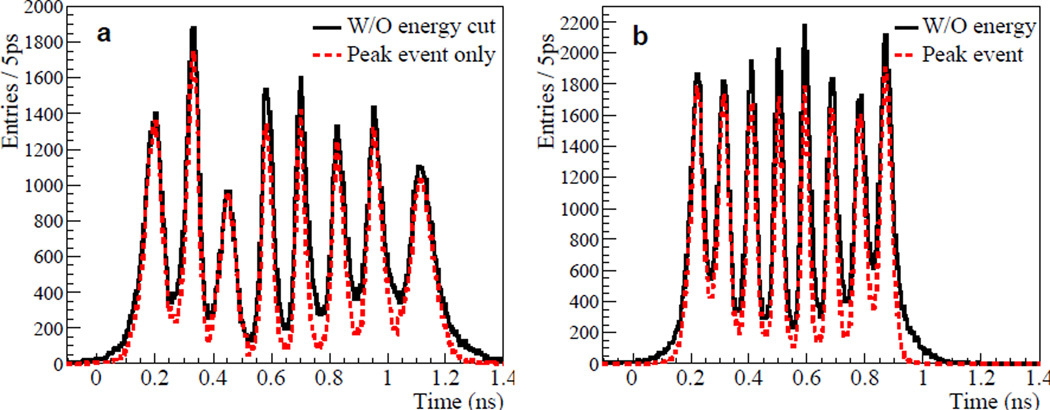
Figures 9(a) and 9(b) show the dT histograms measured with individually coupled LYSO scintillators and a 22Na source for SLB#1 and SLB#2, respectively, at 5.0 GS/s sampling rate and by using an LED threshold of 350 ADC count. As described above in Section 2.4, a stronger smoothing (filter2) is applied to the LYSO+SiPM pulse, and so in comparison with the first experiment that uses a laser beam, the rise time becomes longer. Specifically, the average rise time is measured to be 2.0±0.5 ns (1.9 ns for SLB#1, 2.1 ns for SLB#2, and 0.5 ns is RMS). Consequently, the overall time scale in the dT histograms in Figure 9 is expanded with respect to that in Figure 7. In comparison to Figure 7 that is obtained by using the laser, the separation between SiPMs at valleys is not as clear. One possible reason for this degradation is the size mismatch between LYSO and SiPM: the SiPM shape is not exactly symmetrical (active area 4.0×4.4 mm2), and therefore the SiPMs on a strip-line are installed by alternating their orientations. Second, the optical gel between SiPM and LYSO may causes spreading of light at SiPM boundaries into adjacent SiPMs. The locations and FWHMs of the peaks in the dT histograms in Figure 9 are summarized in Table 1. The average dT FWHM is 64 ps and 45 ps for SLB#1 and SLB#2, respectively, and they correspond to 2.6 mm and 2.5 mm position resolution. Figure 9 also shows the dT histograms by using only 511 keV photo-peak events, showing improved peak separation at the valleys. In particular, the average peak/valley ratio for SLB#1 is increased to 11.5 from 5.4 by using only the photo-peak events. Although the dT histogram is degraded with respect to the laser result, with the large peak/valley ratio, the LYSO+SiPM on a strip-line can still be well discriminated.
Figure 9.
dT histograms on strip-line measured for SLB#1 (a) and SLB#2 (b). The histograms using only 511 keV photo-peak events are plotted in dashed lines, and large entry reduction at the valleys is manifested in the histograms with the photo-peak events only. The DRS4 sampling rate is set to 5.0 GS/s.
Table 1.
Locations and FWHMs of the peaks in the dT histograms shown in Figure 9. The position resolution on strip-line, δx, is calculated from dT FWHM.
| SLB#1 | SLB#2 | |||||
|---|---|---|---|---|---|---|
| SiPM ID | peak (ps) | FWHM (ps) | δx (mm) | peak (ps) | FWHM (ps) | δx (mm) |
| 1 | 203 | 75 | 3.0 | 222 | 55 | 3.1 |
| 2 | 333 | 50 | 2.0 | 313 | 49 | 2.7 |
| 3 | 448 | 68 | 2.8 | 408 | 40 | 2.3 |
| 4 | 583 | 46 | 1.8 | 502 | 38 | 2.1 |
| 5 | 702 | 47 | 1.9 | 593 | 36 | 2.0 |
| 6 | 827 | 60 | 2.4 | 688 | 43 | 2.4 |
| 7 | 952 | 65 | 2.6 | 787 | 50 | 2.8 |
| 8 | 1107 | 98 | 4.0 | 873 | 51 | 2.9 |
| Average | 64 | 2.6 | 45 | 2.5 | ||
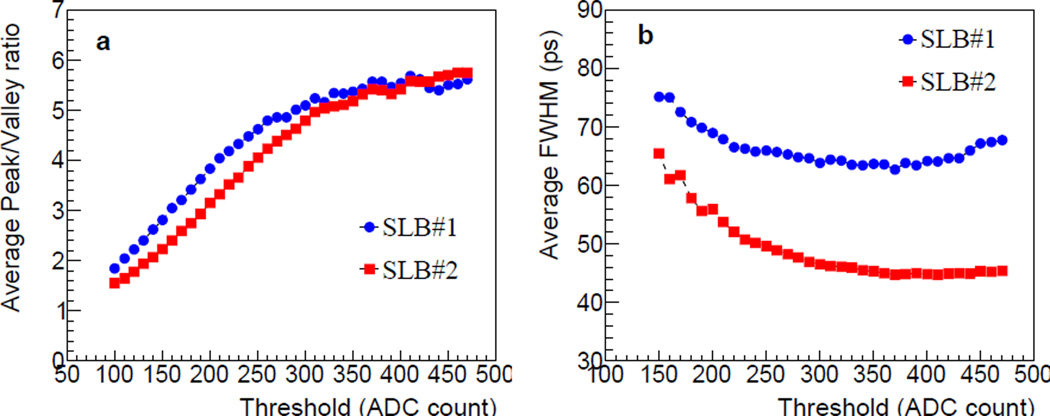
Figure 10(a) shows the average peak/valley ratio of the 8 peaks in dT histogram when different LED thresholds are applied to the same data in Figure 9, calculated without applying energy qualification (that is, by using the solid-line histograms in Figure 9). The optimal LED threshold is determined based on the peak/valley ratio. For both strip-lines, the peak/valley ratio approaches a plateau of ~5.5 at around 350 ADC counts, and this threshold is used for data measured at other sampling rates as well. Figure 10(b) shows the dependence of the average dT FWHM on the applied LED threshold. As previously shown in Figure 7, as the threshold increases the range of dT increases and so does the FWHM: above the threshold of 380 ADC counts, the average dT FWHM for SLB#1 increases with the LED threshold. For this reason, the dT FWHM is not used for determining the optimal LED threshold.
Figure 10.
(a) Peak/valley ratio as a function of the LED threshold. Each data point is the average of 8 peak/valley ratios in a histogram. (b) Average dT FWHM as a function of the LED threshold.
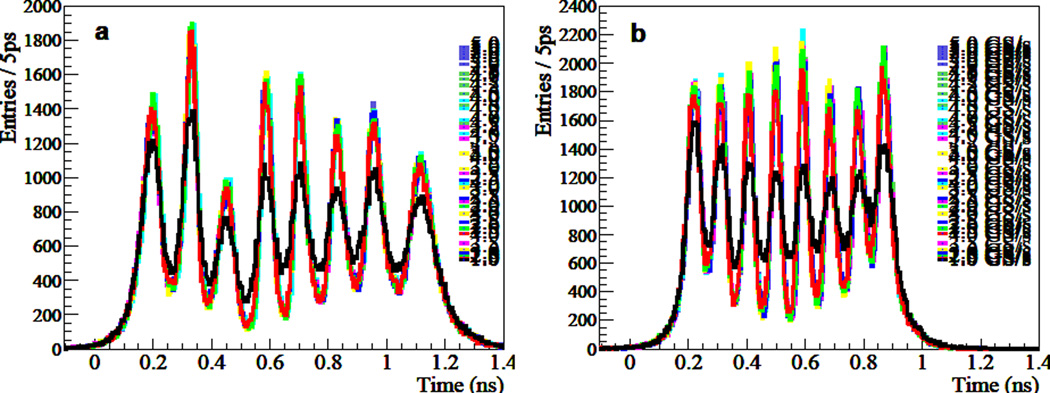
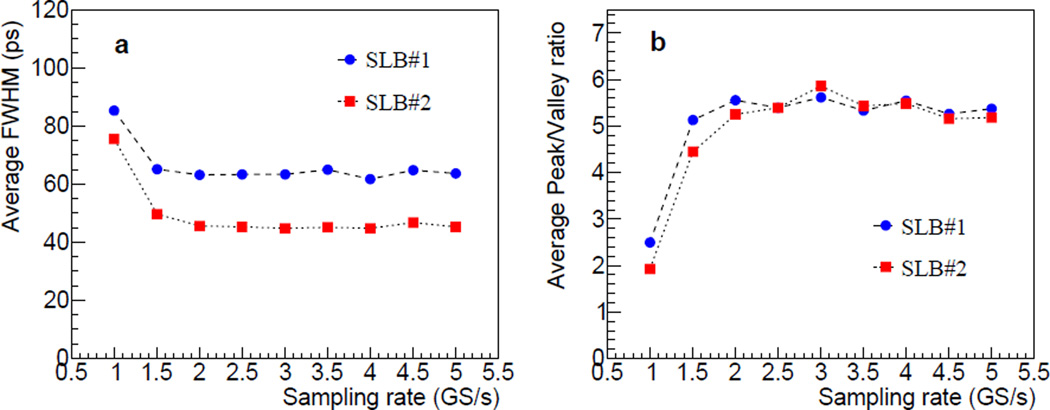
Figure 11 shows the dT histograms obtained at various sampling rates without applying energy qualification. As mentioned above, the LED threshold is set to 350 ADC counts. As shown in the figure, for both strip-line boards, histograms remain quite similar at all sampling rates except for the 1.0 GS/s case. Figure 12(a) shows that the average dT FWHM is ~65 ps and 46 ps for SLB#1 and SLB#2, respectively, for sampling rates between 1.5 to 5.0 GS/s. These correspond to a position resolution of ~2.6 mm FWHM on the strip-line for both boards. The averaged peak/valley ratio in Figure 12(b) also shows a similar dependence on the sampling rate as the dT FWHM and a peak/valley ratio of ~5.3 is calculated in the range of 1.5 – 5.0 GS/s sampling rate.
Figure 11.
dT histograms on strip-line measured by varying the DRS4 sampling rate from 1.0 to 5.0 GS/s for SLB#1 (a) and SLB#2 (b). (The reader is referred to the web version of this paper that shows the plots more clearly in color.)
Figure 12.
(a) Average dT FWHM and (b) average peak/valley ratio as a function of the DRS4 sampling rate in the range of 1.0 – 5.0 GS/s.
3.2.2. SiPM Identification (ID) and Energy Spectra
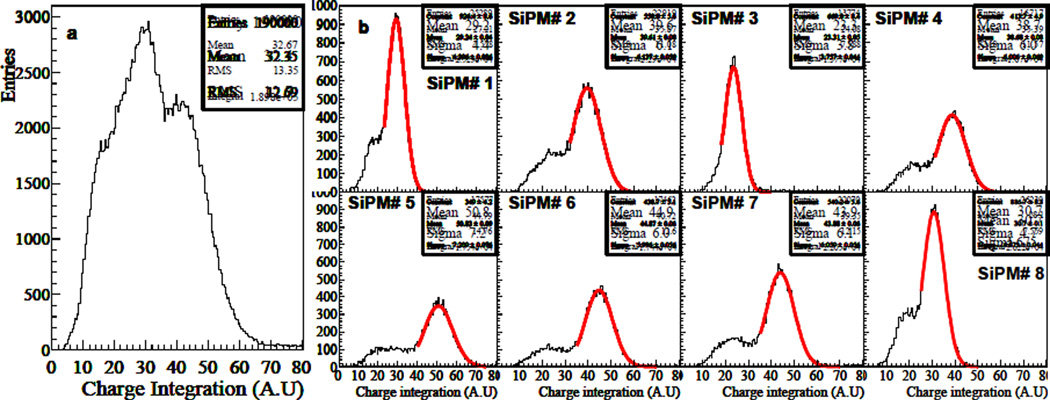
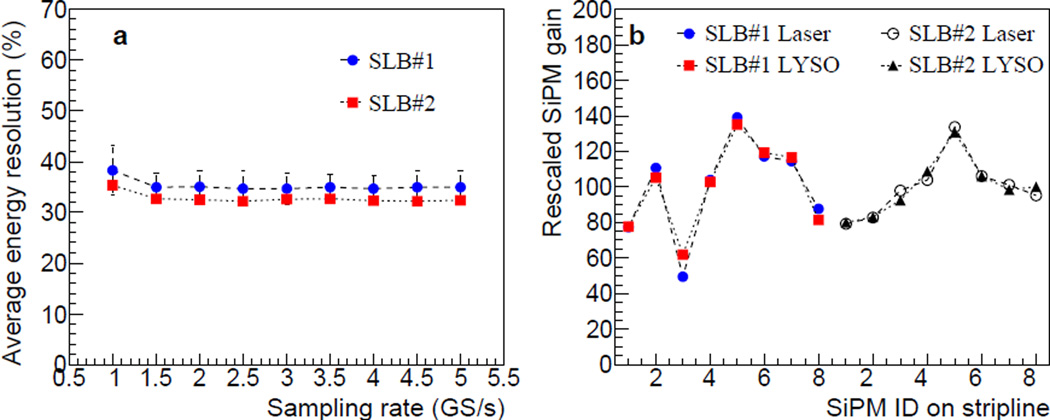
The position of a SiPM, which initiates signal on a strip-line, is identified based on the dT measurement shown in Figure 11. Since the peaks and valleys in the dT histograms obtained at various sampling rates agree quite well, the dT ranges for individual SiPMs derived from the dT histogram obtained at the 5.0 GS/s sampling rate are also used for identifying the SiPMs at other sampling rates. Figure 13 shows the overall energy spectrum and the energy spectra for individual LYSO+SiPM for strip-line in SLB#1 obtained with and without SiPM identification. Due to large gain variation between SiPMs, the energy peaks in Figure 13(b) show significant variations. The energy resolution for each LYSO+SiPM is obtained from a Gaussian fit to the 511 keV peak. Table 2 summarizes the location of the photo-peak and the energy resolution in FWHM for individual LYSO+SiPM, obtained at the 5.0 GS/s sampling rate. Figure 14(a) shows the average energy resolution of 8 SiPMs at various DRS4 sampling rates. The error bars in the figure represent the spread (~3%) in the energy resolution for SLB#1. It is observed that SLB#1 has a slightly worse average energy resolution than SLB#2: 35% and 32%s for SLB#1 and SLB#2, respectively. Since the locations of the peaks in the energy spectra in Figure 13(b) reflect the relative gain of the corresponding SiPMs, we also compare the peak locations to the relative SiPM gains previously measured by using the laser beam, and the result is shown in Figure 14(b). For comparison, the measured results are re-scaled so that the average of the 8 energy peaks equals 100. The agreement between the laser and LYSO+SiPM results suggests that SiPM identification and position decoding using the dT on the strip-line works properly.
Figure 13.
(a) Energy of SLB#1 responding to 511 keV photon. (b) Energy spectra of 8 individual LYSO+SiPMs after the SiPM identification using dT on strip-line. Gaussian fit results on the 511 keV photo-peaks are superimposed on the histograms.
Table 2.
Location of the photo-peak and the energy resolution (FWHM) obtained for individual LYSO+SiPM.
| SLB#1 | SLB#2 | |||||
|---|---|---|---|---|---|---|
| SiPM ID | photo-peak (AU) | FWHM (%) | photo-peak (AU) | FWHM (%) | ||
| 1 | 29 | 35 | 33 | 33 | ||
| 2 | 40 | 36 | 34 | 33 | ||
| 3 | 23 | 38 | 38 | 33 | ||
| 4 | 39 | 37 | 45 | 33 | ||
| 5 | 51 | 33 | 54 | 32 | ||
| 6 | 45 | 31 | 43 | 32 | ||
| 7 | 44 | 33 | 40 | 32 | ||
| 8 | 33 | 36 | 41 | 31 | ||
| Average | 35 | 32 | ||||
Figure 14.
(a) Average energy resolution as a function of the DRS4 sampling rate. (b) The energies corresponding 511 keV peak in each SiPM is compared to the relative SiPM gain shown in Figure 5. The relative SiPM gains are arbitrarily scaled so that the average SiPM gain for each strip-line board equals 100.
3.2.3. Coincidence Time Resolution
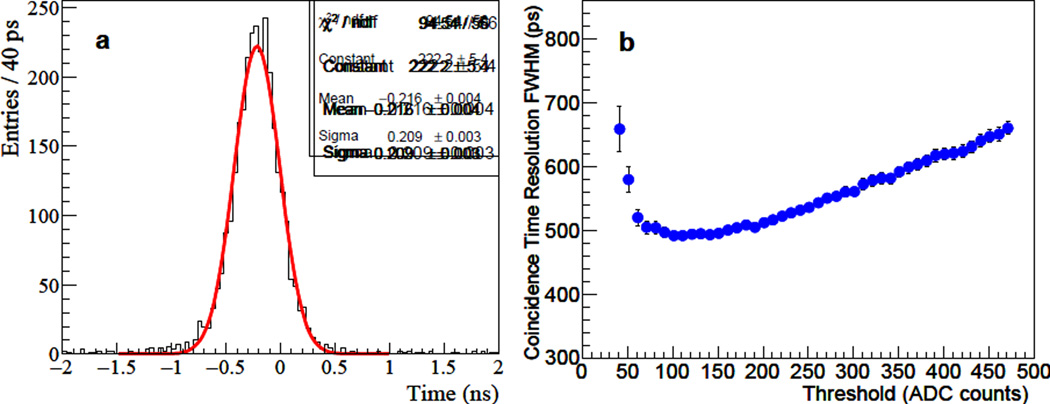
Coincidence time resolution is measured by using only the 511 keV photo-peak events; selected by applying a 300–700 keV energy window after applying energy calibration for each individual LYSO+SiPM based on the location of the photo-peak identified in the individual energy spectrum. For the 5.0 GS/s sampling rate data, ~104K coincidence events remain after applying the photo-peak requirement, and it amounts to 900 – 4400 events for each LYSO+SiPM pair. Figure 15(a) shows the coincidence time histogram obtained for the coincidence pair given by SiPM#7 on SLB#1 and SiPM#8 on SLB#2; this histogram has a ~492 ps FWHM, obtained by using Gaussian fit. Figure 15(b) shows the dependence of the coincidence time resolution on the LED threshold for the same coincidence pair. The best time resolution is obtained when the threshold is set to 100–150 ADC counts; the LED threshold of 100 ADC counts is chosen to obtain the results for all the 64 coincidence pairs.
Figure 15.
(a) Coincidence time histogram measured at a LYSO+SiPM pair: 7th of SLB#1 and 8th of SLB#2. The red curve shows the Gaussian fit to the histogram. (b) The coincidence time resolution of the coincidence pair as a function of the LED threshold.
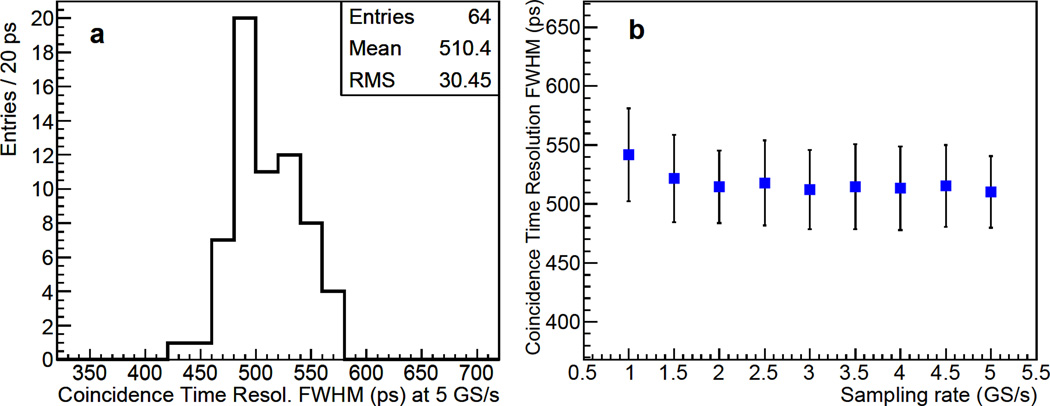
The coincidence time resolutions measured for all 64 coincidence pairs at the 5.0 GS/s sampling rate are summarized in Table 3. Figure 16(a) shows the histogram of the coincidence time resolutions for all the 64 coincidence pairs listed in Table 3; the mean coincidence time resolution is ~510 ps FWHM. The spread in the coincidence time resolution is supposed to be related to the large gain variation between SiPMs. The coincidence time resolution is also measured at different DRS4 sampling rates, and the result is shown in Figure 16(b). In the figure, the average coincidence time resolution of the 64 coincidence pairs is plotted from 1.0 to 5.0 GS/s, and the error bar represents the RMS value of 64 measurements at each sampling rate. The average time resolution is observed to be 510–520 ps FWHM in 1.5 – 5.0 GS/s sampling rate and degrades to 542 ps at 1.0 GS/s.
Table 3.
Coincidence time resolution (FWHM) for all 64 coincidence pairs. The unit of the time resolution is in ps.
| SiPM ID | 1 | 2 | 3 | 4 | 5 | 6 | 7 | 8 |
|---|---|---|---|---|---|---|---|---|
| 1 | 569 | 562 | 529 | 526 | 513 | 540 | 514 | 515 |
| 2 | 535 | 532 | 530 | 498 | 492 | 492 | 534 | 516 |
| 3 | 576 | 544 | 541 | 540 | 549 | 518 | 515 | 549 |
| 4 | 534 | 517 | 480 | 470 | 488 | 480 | 490 | 493 |
| 5 | 513 | 475 | 478 | 492 | 454 | 433 | 462 | 487 |
| 6 | 537 | 531 | 494 | 497 | 480 | 467 | 476 | 480 |
| 7 | 510 | 481 | 484 | 487 | 484 | 479 | 490 | 492 |
| 8 | 560 | 518 | 558 | 532 | 508 | 539 | 541 | 534 |
Figure 16.
(a) Histogram of the coincidence time resolution (FWHM) for the 64 coincidence pairs measured at DRS4 sampling rate 5.0 GS/s. (b) The average coincidence time resolution as a function of DRS4 sampling rate.
4. Discussion
The characteristics of the two strip-line boards are observed to be quite different in terms of the rise time, the amplitude ratio between the two ends of the strip-line, and the propagation speed on the strip-line. We understand that these apparent differences are the results of using different transistor biasing voltages, which was intended to simplify the biasing scheme. Even with the apparent differences, however, the intrinsic performances of the two SLBs does not show any significant difference: the position resolution using dT along the strip-line is measured to be 2.6 mm FWHM for both SLBs. In the dT histogram, the average peak/valley ratio and its sampling rate dependence are also very similar between the SLBs, as seen in Figure 12(b). Since the time between two adjacent SiPMs on the strip-line becomes larger with the slower propagation speed in SLB#1, it was expected to be advantageous in position decoding. Such a favorable effect of the elongated time turns out to be canceled by the proportionally degraded dT time resolution as seen in Figure 12(a).
The laser light is used to assess the electronic time resolution on the strip-line and the intrinsic position resolution accordingly; at 5.0 GS/s sampling rate, the SiPM positions on the strip-line can be identified clearly in the dT, with 1.6 mm FWHM position resolution, as in Figure 7. The result can be compared to the larger position resolution of 2.6 mm with LYSO scintillators. A gradual degradation in the position resolution is found as the sampling rate is reduced, especially below 2.0 GS/s, as shown in Figure 8(b). This could be contrasted to the results for LYSO scintillator, which keep the same performance on position decoding at the lower sampling rate down to 1.5 GS/s, as seen in Figures 11 and 12; even the result at 1.0 GS/s sampling still shows a good separation between SiPMs. The differences in the results with varying sampling rate can be attributed to the rise time differences between the laser and LYSO scintillator: The waveform of LYSO has a larger rise time (~2 ns) than the laser (~1 ns). For LYSO waveforms, the number of sampled points is enough to maintain the time resolution at the sampling rate as low as 1.5 GS/s, where the rising portions of the laser signal do not have enough samples for valid interpolation in the waveform processing.
In this study, we observed that the detector performance does not degrade at DRS4 sampling rates of 1.5 – 5.0 GS/s. The differential time resolution on the strip-line shows the same dependence on the waveform sampling rate. The energy and coincidence time resolution dependence on the sampling rate are consistent with the earlier test results using a single PMT (R9800, Hamamatsu) or SiPM (S10931-050P, Hamamatsu) coupled with LYSO [28], which observed the degradation in the coincidence time resolution below 2.0 GS/s. The improvement in the optimal sampling reduction from 2.0 to 1.5 GS/s is mainly due to the newly developed DRS4 time calibration [25]. Since the digitizing and processing of larger data size from waveform sampling could be an issue for high count rates (> ~30 kHz, constrained by the DRS4 digitization time), the finding in the study has a practical implication: the sampling rate can be lowered to 1.5 GS/s without compromising the detector performance. The waveform processing algorithms used in the study are not optimized, and the parameters have been chosen empirically. Therefore, further reduction of the optimal sampling rate even below 1.5 GS/s may be possible, and will be examined in future work, by developing more sophisticated signal processing algorithms [29] and also by introducing a more precise time calibration at lower sampling rate.
5. Summary
A strip-line and waveform sampling based readout is a signal multiplexing method that can reduce the readout channels efficiently while fully exploiting fast time characteristics of photo-detectors such as the SiPMs. We have applied the readout method for SiPM-based TOF PET detectors, using prototype strip-line boards in which 8 SiPMs (pitch 5.2 mm) are connected in a single strip-line. Experimental tests using laser and LYSO scintillator are carried out to assess the performance. The position of SiPMs, which is inferred from arrival the time difference on the strip-line, is well identified with 2.6 mm FWHM resolution using LYSO. The average energy and coincidence time resolution for 511 keV gammas are measured to be ~32% and ~510 ps FWHM, respectively, at a 5.0 GS/s DRS4 sampling rate. The detector performance is also measured by varying the waveform sampling rate from 1.0 – 5.0 GS/s, and we found that the DRS4 sampling rate can be lowered to 1.5 GS/s without performance degradation. These encouraging initial test results indicate that the strip-line and waveform sampling readout method is applicable for SiPM based TOF PET development.
Acknowledgments
This work was supported in part by the National Institute of Biomedical Imaging and Bioengineering of the National Institute of Health under Grant numbers R01EB016104 and T32 EB002103, the University of Chicago and Fermilab strategic collaboration seed grants, the University of Chicago Institute for Translational Medicine awards, and The Coleman Endowment through The University of Chicago Comprehensive Cancer Center.
Footnotes
Publisher's Disclaimer: This is a PDF file of an unedited manuscript that has been accepted for publication. As a service to our customers we are providing this early version of the manuscript. The manuscript will undergo copyediting, typesetting, and review of the resulting proof before it is published in its final citable form. Please note that during the production process errors may be discovered which could affect the content, and all legal disclaimers that apply to the journal pertain.
References
- 1.Buzhan P, et al. Nucl. Instr. and Meth. 2003;504:48. [Google Scholar]
- 2.Otte AN, Barral J, Dolgoshein B, Hose J, Klemin S, Lorentz E, Mirzoyan R, Popova E, Teshima M. Nucl. Instr. and Meth. 2005;545:705. [Google Scholar]
- 3.Dolgoshein B, et al. Nucl. Instr. and Meth. 2006;563:368. [Google Scholar]
- 4.Renker D. Nucl. Instr. and Meth. 2006;567:48. [Google Scholar]
- 5.Lewellen TK. Phys. Med. Biol. 2008;53:R287. doi: 10.1088/0031-9155/53/17/R01. [DOI] [PMC free article] [PubMed] [Google Scholar]
- 6.Bonanno G, Marano D, Belluso M, Billotta S, Grillo A, Garozzo S, Romeo G, Timparano M. IEEE Sensors Journal. 2014;14:3567. [Google Scholar]
- 7.Dinu N. Silicon Photomultipliers, Photodetectors. 2016:255. [Google Scholar]
- 8.Kim H, et al. IEEE NSS/MIC Conference Record; 2013. [Google Scholar]
- 9.Kolb A, Lorentz E, Judenhofer M, Renker D, Lankes K, Pichler BJ. Phys. Med. Biol. 2010;55:1815. doi: 10.1088/0031-9155/55/7/003. [DOI] [PubMed] [Google Scholar]
- 10.Song TY, Wu H, Komarov S, Siegel S, Tai Y-C. Phys. Med. Biol. 2010;55:2573. doi: 10.1088/0031-9155/55/9/010. [DOI] [PMC free article] [PubMed] [Google Scholar]
- 11.Goertzen A, et al. IEEE Trans. Nucl. Sci. 2013;60:1541. [Google Scholar]
- 12.Stratos D, Maria G, Eleftherios F, George L. Nucl. Instr. and Meth. 2013;702:121. [Google Scholar]
- 13.SensL Application note on readout Methods for arrays of SiPM. http://sensl.com/downloads/ds/TN-Readout_Methods_for_Arrays_of_SiPM.pdf. [Google Scholar]
- 14.Large-Area Picosecond Photo-Detectors Project. http://psec.uchicago.edu. [Google Scholar]
- 15.Kim H, Chen C-T, Frisch H, Tang F, Kao C-M. Nucl. Instr. and Meth. 2012;662:26. doi: 10.1016/j.nima.2011.09.059. [DOI] [PMC free article] [PubMed] [Google Scholar]
- 16.Ritt S, Dinapoli R, Hartmann U. Nucl. Instr. and Meth. 2010;623:486. [Google Scholar]
- 17.Kim H, et al. Nucl. Instr. and Meth. 2015;784:557. doi: 10.1016/j.nima.2014.12.080. [DOI] [PMC free article] [PubMed] [Google Scholar]
- 18.Kim H, et al. IEEE NSS/MIC Conference Record; 2012. p. 2466. [Google Scholar]
- 19.Genat J-F, Varner G, Tang F, Frisch H. Nucl. Instr. and Meth. 2009;607:387. [Google Scholar]
- 20.Kim H, Kao C-M, Kim S, Chen C-T. IEEE NSS/MIC Conference Record; 2011. p. 2393. [Google Scholar]
- 21.Mazzillo M, et al. IEEE Trans. Nucl. Sci. 2010;57:2273. [Google Scholar]
- 22.Mazzillo M, et al. IEEE Trans. Nucl. Sci. 2012;59:3419. [Google Scholar]
- 23.Huizenga J, Seifert S, van Dam HT, Dendooven P, Lohner H, Vinke R, Schaart DR. Nucl. Instr. and Meth. 2012;695:379. doi: 10.1088/0031-9155/57/8/2219. [DOI] [PubMed] [Google Scholar]
- 24.Datasheet of ROHM 2SC5662 transistor. http://rohmfs.rohm.com/en/products/databook/datasheet/discrete/transistor/bipolar/2sc5662t2lpe.pdf. [Google Scholar]
- 25.Kim H, et al. Nucl. Instr. and Meth. 2014;767:67. doi: 10.1016/j.nima.2014.08.025. [DOI] [PMC free article] [PubMed] [Google Scholar]
- 26.GNU Scientific Library. http://www.gnu.org/software/gsl/ [Google Scholar]
- 27.Ronzhin A, et al. Nucl. Instr. and Meth. 2013;703:109. [Google Scholar]
- 28.Kim H, et al. IEEE NSS/MIC Conference Record. 2012:2469. [Google Scholar]
- 29.Joly B, Montarou G, Lecoq J, Bohner G, Cronau M, Brossard M, Vert P. IEEE Trans. Nucl. Sci. 2010;57:63. [Google Scholar]


