Abstract
While gas-filled micrometer-sized ultrasound contrast agents vastly improve signal-to-noise ratios, microbubbles have short circulation lifetimes and poor extravasation from the blood. Previously reported fluorocarbon-based nanoscale contrast agents are more stable but their contrast is generally lower owing to their size and dispersity. The contrast agents reported here are composed of silica nanoparticles of ≈100 nm diameter that are filled with ≈3 nm columnar mesopores. Functionalization of the silica surface with octyl groups and resuspension with Pluronic F127 create particles with pores that remain filled with air but are stable in buffer and serum. Administration of high intensity focused ultrasound (HIFU) allows sensitive imaging of the silica nanoparticles down to 10 10 particles mL −1, with continuous imaging for at least 20 min. Control experiments with different silica particles supported the hypothesis that entrapped air could be pulled into bubble nuclei, which can then in turn act as acoustic scatterers. This process results in very little hemolysis in whole blood, indicating potential for nontoxic blood pool imaging. Finally, the particles are lyophilized and reconstituted or stored in PBS (phosphate-buffered saline, at least for four months) with no loss in contrast, indicating stability to storage and reformulation.
1. Introduction
Ultrasound imaging is a widely used imaging technique owing to its substantial tissue penetration depth, safety, and low cost, combined with a real-time imaging capability that makes it advantageous over other common modalities such as magnetic resonance imaging (MRI), computed tomography (CT), and positron emission tomography (PET). [1–4] To improve the resolution of the ultrasound images, ultrasound contrast agents, such as highly echogenic lipid or protein stabilized microbubbles, are often applied. [5–7] Although the microbubbles can remarkably enhance the signal-to-noise ratio of the ultrasound images, [8–10] their large size (typically between 1 and 5 μm) restricts their extravasation from circulation and accumulation into target tissues. For example, tumors have cut-off sizes between 200 and 800 nm, depending on the tumor type, with smaller particle sizes (<200 nm) needed for reticuloendothelial system avoidance, enhanced accumulation, and deep tumor penetration. [11–13] Another major concern about microbubbles is their poor stability (on the order of minutes) in the blood stream. [14–16] Better tumor penetration and pharmaceutical properties can be achieved by utilizing sub-micrometer sized contrast agents such as gas filled liposomes, [17–19] silica or organic polymer shells, [20–23] and others. [24–26] Unfortunately, these approaches provide limited contrast enhancement due to their lower acoustic scattering cross-sections. Accordingly, concentrated doses of contrast agent are needed with these contrast agents to obtain significant enhancement, which can result in undesired side effects and increase the potential toxicity.
To address low ultrasound contrast often provided by nanoscale agents, acoustic vaporization of lipid stabilized perfluorocarbon nanodroplets into micrometer-sized gas bubbles has been proposed. [15,27–29] The phase transition of nano droplets can be achieved by the negative pressure and increased temperature generated during application of high intensity focused ultrasound (HIFU). [6,30,31] The microbubbles formed from nanodroplet vaporization enable high-contrast imaging of target tissue. [28,29] However, lipid stabilized perfluorcarbon nanodroplets can be polydisperse, which can produce background noise in the ultrasound images since poly-disperse particles can be activated in a broad energy range. [29] Monodispersity can be achieved instead by encapsulating perfluorocarbon droplets in template-synthesized silica or organic polymer shells, [32–35] but the efficiency of hydrophobic perfluorocarbon encapsulation inside the hydrophilic silica or organic polymer networks has not been evaluated in these studies. In addition, for both lipid and shell-stabilized droplets, moderate shelf life (on the order of weeks) of perfluorocarbon droplets hinders their translation to the clinic.
In this paper, we describe a novel, perfluorocarbon-free, nanoscale ultrasound contrast agent based on stable air encapsulation in mesoporous silica nanoparticles (MSN) with hydrophobic interior functionalization and suspended in aqueous media by an amphiphilic copolymer (Pluronic F127). Recently, Zhao et al. [36] also prepared hydro-phobic MSN and used the enhanced cavitation of water for cancer cell killing in the presence of low energy ultrasound (LEUS) rather than for imaging. Here, we hypothesized that pores of F127-suspended hydrophobic MSNs would contain air because water would not be able to wet the hydrophobic pores. When subjected to an ultrasound pulse with a large negative pressure (>1 MPa), the stabilized nanoscale air pockets would nucleate bubbles [37] that grow, oscillate, and collapse, in a process known as inertial cavitation. Cavitating bubbles scatter and radiate sound waves during collapse, which can be detected with an ultrasound imaging transducer. In fact, it was observed that when exposed to HIFU, the MSN with hydrophobic interiors produce remarkable ultrasound signal even at low doses at around 1010 particles mL−1, with no background in the absence of HIFU. To confirm the proposed mechanism, we investigated ultrasound response of mesoporous or nonporous silica nanoparticles with different surface chemistry, at different conditions. In addition, to demonstrate the suitability of our contrast agents for blood pool imaging, their ultrasound responsivity in whole blood was tested and the effect of cavitation activity on red blood cells was investigated. Finally, to provide a comparison with current perflurocarbon based contrast agents, these air-filled contrast agents can be produced in large-scale and stored in PBS (at least for 4 months) or as lyophilized for later resuspension and use.
2. Results and Discussion
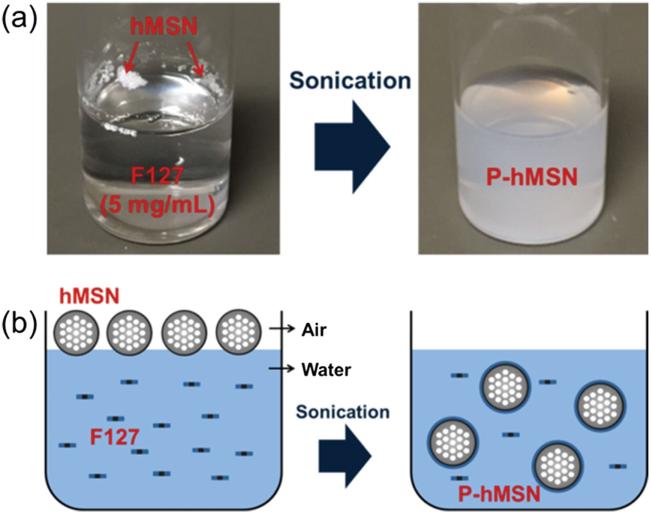
Mesoporous silica nanoparticles with hydrophobic surface functionalization (hMSN) were prepared by co-condensation of tetraethyl orthosilicate (TEOS) and octyltriethoxysilane (OTES) in a one-pot reaction using cetyltrimethylammonium bromide (CTAB) as the structure-directing agent. [38,39] In this method, condensation of TEOS forms the initial hydrophilic mesoporous silica nanoparticles and sequential addition of OTES forms a hydrophobic layer around the particles. As prepared, hMSN are not dispersible in water (Figure 1a); they float on the water in a chunk, which indicates their strong hydrophobicity. To further demonstrate the poor wetting of the hMSN by water, we spread the particles on a flat surface and placed a water droplet on the particle-covered surface (Figure S1, Supporting Information). The droplet preserved its spherical shape (Figure S1a, Supporting Information) and rolled off from the surface after slight tilting (≈5°) (Figure S1b, Supporting Information). Based on these results, the water/hMSN interface likely exists in a Cassie-Baxter state in which water is unable to wet the air-filled pores, leading to strong hydrophobicity. [40,41]
Figure 1.
Preparation of F127 capped particles. a) Photographs of hMSN before and after 15 min sonication in a Pluronic F127 solution. b) Schematic representation of phase transfer process of hMSN using Pluronic F127 solution to form Pluronic F127 capped P-hMSN.
Hydrophobic nanoparticles are easily stabilized in aqueous solutions using amphiphilic molecules such as amphiphilic copolymers, peptide amphiphiles, or phospholipids. [38,39,42–44] The amphiphilic molecules assemble on the surface of nano particles due to the hydrophobic effect, while the hydro-philic moieties allow dispersion in aqueous media. In this study, we used the FDA-approved Pluronic F127 (PEO-PPOPEO) to stabilize the hMSN and provide PEG moieties for good dispersibility in biological media as well as biocompatibility. [38] After sonication in Pluronic F127 solution for 15 min, the hMSN was completely transferred into water and formed a stable dispersion, hereby referred to as P-hMSN (Figure 1a,b).
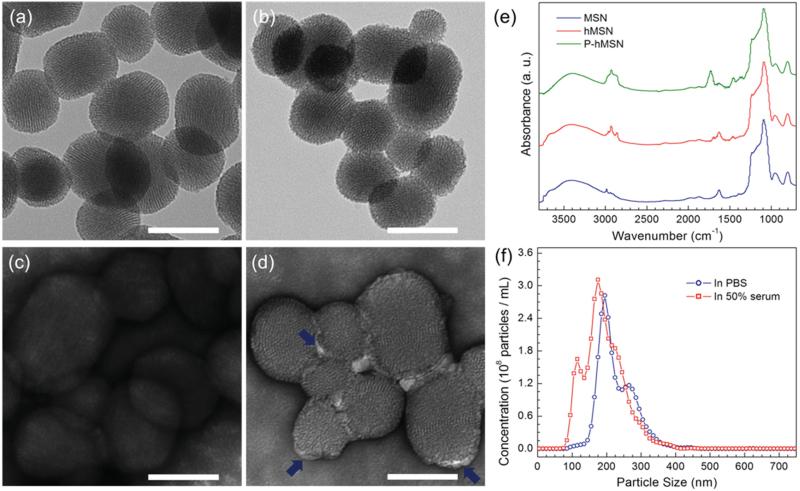
Within the nanoparticles, hexagonally ordered ≈3 nm diameter well-ordered pores, typical of the MCM-41 type mesoporous silica materials, are clearly observable by transmission electron microscopy (TEM) (Figure 2a–d). Similar pore structure was also evident for P-hMSN, indicating that octyl modification did not significantly affect the pore structure (Figure 2b), although the surface of the P-hMSN was slightly roughened by octyl modification, as observed in previous reports.[38,39] In addition, surface areas of MSN and hMSN, 773 and 562 m2 g−1, respectively, were determined using a physisorption method. The lower surface area of the hMSN is caused by pore narrowing after octyl modification.[38] According to TEM, average particle sizes of MSN and P-hMSN were similar and calculated to be 112 ± 18 and 99 ± 18 nm for MSN and P-hMSN, respectively. Uranyl acetate negative staining was used to confirm the existence of Pluronic F127 around the particles. For MSNs, no contrast enhancement was observed, while for P-hMSNs, bright layers (Pluronic F127) around the particles were apparent (Figure 2 c,d). Fourier transform infrared (FTIR) spectroscopy further confirmed capping, as the CH2 stretching and bending peaks at around 2950 and 1450 cm−1,[45,46] were indicative of the organic content of silica nanoparticles (Figure 2 e). The very small peaks for bare MSNs were likely from residual surfactants and/or unhydrolyzed ethoxy groups of the TEOS precursor. The CH2 absorption bands significantly intensified for hMSN and were even stronger for P-hMSN, suggesting the octyl and F127 coatings around the particles. TGA was performed to further prove the successful octyl and F127 modifications (Figure S2, Supporting Information). The organic contents of particles were determined based on the weight loss between 150 and 850 °C. The weight losses in this region were 7.8%, 13.9%, and 43.6% for MSN, hMSN, and P-hMSN, respectively. The slight weight loss of unmodified MSN was due to the residual surfactants and dehydroxylation of silica surface.[38,47] The difference between the weight losses of MSN and hMSN gives the octyl weight percentage in hMSN, which is 6.1%. Similarly, weight percent of Pluronic F127 in the P-hMSN sample was found to be 29.7%. Nanoparticle Tracking Analysis (NTA) was used to characterize the dispersion of P-hMSN in biological media. The distribution of P-hMSN in PBS (pH 7.4, 10 × 10−3 m) and 50% fetal bovine serum are given in Figure 2f, which demonstrated good dispersion of P-hMSN in both PBS and serum without significant aggregation. By this method, the average particle size of P-hMSN was determined to be 222 ± 51 nm and 187 ± 57 nm in PBS and fetal bovine serum, respectively.
Figure 2.
Characterization of the mesoporous silica nanoparticles. a–d) TEM images of MSN and P-hMSN. Bare MSN without a) and with c) uranyl acetate stain. P-hMSN without b) and with d) uranyl acetate stain. Blue arrows in d) indicate the stained F127 layer around the particles. e) FTIR spectra of MSN, hMSN, and P-hMSN. f) Size distribution of P-hMSN in PBS and 50% fetal bovine serum as determined by Nanoparticle Tracking Analysis. All scale bars are 100 nm.
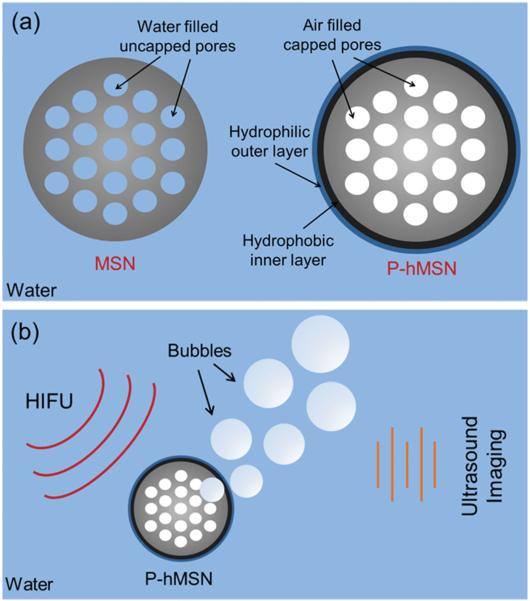
While water can easily wet the hydrophilic silica pores of unfunctionalized MSNs, thereby displacing any air, water cannot penetrate into the P-hMSNs due to their hydrophobic surface (Scheme 1a). In that case, air inside the hydrophobic pores and water contact line are in equilibrium (Scheme S1, Supporting Information). If the outside pressure is reduced (e.g., negative acoustic pressure), air inside the pores of hydro-phobic MSN will increase in size and push out the water contact line.[37,48,49] In fact, formation macroscopic bubbles from smaller air pockets under acoustic insonation was experimentally demonstrated by Lohse et al.[50,51] and others[52–54] either on smooth hydrophobic surfaces or on surfaces with hydrophobic wells. Here, we hypothesized that air pockets inside hydrophobic MSN rapidly form a free-standing micro-meter-sized bubble under HIFU insonation, which can grow further outside the particle until collapse. Also, note that for hydrophobic MSNs, coalescence of neighboring bubbles to form larger bubbles is expected since pores are close to one another. Therefore, it can be expected that HIFU insonation will cause air pockets inside the pores to generate a bubble larger than the equilibrium size (Scheme 1 b and Scheme S1, Supporting Information).
Scheme 1.
a) Schematic representation of MSN and P-hMSN. b) Schematic representation of ultrasound signal generation upon HIFU exposure.
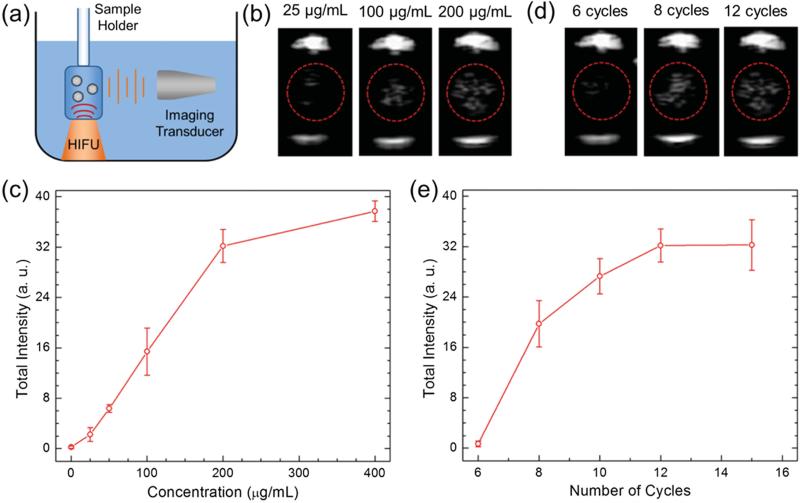
To test this hypothesis, the ultrasound response of the HIFU irradiated P-hMSN was measured. Samples were placed in a plastic tube with low acoustic attenuation. The tube was submerged in a water tank and placed so that the center of the sample would sit in the focus of a HIFU transducer aligned in the z-direction. A phased array scanning probe was aligned to be in the same plane as the sample, orthogonal to the HIFU (Figure 3a). The ultrasound response of the HIFU irradiated particles was detected through continuous scanning at 1.5 MHz in Cadence Contrast Pulse Sequencing (CPS) mode to highlight nonlinear response of the bubbles.[55] Initially, P-hMSN in PBS at different concentrations was exposed pulse packets of 12 sine waves (cycles) administered at a repetition rate of 10 Hz. Indeed, upon application of HIFU, bright spots were immediately observed, confirming the bubbles were produced by HIFU exposure. The bright spots disappeared immediately after ceasing HIFU (see Video S1 in the Supporting Information) due to the short life-time of air bubbles in water.[5] Still images of typical ultrasound responses of the P-hMSN at different particle concentrations are given in Figure 3 b. With increasing P-hMSN concentration more contrast was generated, as expected. Even at a low particle concentration of 25 μg mL−1, P-hMSN exhibited a visible signal that was clearly distinguishable from background (Figure 3 b). According to NTA analysis, this concentration corresponded to ≈6 × 10⁹ particles mL−1, which is on the same order with the reported optimum dose for lipid-coated perfluorohexane droplets in our recent paper.[29] Increasing the concentration to 100 μg mL−1 and 200 μg mL−1 strongly increased the response and the appearance of more bright spots (Figure 3 b). To quantify the ultrasound response of the P-hMSN, we recorded three 15 s videos (see the representative video of a 200 μg mL−1 of P-hMSN sample in PBS, Video S1, Supporting Information) for each sample and analyzed the videos using MATLAB (Mathworks, Inc.) to calculate the total intensity of the bright spots. Figure 3c shows the integrated intensity at different P-hMSN concentrations when subjected to HIFU (12 cycles). Between 0 and 200 μg mL−1, the intensity increased linearly, but further increasing the concentration to 400 μg mL−1 only slightly increased the total intensity. Without HIFU, no signal was observed, even for the largest particle concentration tested in this study (400 μg mL−1). Next, we applied different HIFU cycles to the P-hMSN (200 μg mL−1) to optimize the imaging conditions. Figure 3d shows the representative photographs of obtained signal at different cycles. At 6 cycles, there was only a slight response and it gradually increased until 12 cycles. However further increasing the number of applied cycles did not change average intensity significantly, which indicates that around 12 cycles the signal was saturated (Figure 3e). Accordingly, P-hMSN concentration of 200 μg mL−1 and HIFU condition of 12 cycles were determined as optimum imaging conditions and utilized for further experiments. To show that P-hMSN is suitable for dry storage, we lyophilized the as-prepared P-hMSN and measured the generated ultrasound response after redispersing them in PBS. We observed that lyophilization had no effect on the ultrasound response of the particles (Figure S3, Supporting Information) suggesting that the lyophilized P-hMSN can be stored and used when needed after simple batch sonication.
Figure 3.
a) Schematic of the ultrasound signal measurement setup from the HIFU exposed nanoparticles. b) Representative images were taken from movies acquired during HIFU irradiation of nanoparticles at different concentrations. c) Calculated total intensities from the acquired movies of P-hMSN samples with different concentrations exposed with 12 HIFU cycles. d) Representative images were taken from movies acquired during HIFU irradiation at different number of cycles. e) Calculated total intensities from the acquired movies of P-hMSN samples (200 μg mL−1) were exposed with different HIFU cycles. Error bars = 1 SD, studies were run in triplicate.
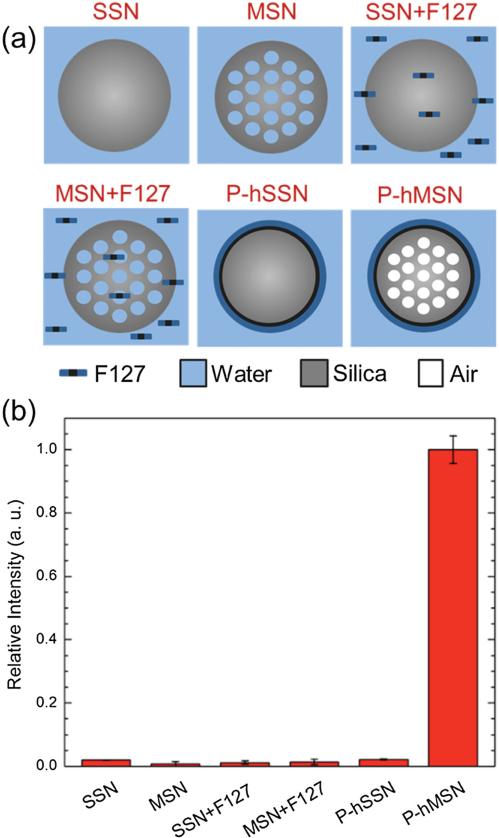
To identify the possible mechanism of ultrasound signal generation, silica nanoparticles with different pore structure and surface chemistry were prepared (Figure 4a). As controls for the P-hMSNs, solid (nonmesoporous) silica nanoparticles (SSN) and bare mesoporous silica nanoparticles (MSN) were studied in PBS or in F127 (1 mg mL−1 ) solution. In addition, hydro-phobic SSN was prepared and capped with F127 (P-hSSN) to explore the effect of nonporous hydrophobic interface. Each particle batch had an average diameter near 100 nm (for TEM images of SSN and P-hSSN, see Figure S4 in the Supporting Information). The ultrasound response of the particles in the presence of HIFU (12 cycles) at a particle concentration 400 μg mL−1 was measured for each combination, and none of the control particles produced any statistically significant response from the background (Figure 4b). These experiments demonstrate the need for hydrophobic interface and porosity to obtain ultrasound signal under HIFU irradiation. Also, it was observed that a solution of Pluronic F127 had no contribution to the ultrasound response either.
Figure 4.
a) Schematic representation of the particles and conditions were used in the control experiments. b) Total intensities (relative to response of P-hMSN) were calculated from the acquired movies for control conditions; for all particles concentration was 400 μg mL−1, F127 concentration in SSN+F127 and MSN+F127 samples was 1 mg mL−1. Error bars = 1 SD, studies were run in triplicate.
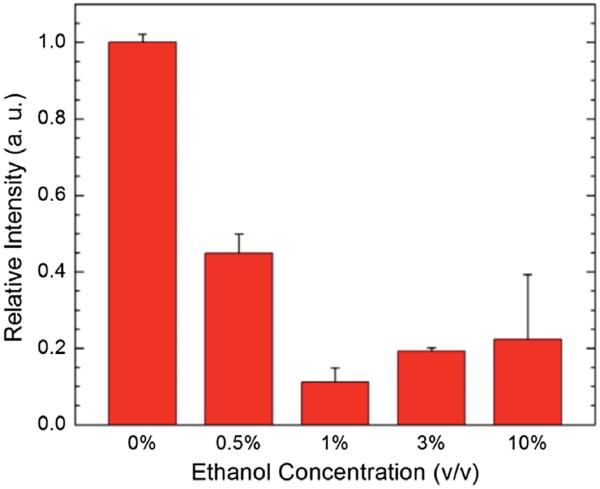
To further elucidate the role of air pockets in signal generation, mixed solvents with lower surface tension were used to potentially wet the mesopores and displace any entrapped air. Low surface energy liquids such as alcohols are known to wet the hydrocarbon coated hydrophobic particles and surfaces.[56,57] First, the particles were verified to be dispersed in ethanol without addition of Pluronic, confirming its ability to wet the hMSN (Figure S5, Supporting Information). Then, the ultrasound response of P-hMSN dispersion was measured in the presence of different amounts of ethanol (Figure 5). Addition of only 0.5% (v/v) ethanol into the P-hMSN dispersion (200 μg mL−1) quenched the resultant ultrasound signal more than 50%. Doubling the ethanol amount resulted in a quenching more than 80%.
Figure 5.
Quenching of the ultrasound response of P-hMSN (200 μg mL−1) in the presence of different amounts of ethanol. Error bars = 1 SD, studies were run in triplicate.
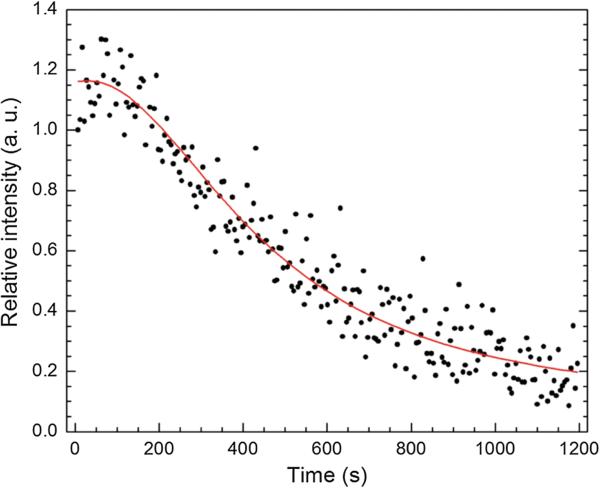
Next, P-hMSN dispersion was continuously exposed to HIFU (12 cycles) for 20 min. The result is shown in Figure 6, where each data point was obtained by averaging the intensity of the every frame at 5 s intervals. Calculated intensities for each frame of the complete video are provided in Figure S6 in the Supporting Information. We note that the spikes in Figure S6 (Supporting Information) can be due to the formation and collapse of larger bubbles. In the first 3 min signal is almost constant, then starts to decrease gradually, finally to around 20% of the initial response after 20 min of continuous HIFU exposure at 10 Hz. This also supports the role of the entrapped air in the signal generation: HIFU exposure consumes the entrapped air inside the particles, which decreases the signal over time. While cavitation can also damage local environments, TEM analysis of the HIFU exposed P-hMSN (Figure S7, Supporting Information) indicated that particles remained essentially unchanged even after 20 min of continuous HIFU treatment. Based on the results presented in Figure 4, 5, and 6, the most likely mechanism for HIFU induced ultrasound signal generation is the formation of macroscopic bubbles, which are nucleated from the entrapped air inside the hydrophobic pores. Also, it should be noted that, in addition to the role in entrapment of air, hydrophobic interface may facilitate the release of air-bubbles by lowering the adhesion force between silica surface and air-bubbles.[58,59] In addition, replacement of encapsulated air with water in the course of HIFU exposure can be expected since HIFU insonation pulls out the air to nucleate bubbles and creates a pressure difference between outside and inside of the pores (lower pressure inside the pores), which then can force the water to wet the pores.[40]
Figure 6.
Change in the response of a P-hMSN (200 μg mL−1) under continuous HIFU exposure (12 cycles) for 20 min. All data points were averaged from the frames of 5 s intervals of the recorded video and normalized to initial response.
To explore the stability of the encapsulated air inside the pores of the P-hMSN in the absence of HIFU, we stored the P-hMSN in PBS (1 mg mL−1 ) without insonation for four months. The ultrasound responsiveness of the stored P-hMSN (200 μg mL−1) was measured after redispersing the particles by batch sonication for a few seconds (Figure S8, Supporting Information). The response was almost same with the as-prepared particles, which reveals the excellent stability of the air encapsulated in the pores. The morphology of the stored particles were investigated by TEM (Figure S9, Supporting Information), which indicates particles remained mostly intact after 4 months of storing in PBS. Only some small pores were formed (due to the dissolution of silica) inside the particles. While MSNs are generally soluble in salt solutions (typically in a few weeks), the hydrophobic octyl groups of P-hMSN protected the particles from dissolution by PBS.[60,61] In addition, the NTA characterization of the stored sample showed that size distribution was not also effected from the storage (Figure S10, Supporting Information). These results show that particles can be stored in PBS for at least 4 months without any significant agglomeration and loss in the ultrasound responsivity.
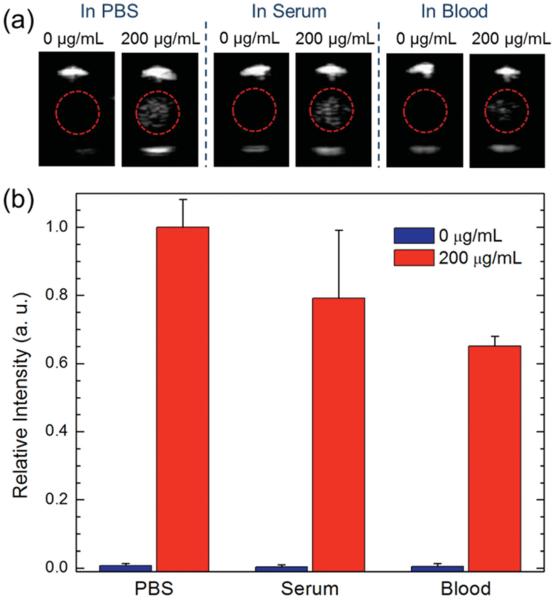
To examine the potential relevance of the nanoscale ultrasound contrast agents for future biological validation, ultrasound responsiveness of the P-hMSN (200 μg mL−1) was measured in fetal bovine serum and EDTA-stabilized whole blood (Figure 7). Slight reduction in the response was observed in serum (≈20%), while the reduction in the signal was more pronounced (≈35%) in whole blood (Figure 7b). The quenching in the ultrasound response in the biological media can be explained by the higher densities of serum and blood than PBS and that blood cells can scatter and attenuate the sound waves.[62,63] Notably, there was no background in the absence of P-hMSN for both serum and blood samples (Figure 7b).
Figure 7.
Ultrasound response of the P-hMSN in different media. a) Representative images were taken from movies acquired during HIFU irradiation in the presence or absence of P-hMSN. b) Relative intensity of samples in different media were calculated from acquired movies in the presence or absence of P-hMSN. Error bars = 1 SD, studies were run in triplicate.
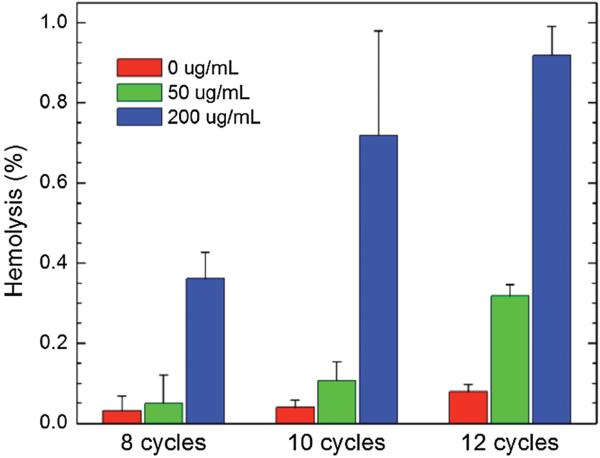
To further explore the relevance of the P-hMSN as blood pool contrast agents, their compatibility with red blood cells (RBCs) was investigated in the presence or absence of HIFU. One can expect damage to the RBC membrane induced by the cavitation of the bubbles generated by HIFU irradiation.[64] To explore the possible membrane damage in RBCs, the absorption of the released hemoglobin (at 570 nm) from the lysed RBCs was measured.[65] Figure 8 shows the hemolytic activity induced by 15 s of HIFU irradiation at different P-hMSN concentrations and HIFU cycles in 50% bovine whole blood. In the absence of P-hMSN, there was only slight hemolytic activity (<0.1%). The presence of P-hMSNs (50 μg mL−1), slightly increased the hemolytic activity, especially at 12 cycles (≈0.3%). Increasing the P-hMSN concentration to 200 μg mL−1 further increased the hemolytic activity at all HIFU cycles, and hemolytic activity reached around 0.9% at 12 cycles. Figure S11 (Supporting Information) shows the hemolytic activity of P-hMSN (200 μg mL−1) after different HIFU exposure times at 12 cycles. With increasing HIFU irradiation times, hemolytic activity increased linearly to 2.5% after 60 s of HIFU irradiation. To test the effect of P-hMSNs themselves on hemolytic activity, we incubated the P-hMSN at different concentrations (0 to 400 μg mL−1) in 50% blood for 2 h. Without HIFU, no hemolytic activity was detected for P-hMSN at any particle concentration, most likely due to the particles’ PEGylated surface (Figure S12, Supporting Information).[38,66] These results indicate that although our contrast agents have some potential to induce hemolysis in the presence of HIFU due to their ultrasound signal generation capability at low particle doses, the degree of hemolysis was negligible, making these agents suitable for blood pool imaging applications.
Figure 8.
Calculated hemolysis percentages after application of different HIFU cycles in the presence or absence of P-hMSN. Error bars = 1 SD, studies were run in triplicate.
Finally, we tested the responsivity of P-hMSN in a tissue mimic composed of an agarose gel. P-hMSN was added into the agarose gel solution to give final particle concentration of 200 μg mL −1 and left for gelation at RT for 1 h. After the gels formed, their responsivity was investigated by applying HIFU at 12 cycles (Figure S13, Supporting Information). Interestingly, ultrasound response was concentrated in a smaller region for the particles dispersed in agarose gel as compared to particles dispersed in PBS or blood. We believe this difference to be caused by the decreased mobility of the bubbles generated in the stiff gel microenvironment. Nevertheless, P-hMSN produces an easily distinguishable response in agarose gel that is significantly greater than background (Figure S13b, Supporting Information). While these results indicates the potential of the P-hMSN as nanoscale ultrasound contrast agents for in vivo tissue imaging, further in-depth studies are still needed; these are currently underway in our laboratory.
3. Conclusion
In conclusion, a distinct nanoscale ultrasound contrast platform was described using air-containing mesoporous nano-particles with hydrophobic functionalization stabilized by amphiphilic polymers. When exposed to HIFU, these particles produced an observable ultrasound response, even at a low particle concentration of 25 μg mL −1 (≈6 × 10⁹ particles mL−1), with no background signal in the absence of HIFU exposure. The absence of background makes the developed nanoparticles promising for high contrast ultrasound imaging and designing sensor platforms.[29] The mechanism of ultrasound signal generation was investigated, and it was concluded that the entrapped air inside the hydrophobic capped pores of the mesoporous particles can be released by HIFU exposure to form ultrasound responsive bubbles.
The ultrasound contrast agents described in this study brings several advantages over the conventional perfluorocarbon containing contrast agents. They can be prepared in large quantities and stored in atmospheric conditions. In addition, particle size and size distribution is better controlled owing to the well-established synthesis of mesoporous silica nanoparticles, resulting in particles well below the 200 nm diameter cutoff desired for satisfactory extravasation and passive targeting.[11,12] In future studies, the stabilizing polymers will be optimized to allow attachment of targeting ligands, followed by in vivo validation of this new technology for tumor detection and therapy.
4. Experimental Section
Materials
Tetraethyl orthosilicate (TEOS), n-octyltriethoxysilane (OTES), octyltrichlorosilane (OTCS), and cetyltrimethylammonium bromide (CTAB) were purchased from Across Organics. Pluronic F127 polymer was purchased from Anatrace, Inc. Ethanol was purchased from Decon Laboratories. Dichloromethane (DCM) and Tetrahydrofuran (THF) were purchased from Sigma Aldrich. Ammonium nitrate was purchased from Fisher Scientifi c. Sodium hydroxide and ammonium hydroxide solution (28%–30%) were purchased from Macron Chemicals. Hexane was purchased from EMD Chemicals. All chemicals were used as received. EDTA stabilized whole bovine blood was purchased from Lampire Biological Laboratories and fetal bovine serum was purchased from Hyclone, Thermo Scientific.
Synthesis of hMSN
hMSN was prepared according to previous reports with slight modifi cations.[38,39] Briefly, CTAB (200 mg) and Pluronic F127 polymer (6 mg) were dissolved in Millipore water (96 mL) and 2 m NaOH (0.7 mL) was added. While stirring at 600 rpm, the reaction solution was heated to 80 °C and TEOS (1.5 mL) was rapidly added. In a few minutes, the reaction solution became turbid indicating the formation of mesoporous silica nanoparticles. After 30 min, OTES (0.25 mL) was dissolved in THF (10 mL) and added to the reaction solution to form the hydrophobic layer around the particles. The reaction was kept at the same condition for further 2.5 h and particles were collected by centrifugation (6600 rcf) and washed with ethanol. To extract the surfactant molecules, product was dispersed in 50 mL of ethanolic ammonium nitrate solution (20 mg mL−1) and vigorously stirred at 60 °C for 30 min. The particles were then collected by centrifuge, and ammonium nitrate treatment was repeated an additional time. Finally, particles were washed with ethanol three times and dried at 60 °C.
Synthesis of MSN
MSN was synthesized using the aforementioned conditions with the exception of OTES addition.
Synthesis of SSN
SSN (≈100 nm in diameter) was prepared according to the Stober method.[67] Briefly, 3 mL of TEOS was dissolved in 80 mL of ethanol and gently added onto a another solution containing 20 mL of ethanol, 0.5 mL of Millipore water, and 6 mL of ammonium hydroxide solution (28%–30%). The reaction mixture was stirred (300 rpm) at room temperature for overnight. Particles were collected by centrifugation (6600 rcf), washed with ethanol twice and dried at 70 °C.
Synthesis of hSSN
To prepare hSSN, 40 mg of SSN was dispersed in anhydrous DCM and 0.2 mL of OTCS was added dropwise. The reaction mixture was gently stirred at room temperature and under argon atmosphere for overnight. Particles were collected by centrifugation (6600 rcf), washed with hexanes and ethanol, and dried at 70 °C.
F127 Capping
hMSN or hSSN capped with Pluronic F127 polymer were prepared according to a previous report.[38] Briefly, 5 mg of particles was dispersed in 10 mL of 5 mg mL−1 Pluronic F127 solution in distilled water by sonication for 15 min. The dispersed particles were stirred (500 rpm) for 1 h and collected by centrifugation (6600 rcf). Then, particles were dispersed in 10 mL of Pluronic F127 solution and sonication and stirring steps were repeated. Finally, particles were collected by centrifugation (6600 rcf) and washed with distilled water twice to remove the excess Pluronic F127.
Ultrasound Contrast Imaging and Analysis
For HIFU exposure, a spherically focused, single-element, HIFU transducer (Sonic Concepts H101, 64.0 mm Active Diameter × 63.2 mm Radius of Curvature) was equipped with a coupling cone (Sonic Concepts C101). It was filled with degassed and deionized water prior to the experiments, and the transducer and core were submerged in a water tank. The HIFU transducer was connected to a 30 MHz Function/Arbitrary Waveform Generator (Agilent Technologies) via an AG Series Amplifi er (T&C Power Conversion, Inc.), the amplifier operating at 100% output, the peak pressure of which was measured to be 9.87 MPa via needle hydrophone calibration (Onda Corp.).
In a typical experiment, P-hMSN or control particles were dispersed in 1 mL of PBS (10 × 10−3 m, pH 7.4) to give the desired concentration of between 0 and 400 μg mL−1. For the studies in bovine blood or fetal bovine serum, P-hMSN was dispersed in 0.2 mL of PBS and diluted in 0.8 mL of blood or serum to give the final particle concentration of 200 μg mL−1. The samples were placed to the bulb of a plastic pipette. For measurements, the plastic bulb was positioned on top of the coupling cone to guarantee proper HIFU focusing into the center of the sample. A vector array 4V1 (Acuson) transducer (1–4 MHz) was aligned to acquire horizontal cross-sectional images of the sample to prevent direct exposure of the transducer to HIFU pulses. The transducer was connected to a Siemens Acuson Sequoia C512 scanner operating in CPS mode at 1.5 MHz and a mechanical index (MI) of 0.19. Then, HIFU was applied using the following Waveform Generator settings: 1 Vpp, 1.1 MHz center frequency, 0.1 s pulse interval (burst period), and number of cycles between 6 and 15 as indicated in the main text. Real-time videos were recorded for 15 s during the HIFU application by the Siemens Acuson Sequoia C512 scanner. The videos were analyzed using a MATLAB (Mathworks, Inc.) code which calculates the total intensity of the bright spots in the region of interest of each frame of the videos.
For hemolytic activity studies, 0.5 mL of P-hMSN in PBS was mixed with 0.5 mL of whole bovine blood and immediately exposed to HIFU at predefi ned exposure times and number of cycles. Positive and negative controls were prepared by adding 0.5 mL of water and PBS, respectively. Addition of water caused the complete lysis of RBCs due to the formed hypotonic environment; therefore, all hemoglobin inside RBCs should be released. The blood samples were then centrifuged at 950 rcf for 5 min to precipitate the RBCs. 100 μL of supernatants was transferred to a 96-well plate and released hemoglobin in the supernatants were measured with a Microplate reader (Safi re2, Tecan) at 570 and 655 nm (reference wavelength). Percent hemolysis percentages were calculated by comparing the released hemoglobin amount in samples with the positive and negative controls, from at least three separate experiments.
For agarose gel studies, 1% (w/w) agarose was dissolved in PBS by stirring at 90 °C, followed by cooling to ≈40 °C. Then, P-hMSN in 0.5 mL of PBS was mixed with 0.5 mL of agarose solution to give fi nal particle concentration of 200 μg mL−1. Immediately after mixing, the gel solution was transferred into a bulb of a plastic pipette and left for gelation at RT and static conditions for 1 h. Agarose gels in the absence of P-hMSN were prepared by mixing 0.5 mL agarose solution with 0.5 mL PBS for control experiments. Ultrasound responsivity of the agarose gels with or without P-hMSN was investigated as described above.
Hemolysis Assay
Hemolytic activity of the P-hMSN in the absence of HIFU was determined by incubating the P-hMSN (0-400 μg mL−1) in 50% blood at 37 °C for 2 h under gentle shaking. Hemolysis percentages were determined as described above.
Characterization
Transmission electron microscopy (TEM) images were taken using a CM 100 (Philips) microscope. For staining 2% uranyl acetate solution was used. FTIR spectra of MSNs were collected by using a Fourier transform infrared spectrometer (Nicolet 6700, Thermo Scientific). The concentration and size distribution of P-hMSN in different media were measured via Nanoparticle Tracking Analysis using a NanoSight LM10 setup (Malvern). Surface area of MSN and hMSN were determined using a ChemiSorb 2720 (Micromeritics). Before measurements, all samples were degassed at 220 °C for 1 h. Thermal gravimetric analyses (TGA) of the samples were performed using a Pyris 1 TGA (Perkin Elmer).
Supplementary Material
Acknowledgements
This work was supported by NIH (Grant Nos. DP2EB020401, R21EB018034, and R00CA153935). The authors thank Dr. Omer Yehezkeli and Prof. Jennifer Cha for helpful discussions. The authors would also like to thank Prof. Amy Palmer for use of her Tecan Safire2 plate reader, Prof. Jeffrey Stansbury for use of his Thermo Scientific Nicolet 6700 FTIR and Perkin Elmer Pyris 1 TGA, Prof. J. Will Medlin for use of his Micromeritics Chemisorb 2720, Dr. Parag Shah for his help with the TGA and FTIR measurements and Lucas Ellis for his help with the surface area measurements.
Footnotes
Supporting Information
Supporting Information is available from the Wiley Online Library or from the author.
Contributor Information
Dr. Adem Yildirim, Department of Chemical and Biological Engineering, University of Colorado Boulder, Boulder, CO 80303, USA
Rajarshi Chattaraj, Department of Chemical and Biological Engineering, University of Colorado Boulder, Boulder, CO 80303, USA; Department of Mechanical Engineering, University of Colorado Boulder, Boulder, CO 80309, USA.
Nicholas T. Blum, Department of Chemical and Biological Engineering, University of Colorado Boulder, Boulder, CO 80303, USA
Galen M. Goldscheitter, Department of Chemical and Biological Engineering, University of Colorado Boulder, Boulder, CO 80303, USA
Prof. Andrew P. Goodwin, Department of Chemical and Biological Engineering, University of Colorado Boulder, Boulder, CO 80303, USA.
References
- 1.Kiessling F, Fokong S, Bzyl J, Lederle W, Palmowski M, Lammers T. Adv. Drug Deliv. Rev. 2014;72:15. doi: 10.1016/j.addr.2013.11.013. [DOI] [PMC free article] [PubMed] [Google Scholar]
- 2.Cai WB, Chen XY. Small. 2007;3:1840. [Google Scholar]
- 3.Martinez HP, Kono Y, Blair SL, Sandoval S, Wang-Rodriguez J, Mattrey RF, Kummel AC, Trogler WC. Med. Chem. Commun. 2010;1:266. doi: 10.1039/c0md00139b. [DOI] [PMC free article] [PubMed] [Google Scholar]
- 4.Hu H, Zhou H, Du J, Wang ZQ, An L, Yang H, Li FH, Wu HX, Yang SP. J. Mater. Chem. 2011;21:6576. [Google Scholar]
- 5.Schutt EG, Klein DH, Mattrey RM, Riess JG. Angew. Chem. Int. Ed. 2003;42:3218. doi: 10.1002/anie.200200550. [DOI] [PubMed] [Google Scholar]
- 6.Lindner JR. Nat. Rev. Drug Discov. 2004;3:527. doi: 10.1038/nrd1417. [DOI] [PubMed] [Google Scholar]
- 7.Yang F, Li YX, Chen ZP, Zhang Y, Wu JR, Gu N. Biomaterials. 2009;30:3882. doi: 10.1016/j.biomaterials.2009.03.051. [DOI] [PubMed] [Google Scholar]
- 8.Goldberg BB, Liu J-B, Forsberg F. Ultrasound Med. Biol. 1994;20:319. doi: 10.1016/0301-5629(94)90001-9. [DOI] [PubMed] [Google Scholar]
- 9.Cosgrove E. Eur. J. Radiol. 2006;60:324. doi: 10.1016/j.ejrad.2006.06.022. [DOI] [PubMed] [Google Scholar]
- 10.Correas J-M, Bridal L, Lesavre A, Méjean A, Claudon M, Hélénon O. Eur. Radiol. 2001;11:1316. doi: 10.1007/s003300100940. [DOI] [PubMed] [Google Scholar]
- 11.Peer D, Karp JM, Hong S, FaroKhzad OC, Margalit R, Langer R. Nat. Nanotechnol. 2007;2:751. doi: 10.1038/nnano.2007.387. [DOI] [PubMed] [Google Scholar]
- 12.Davis ME, Chen Z, Shin DM. Nat. Rev. Drug Discov. 2008;7:771. doi: 10.1038/nrd2614. [DOI] [PubMed] [Google Scholar]
- 13.Zhou Y, Wang ZG, Chen Y, Shen HX, Luo ZC, Li A, Wang Q, Ran HT, Li P, Song WX, Yang Z, Chen HR, Wang ZB, Lu GM, Zheng YY. Adv. Mater. 2013;25:4123. doi: 10.1002/adma.201301655. [DOI] [PubMed] [Google Scholar]
- 14.Landmark KE, Johansen PW, Johnson JA, Johansen B, Uran S, Skotland T. Ultrasound Med. Biol. 2008;34:494. doi: 10.1016/j.ultrasmedbio.2007.09.019. [DOI] [PubMed] [Google Scholar]
- 15.Garg S, Thomas AA, Borden MA. Biomaterials. 2013;34:6862. doi: 10.1016/j.biomaterials.2013.05.053. [DOI] [PMC free article] [PubMed] [Google Scholar]
- 16.Chen CC, Sirsi SR, Homma S, Borden MA. Ultrasound. Med. Biol. 2012;38:492. doi: 10.1016/j.ultrasmedbio.2011.12.007. [DOI] [PMC free article] [PubMed] [Google Scholar]
- 17.Yin T, Wang P, Li J, Zheng R, Zheng B, Cheng D, Li R, Lai J, Shuai X. Biomaterials. 2013;34:4532. doi: 10.1016/j.biomaterials.2013.02.067. [DOI] [PubMed] [Google Scholar]
- 18.Fan X, Wang L, Guo Y, Tong H, Li L, Ding J, Huang H. Nano-technology. 2013;24:325102. doi: 10.1088/0957-4484/24/32/325102. [DOI] [PubMed] [Google Scholar]
- 19.Wang C-H, Huang Y-F, Yeh C-K. Langmuir. 2011;27:6971. doi: 10.1021/la2011259. [DOI] [PubMed] [Google Scholar]
- 20.An L, Hu H, Du J, Wei J, Wang L, Yang H, Wu DM, Shi HL, Li FH, Yang SP. Biomaterials. 2014;35:5381. doi: 10.1016/j.biomaterials.2014.03.030. [DOI] [PubMed] [Google Scholar]
- 21.Yang P, Zhao F, Ding J, Guo J, Shi W, Wang C, Hu X. Chem. Mater. 2014;26:2121. [Google Scholar]
- 22.Liberman A, Martinez HP, Ta CN, Barback CV, Mattrey RF, Kono Y, Blair SL, Trogler WC, Kummel AC, Wu Z. Biomaterials. 2012;33:5124. doi: 10.1016/j.biomaterials.2012.03.066. [DOI] [PMC free article] [PubMed] [Google Scholar]
- 23.Min HS, Son S, Lee TW, Koo H, Yoon HY, Na JH, Choi Y, Park JH, Lee J, Han MH, Park R-W, Kim I-S, Jeong SY, Rhee K, Kim SH, Kwon IC, Kim K. Adv. Funct. Mater. 2013;23:5518. [Google Scholar]
- 24.Wu H, Shi H, Zhang H, Wang X, Yang Y, Yu C, Hao C, Du J, Hu H, Yang S. Biomaterials. 2014;35:5369. doi: 10.1016/j.biomaterials.2014.03.038. [DOI] [PubMed] [Google Scholar]
- 25.Shapiro MG, Goodwill PW, Neogy A, Yin M, Foster FS, Schaffer DV, Conolly SM. Nat. Nanotechnol. 2014;9:311. doi: 10.1038/nnano.2014.32. [DOI] [PMC free article] [PubMed] [Google Scholar]
- 26.Jia X, Cai X, Chen Y, Wang S, Xu H, Zhang K, Ma M, Wu H, Shi J, Chen H. ACS Appl. Mater. Interfaces. 2015;7:4579. doi: 10.1021/am507443p. [DOI] [PubMed] [Google Scholar]
- 27.Sheeran PS, Luois SH, Mullin LB, Matsunaga TO, Dayton PA. Biomaterials. 2012;33:3262. doi: 10.1016/j.biomaterials.2012.01.021. [DOI] [PMC free article] [PubMed] [Google Scholar]
- 28.Sheeran PS, Luois S, Dayton PA, Matsunaga TO. Langmuir. 2011;27:10412. doi: 10.1021/la2013705. [DOI] [PMC free article] [PubMed] [Google Scholar]
- 29.Chattaraj R, Mohan P, Besmer JD, Goodwin AP. Adv. Health-care Mater. 2015;4:1790. doi: 10.1002/adhm.201500315. [DOI] [PMC free article] [PubMed] [Google Scholar]
- 30.Reznik N, Shpak O, Gelderblom EC, Williams R, de Jong N, Versluis M, Burns PN. Ultrasonics. 2013;53:1368. doi: 10.1016/j.ultras.2013.04.005. [DOI] [PubMed] [Google Scholar]
- 31.Reznik N, Williams R, Burns PN. Ultrasound. Med. Biol. 2011;37:1271. doi: 10.1016/j.ultrasmedbio.2011.05.001. [DOI] [PubMed] [Google Scholar]
- 32.Wang X, Chen HR, Zheng YY, Ma M, Chen Y, Zhang K, Zeng DP, Shi JL. Biomaterials. 2013;34:2057. doi: 10.1016/j.biomaterials.2012.11.044. [DOI] [PubMed] [Google Scholar]
- 33.Wang X, Chen H, Zhang K, Ma M, Li F, Zeng D, Zheng S, Chen Y, Jiang L, Xu H, Shi J. Small. 2014;10:1403. doi: 10.1002/smll.201302846. [DOI] [PubMed] [Google Scholar]
- 34.Yang P, Li D, Jin S, Ding J, Guo J, Shi WB, Wang CC. Biomaterials. 2014;35:2079. doi: 10.1016/j.biomaterials.2013.11.057. [DOI] [PubMed] [Google Scholar]
- 35.Qian X, Wang W, Kong W, Chen Y. RSC Adv. 2014;4:17950. [Google Scholar]
- 36.Zhao Y, Zhu Y, Fu J, Wang L. Chem. Asian J. 2014;9:790. doi: 10.1002/asia.201301333. [DOI] [PubMed] [Google Scholar]
- 37.Jones SF, Evans GM, Galvin KP. Adv. Colloid Interface Sci. 1999;80:27. [Google Scholar]
- 38.Yildirim A, Demirel GB, Erdem R, Senturk B, Tekinay T, Bayindir M. Chem. Commun. 2013;49:9782. doi: 10.1039/c3cc45967e. [DOI] [PubMed] [Google Scholar]
- 39.Sardan M, Yildirim A, Mumcuoglu D, Tekinay AB, Guler MO. J. Mater. Chem. B. 2014;2:2168. doi: 10.1039/c4tb00037d. [DOI] [PubMed] [Google Scholar]
- 40.Tuvshindorj U, Yildirim A, Ozturk FE, Bayindir M. ACS Appl. Mater. Interfaces. 2014;6:9680. doi: 10.1021/am502117a. [DOI] [PubMed] [Google Scholar]
- 41.Xu QF, Wang JN, Sanderson KD. ACS Nano. 2010;4:2201. doi: 10.1021/nn901581j. [DOI] [PubMed] [Google Scholar]
- 42.Wu ZN, Guo CR, Liang S, Zhang H, Wang LP, Sun HC, Yang B. J. Mater. Chem. 2012;22:18596. [Google Scholar]
- 43.Wang LS, Wu LC, Lu SY, Chang LL, Teng IT, Yang CM, Ho JAA. ACS Nano. 2010;4:4371. doi: 10.1021/nn901376h. [DOI] [PubMed] [Google Scholar]
- 44.Prencipe G, Tabakman SM, Welsher K, Liu Z, Goodwin AP, Zhang L, Henry J, Dai H. J. Am. Chem. Soc. 2009;131:4783. doi: 10.1021/ja809086q. [DOI] [PMC free article] [PubMed] [Google Scholar]
- 45.Guo C, Liu HZ, Wang J, Chen JY. J. Colloid Interface Sci. 1999;209:368. doi: 10.1006/jcis.1998.5897. [DOI] [PubMed] [Google Scholar]
- 46.Su YL, Wang J, Liu HZ. Langmuir. 2002;18:5370. [Google Scholar]
- 47.Zhuravlev LT. Langmuir. 1987;3:316. [Google Scholar]
- 48.Caupin F, Herbert E. C. R. Phys. 2006;7:1000. [Google Scholar]
- 49.Atchley AA, Prosperetti A. J. Acoust. Soc. Am. 1989;86:1065. [Google Scholar]
- 50.Bremond N, Arora M, Ohl C-D, Lohse D. J. Phys. Condens. Matter. 2005;17:3603. [Google Scholar]
- 51.Borkent BM, Gekle S, Prosperetti A, Lohse D. Phys. Fluids. 2009;21:102003. [Google Scholar]
- 52.Shchukin DG, Skorb E, Belova V, Möhwald H. Adv. Mater. 2011;23:1922. doi: 10.1002/adma.201004494. [DOI] [PubMed] [Google Scholar]
- 53.Chappell MA, Payne SJ. J. Acoust. Soc. Am. 2007;121:853. doi: 10.1121/1.2404629. [DOI] [PubMed] [Google Scholar]
- 54.Kwan JJ, Myers R, Coviello CM, Graham SM, Shah AR, Stride E, Carlisle RC, Coussios CC. Small. 2015;11:5305. doi: 10.1002/smll.201501322. [DOI] [PMC free article] [PubMed] [Google Scholar]
- 55.Phillips P, Gardner E. Eur. Radiol. 2004;14:P4. [PubMed] [Google Scholar]
- 56.Kota AK, Kwon G, Tuteja A. NPG Asia Mater. 2014;6:e109. [Google Scholar]
- 57.Valipour NM, Birjandi FC, Sargolzaei J. Colloids Surf. A. 2014;448:93. [Google Scholar]
- 58.Patankar NA. Soft Matter. 2010;6:1613. [Google Scholar]
- 59.Lu Z, Sun M, Xu T, Li Y, Xu W, Chang Z, Ding Y, Sun X, Jiang L. Adv. Mater. 2015;27:2361. doi: 10.1002/adma.201500064. [DOI] [PubMed] [Google Scholar]
- 60.Lin YS, Abadeer N, Hurley KR, Haynes CL. J. Am. Chem. Soc. 2011;133:20444. doi: 10.1021/ja208567v. [DOI] [PubMed] [Google Scholar]
- 61.Urata C, Yamada H, Wakabayashi R, Aoyama Y, Hirosawa S, Arai S, Takeoka S, Yamauchi Y, Kuroda K. J. Am. Chem. Soc. 2011;133:8102. doi: 10.1021/ja201779d. [DOI] [PubMed] [Google Scholar]
- 62.Shung KK, Sigelmann RA, Reid JM. IEEE Trans. Biomed. Eng. 1976;23:460. doi: 10.1109/tbme.1976.324604. [DOI] [PubMed] [Google Scholar]
- 63.Franklin DL, Schlegel W, Rushmer RF. Science. 1961;134:564. doi: 10.1126/science.134.3478.564. [DOI] [PubMed] [Google Scholar]
- 64.Poliachik SL, Chandler WL, Mourad PD, Bailey MR, Bloch S, Cleveland RO, Kaczkowski P, Keilman G, Porter T, Crum LA. Ultrasound Med. Biol. 1999;25:991. doi: 10.1016/s0301-5629(99)00043-5. [DOI] [PubMed] [Google Scholar]
- 65.Lin YS, Haynes CL. J. Am. Chem. Soc. 2010;132:4834. doi: 10.1021/ja910846q. [DOI] [PubMed] [Google Scholar]
- 66.Yildirim A, Ozgur E, Bayindir M. J. Mater. Chem. B. 2013;1:1909. doi: 10.1039/c3tb20139b. [DOI] [PubMed] [Google Scholar]
- 67.Stober W, Fink A, Bohn E. J. Colloid Interface Sci. 1968;26:62. [Google Scholar]
Associated Data
This section collects any data citations, data availability statements, or supplementary materials included in this article.


