Figure 7.

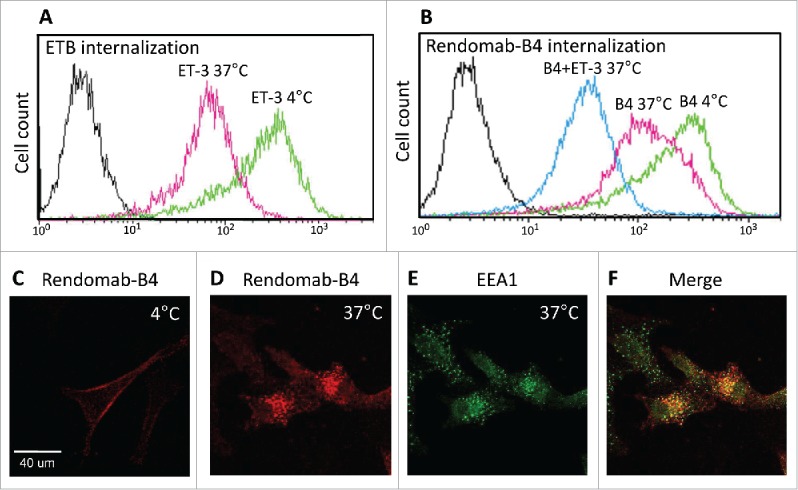
Rendomab-B4 is internalized in UACC-257 cells. Flow cytometry experiments were performed to study the internalization of ETB (A) and of rendomab-B4 itself (B). (A) Living, adherent UACC-257 cells were incubated at 4°C (green curve) or 37°C (pink curve) in medium in the presence of 50 nM ET-3. After washing, cells were detached and incubated for 2 hours at 4°C with rendomab-B4 in order to evaluate ETB amount at the surface of the cells. Cells were then incubated with a fluorescent secondary antibody and the fluorescence was measured using a FACS calibur cytometer. Black curve corresponds to basal fluorescence. (B) UACC-257 living cells were incubated for 3 hours at 4°C (green curve) with 100 nM rendomab-B4. Cells were incubated for 3 hours at 37°C with 100 nM rendomab-B4 prior to 1 additional hour incubation at 37°C with 50 nM ET-3 (blue curve) or not (pink curve). Cells were then detached and remaining antibodies at cell surface were detected using secondary antibody. The fluorescence was quantified by flow cytometry. (C and D) Living UACC-257 cells were incubated for 2 h at 4°C (C) or 37°C (D) with rendomab-B4, fixed and incubated in Cy3-anti-mouse antibody (red). Green labeling in (E) corresponds to early endosomal antigen 1 (EEA1) staining. Merged image is represented in (F).
