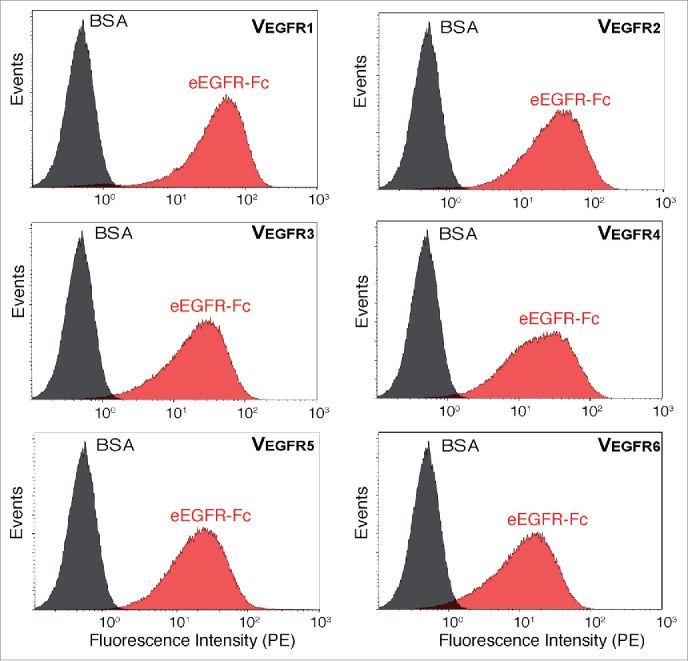
Figure 3.

Binding of E. coli bacteria displaying selected VHH clones to eEGFR-Fc. Fluorescent flow cytometry analysis of induced E. coli EcM1 cells displaying the indicated Nb (VEGFR1-6) incubated with biotinylated eEGFR-Fc (red) or BSA (black) and secondary Streptavidin-PE.
