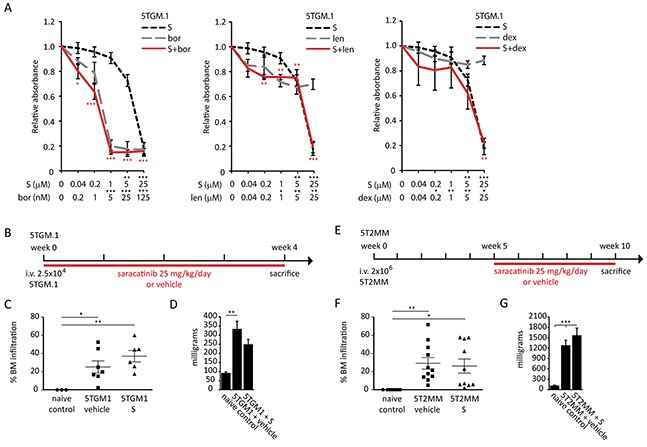
Figure 4. Effect of saracatinib, and combinations with standard drugs, on multiple myeloma cell proliferation, and bone marrow plasmocytosis.

A. MTT assays on 5TGM.1 myeloma cells treated with saracatinib (S), bortezomib (bor), lenalidomide (len), dexamethasone (dex) or combinations of saracatinib with these drugs. Drug concentrations and significance levels of single drug treatments compared to controls are noted on the X-axis. Significance of drug combinations compared to controls are noted near the data points in the figure (in red). No significant synergistic or additive effects were detected (n=3 experiments, *: p<.0.05, **: p<0.01, ***: p<0.001). B. Saracatinib treatment schedule in the 5TGM.1 cohort. C. Percentage BM infiltration of MM cells in naive controls, vehicle- and saracatinib (S)-treated mice in the 5TGM.1 cohort (n=3/7/6 bones, *: p<.0.05, **: p<0.01) as determined by FACS. D. Spleen weight as measured at the time of sacrifice in the 5TGM.1 cohort (n=3/7/6 spleens, **: p<0.01). E. Saracatinib treatment schedule in the 5T2MM cohort. F. Percentage BM infiltration of MM cells in naive controls, vehicle- and saracatinib (S)-treated mice in the 5T2MM cohort (n=8/11/10 bones, *: p<.0.05, **: p<0.01) as determined on cytosmears. G. Spleen weight as measured at the time of sacrifice in the 5T2MM cohort (n=8/11/10 spleens, ***: p<0.001). All data are represented as mean +/− standard error.
