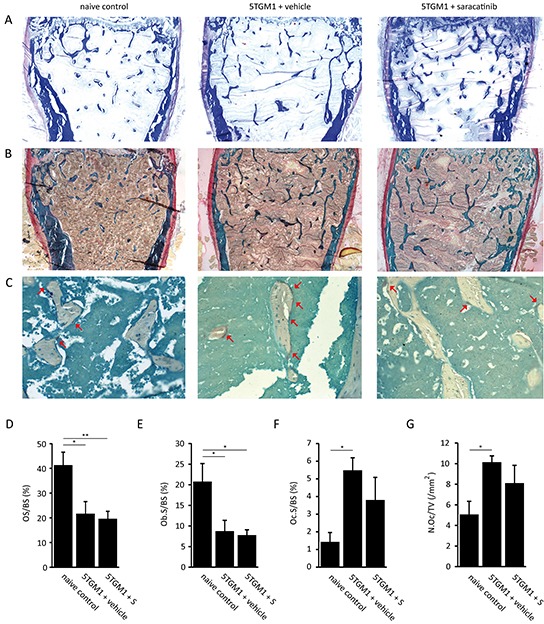
Figure 7. Histomorphometric analysis of bone parameters in the 5TGM.1 multiple myeloma model.

A. Representative images of aniline blue stained bone sections from naive control mice, vehicle-treated myeloma-bearing mice and saracatinib (S)-treated myeloma-bearing mice (n=5/7/7 bones) (40x magnification). B. Representative images of Goldner's trichrome stained bone sections from naive control mice, vehicle-treated mice and saracatinib-treated mice (n=5/7/7 bones) (40x magnification). C. Representative images of bone sections from naive control mice, vehicle-treated mice and saracatinib-treated mice stained for TRAP-positive cells. Red arrows indicate osteoclasts (n=3/5/4 bones) (200x magnification). D. Osteoid surface (OS/BS), E. osteoblast surface (Ob.S/BS), F. osteoclast surface (Oc.S/BS) and G. osteoclast number (N.Oc/TV) were measured on these sections using the Bonolab software package (*: p<.0.05, **: p<0.01). All data are represented as mean +/− standard error.
