
Figure 7. Analysis of the NAC-Notch3 pathway in three other cancer cells.
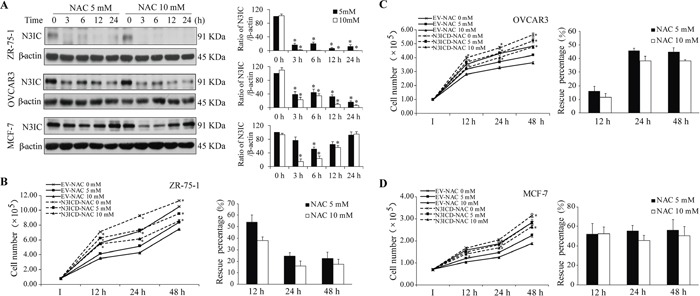
A. NAC treatment (5 and 10 mM, 0-24 h) decreases N3IC protein levels in ZR-75-1, OVCAR3 and MCF-7 cells. B-D. Expression of exogenous N3ICD rescues NAC-induced inhibition of proliferation in ZR-75-1 (B), OVCAR3 (C), and MCF-7 (D) cells. Quantifications, sample size, statistics, and abbreviations for protein levels and proliferation assays were as described in Figure 1A&5 legends.