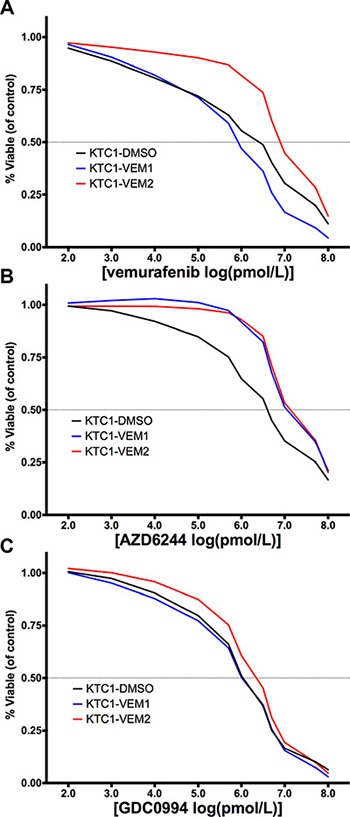
Figure 5. Dose-response curves (percentage of treated cell number compared with DMSO-treated control) for KTC1 subpopulations treated for 4 days with (A) vemurafenib, a BRAF V600E inhibitor; (B) AZD6244, a MEK inhibitor; and (C) GDC0994, an ERK/1/2 inhibitor at the doses described in Supplementary Table 3.

The x-axis represents the log-transformed inhibitor dose concentration in pmol/L. The BRAF V600E/KRAS G12D mutant cells are displayed as red lines.
