Supplemental Digital Content is available in the text
Keywords: 99mTcO4, computed tomography, quantitation, single-photon emission computed tomography, thyroid disease
Abstract
Objectives:
Technetium pertechnetate (99mTcO4) is a radioactive tracer used to assess thyroid function by thyroid uptake system (TUS). However, the TUS often fails to deliver accurate measurements of the percent of thyroid uptake (%thyroid uptake) of 99mTcO4. Here, we investigated the usefulness of quantitative single-photon emission computed tomography/computed tomography (SPECT/CT) after injection of 99mTcO4 in detecting thyroid function abnormalities.
Materials and methods:
We retrospectively reviewed data from 50 patients (male:female = 15:35; age, 46.2 ± 16.3 years; 17 Graves disease, 13 thyroiditis, and 20 euthyroid). All patients underwent 99mTcO4 quantitative SPECT/CT (185 MBq = 5 mCi), which yielded %thyroid uptake and standardized uptake value (SUV). Twenty-one (10 Graves disease and 11 thyroiditis) of the 50 patients also underwent conventional %thyroid uptake measurements using a TUS.
Results:
Quantitative SPECT/CT parameters (%thyroid uptake, SUVmean, and SUVmax) were the highest in Graves disease, second highest in euthyroid, and lowest in thyroiditis (P < 0.0001, Kruskal–Wallis test). TUS significantly overestimated the %thyroid uptake compared with SPECT/CT (P < 0.0001, paired t test) because other 99mTcO4 sources in addition to thyroid, such as salivary glands and saliva, contributed to the %thyroid uptake result by TUS, whereas %thyroid uptake, SUVmean and SUVmax from the SPECT/CT were associated with the functional status of thyroid.
Conclusions:
Quantitative SPECT/CT is more accurate than conventional TUS for measuring 99mTcO4 %thyroid uptake. Quantitative measurements using SPECT/CT may facilitate more accurate assessment of thyroid tracer uptake.
1. Introduction
Single-photon emission computed tomography/computed tomography (SPECT/CT) is emerging as a promising quantitative nuclear imaging tool.[1] CT-based attenuation correction, scatter correction, and resolution recovery are the mainstays that characterize modern quantitative SPECT/CT scanners, generating voxels with the unit value of radioactivity per volume (i.e., kBq/mL), which is a leap-forward in terms of objective nuclear medicine and substantially different from the unit value of counts/s from nonquantitative nuclear imaging studies.[2] Using a quantitative SPECT/CT scanner, absolute radioactivity concentration and standardized uptake value (SUV) have been reported for 99mTc-phosphonate bone SPECT/CT.[3] Furthermore, joint disease, such as temporomandibular disorder, has been successfully evaluated using the SUV derived from the quantitative bone SPECT/CT.[4] Indeed, the clinical applications of the quantitative SPECT/CT are being expanded to a variety of fields of nuclear medicine.
Technetium pertechnetate (99mTcO4) enters into thyroid follicular cells via a sodium-iodide symporter as does radioiodine,[5,6] and the percent uptake in the thyroid (%thyroid uptake) of 99mTcO4 serves as an indicator of thyroid function.[7,8] In fact, the measurement of %thyroid uptake has been used for nearly 5 decades in nuclear medicine.[9,10] The normal %thyroid uptake of 99mTcO4 has been reported to be 0.3% to 3% in high iodine-consuming countries and 1.2% to 7.0% in iodine-deficient countries.[11] This is lower than the %thyroid uptake of radioiodine, which ranges between 6% and 35% in 4 to 24 h following the administration of radioiodine.[8] The %thyroid uptake of 99mTcO4 is usually measured at the plateau phase of 15 to 30 min postinjection[11] because the initially trapped 99mTcO4 leaks out of the thyroid afterward due to the lack of an organification mechanism.[12,13] This unstable retention of 99mTcO4 is one of the main reasons why the 99mTcO4 thyroid uptake test is considered inaccurate in comparison with the radioiodine uptake test.[8,14] Another reason for the inaccuracy is related with the heterogeneity of the 99mTcO4 thyroid uptake protocol. The test can be performed using various combinations of hardware (dedicated thyroid uptake system [TUS] or planar gamma camera) and software (thigh or mediastinum for background activity correction, syringe activity or separate standard source for injected dose determination, variable injected dose [37–370 MBq = 1–10 mCi], and nonstandardized measurement time and duration).[12,15–17] As a result, the reliability of the 99mTcO4 thyroid uptake test is suboptimal.[8,14] Thus, the test is considered only useful for differential diagnosis between conditions characterized by extremely altered thyroid function, such as Graves disease and destructive thyroiditis.[11]
Nonetheless, the 99mTcO4 thyroid uptake has several advantages over the radioiodine thyroid uptake. First, more radioactivity can be injected into patients with less radiation hazard to the thyroid, enabling greater counting statistics and higher-quality scintigraphic images. Second, the 99mTcO4 thyroid uptake test takes only 15 to 30 min from injection to uptake measurement, which is shorter than the 4 to 24 h required for the radioiodine uptake test. Lastly, 99mTcO4 is the most commonly used radiotracer, and it is readily available in any department of nuclear medicine.[11]
In the present study, we attempted to apply the quantitative SPECT/CT to the measurement of 99mTcO4 %thyroid uptake. We expected that the quantitative 99mTcO4 SPECT/CT would produce more accurate measurements of 99mTcO4 %thyroid uptake than the traditional TUS-based measurements of 99mTcO4 %thyroid uptake. In addition, we investigated the potential utility of the SUV from quantitative SPECT/CT in the management of thyroid diseases.
2. Materials and methods
2.1. Patients
The present retrospective study was approved by the institutional ethical review board, and the need for patient consent was waived. From March to November 2015, 50 consecutive patients who had been referred to the Department of Nuclear Medicine of Seoul National University Bundang Hospital for the evaluation of thyroid functional status were included in the study (Table 1). Of the 50 patients, 46 had subnormal thyroid stimulating hormone (TSH) levels with elevated or normal levels of T3 or free T4, which had been previously checked at other institutions or laboratories using radioimmunoassay (RIA) or enzyme-linked immunosorbent assay, and 4 had thyroid nodules on ultrasonography. The patients complained of palpitation (12/50, 24.0%), weight loss (8/50, 16.0%), and fatigue (6/50, 12.0%). The 50 patients were finally diagnosed by the expert endocrinologist (JHM with more than 20 years of expertise) as having Graves disease (17 patients), resolving thyroiditis (13 patients), or euthyroid (20 patients) (Table 1). The differential diagnosis was based on the multitudes of clinical context, thyroid function test results, antithyroid antibodies, and 99mTcO4 thyroid planar scintigraphy. No patient had a history of medication with antithyroid agents, thyroid hormone, corticosteroid, or amiodarone. All 50 patients underwent quantitative SPECT/CT, and 21 of the 50 patients (10 Graves disease and 11 thyroiditis) also underwent the conventional thyroid uptake test.
Table 1.
Characteristics of the patients (n = 50).

2.2. Phantom study
The SPECT/CT scanner (NMCT/670, GE Healthcare, Pittsburgh, PA) was first calibrated to the dose calibrator (CRC-15R, CAPINTEC, Ramsey, NJ, the US) through a phantom study. The phantom study procedure and data are described elsewhere[4] and in the supplemental material (see Text, Supplemental Content, which describes the phantom study procedure). As a result of the triplicate phantom studies, the obtained counts/s from the quantitative SPECT/CT showed a perfect linear relationship with the 99mTcO4 activities (37, 185, and 370 MBq) (R2 = 0.9996), and the calibration factor of the SPECT/CT scanner was determined to be 275 counts/s per MBq (=10,176 counts/s per mCi) (see Fig. S1, which shows the converting processes from counts per second to decays per second).
2.3. Quantitative SPECT/CT
Quantitative SPECT/CT was performed using the same SPECT/CT scanner (NMCT/670, GE Healthcare) that had been used for the phantom study. No diet restriction was required for the patients. The 99mTcO4 activity in the syringe before injection and the remnant 99mTcO4 activity in the syringe after injection were measured using the same dose calibrator (CRC-15R, CAPINTEC) that had been used for the phantom study. Twenty minutes after 99mTcO4 injection (185 MBq = 5 mCi), in the supine head-first position, a planar image was first acquired for 1 min over the anterior neck with neck extension. Then, SPECT images over the head and neck area were acquired for 1 min using continuous scanning mode without the body contour option. The photon peak was set at 140 keV with 20% window (126–154 keV) and the scatter window was set at 120 keV with 10% window (115–125 keV). Next, spiral CT was performed using the following parameters: tube voltage of 120 kVp, tube current of 180 mA, beam collimation of 20 mm (=16 × 1.25), table speed of 37 mm/s, tube rotation time of 0.5 s, and pitch of 0.938:1. The CT scan elicited the dose-length product of 361.83 mGy-cm, yielding the CT radiation exposure of 1.12 mSv using the converting factor of 3.1 μSv/mGy-cm.[18] No contrast agent was used. CT images were reconstructed using an adaptive statistical iterative reconstruction algorithm (ASiR, GE Healthcare) into 2.5-mm-thick transaxial slices, and an image matrix of 512 × 512. SPECT images were reconstructed using the software (Volumetrix MI, GE Healthcare), which had the capabilities of CT-based attenuation correction, scatter correction, and resolution recovery. Ordered-subset expectation maximization algorithm with 2 iterations and 10 subsets was used for the reconstruction, and a postreconstruction filter (Butterworth with frequency of 0.48 and order of 10) was applied. With a zoom factor of 1.5, the slice thickness and image matrix of the SPECT images were 2.95 mm and 128 × 128, respectively.
2.4. Parameters of the quantitative SPECT/CT
The %thyroid uptake by quantitative SPECT/CT was directly obtained using dosimetry software (Dosimetry Toolkit, GE Healthcare) with the following information: the radioactivity before/after the injection and the respective measurement time, the time of administration to the patient, the time of image acquisition, and the calibration factor of the SPECT/CT scanner (275 counts/s per MBq = 10,176 counts/s per mCi). The thyroid was segmented using the CT images on the dosimetry software (Fig. 1). Regions of interest (ROIs) were manually drawn slice by slice from the upper tips to the lower poles of the thyroid on the transaxial CT images. The ROIs were immediately reflected on SPECT and SPECT/CT images. Approximately 50 transaxial ROIs were required to generate a volume of interest (VOI) that covered the whole thyroid gland volume. Then, the dosimetry software produced the %thyroid uptake measured by SPECT/CT. In addition, the following data were provided for a given VOI: total radioactivity (MBq), maximum radioactivity (MBq), and volume of the VOI (mL). The mean standardized uptake value (SUVmean) and maximum standardized uptake value (SUVmax) were calculated using the following equations:
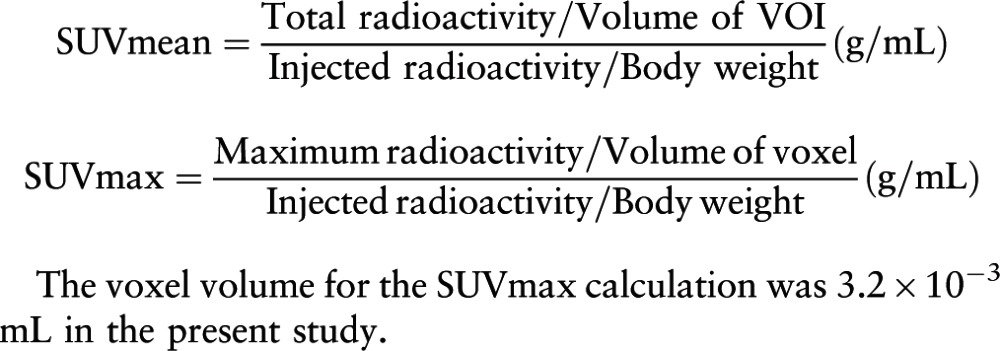 |
Figure 1.
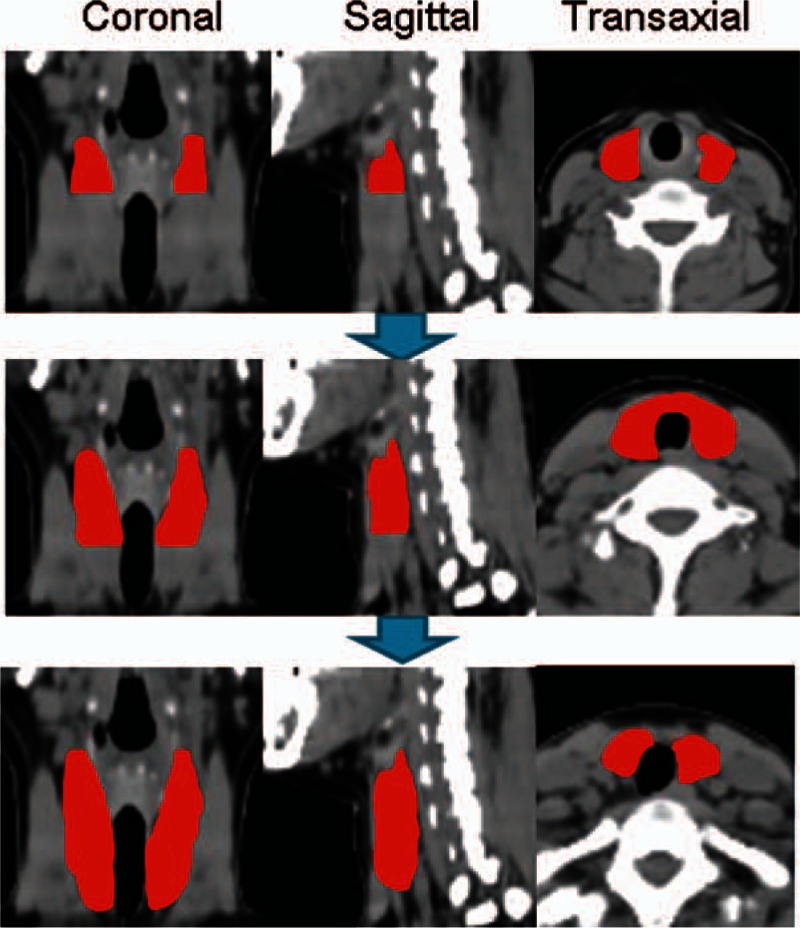
Method for segmenting the thyroid on single-photon emission computed tomography/CT. On transaxial CT images, regions of interest were drawn along the thyroid contour slice by slice from the upper tip to the lower pole to generate a volume of interest that covered the entire thyroid gland volume. CT = computed tomography.
The voxel volume for the SUVmax calculation was 3.2 × 10⁻³ mL in the present study.
2.5. %Thyroid uptake determined by the TUS
After injection of 99mTcO4 (185 MBq = 5 mCi), immediately before the SPECT/CT acquisition, %thyroid uptake was measured using a TUS (Koroid, SeYong NDC, Ltd, Seoul, Korea) equipped with a lead shield of 10th-value layer thickness (0.95 mm) for 140 keV energy photons on the aperture (see Fig. S2, which demonstrates the TUS and the SPECT/CT). The scintillation detector was located inside, 15 cm from the lead cover, and all the counting was performed at a distance of 10 cm from the source to the lead cover, maintaining a 25 cm distance between the source and the detector. The preinjection counts and the postinjection counts in the syringe were measured for 60 s each using the TUS. The syringes were placed inside the dedicated phantom. Twenty minutes post-99mTcO4 injection, prior to the SPECT/CT study, the patients sat on a chair with the neck extended, and the anterior neck counts were measured for 60 s. Next, the system measured the thigh counts as background for 60 s. The %thyroid uptake of 99mTcO4 was calculated using the following equation:
 |
2.6. Thyroid hormone and auto-antibody
Free T4 (free thyroxine) was measured using an RIA kit (IMMUNOTECH, Prague, Czech Republic), T3 (total triiodothyronine) was measured using another RIA kit (BRAHMS, Hennigsdorf, Germany), and TSH (thyrotropin) was measured using an immunoradiometric assay kit (DiaSorin, Saluggia, Italy). TSH receptor antibody was measured using a radio receptor assay kit (BRAHMS), and microsomal antibody was measured using another RIA kit (BRAHMS).
2.7. Statistical analysis
Group comparisons were performed using the chi-squared test, paired t test, or nonparametric tests such as Kruskal–Wallis test with post hoc analysis or the Mann–Whitney test. Spearman correlation coefficient (rho) was calculated. Statistical software (MedCalc version 12.4.0.0, MedCalc Software bvda) was used throughout the study. A P value of <0.05 was considered statistically significant.
3. Results
3.1. Patient characteristics
There was no significant difference in gender and age among the 3 patients groups (P > 0.05), which included 17 cases of Graves disease, 13 cases of thyroiditis, and 20 cases euthyroid (Table 1). Patients with Graves disease had the highest levels of free T4 and T3 and the lowest levels of TSH (P < 0.0001 each, Kruskal–Wallis test). All the patients with Graves disease were positive for TSH receptor antibody, and 46.2% of these patients were also positive for microsomal antibody. Patients with thyroiditis had significantly greater levels of free T4 and lower levels of TSH than the patients with euthyroid (P < 0.05 each, post hoc analysis of Kruskal–Wallis test). One patient with thyroiditis was positive for TSH receptor antibody, and 3 patients with thyroiditis were positive for microsomal antibody. The patients with euthyroid had normal thyroid hormone levels (free T4, T3, and TSH), and only 1 patient with euthyroid was positive for microsomal antibody (Table 1).
3.2. Quantitative SPECT/CT parameters according to the thyroid diseases
The %thyroid uptake by quantitative SPECT/CT was significantly different among the 3 patient groups (P < 0.0001, Kruskal–Wallis test). The value was the highest in the patients with Graves (5.28 ± 5.19%), followed by the patients with euthyroid (0.78 ± 0.50%, P < 0.05 compared to the Graves disease), and then the patients with thyroiditis (0.33 ± 0.40%, P < 0.05 compared to the euthyroid) (Fig. 2). The same trend was observed for both SUVmean and SUVmax. There were significant differences in the SUVs among the 3 patient groups (P < 0.0001, Kruskal–Wallis test). The SUVs were the greatest in the patients with Graves disease, followed by the patients with euthyroid and thyroiditis (P < 0.05 by post hoc analysis). SUVmean was 83.77 ± 52.53 for Graves disease, 33.51 ± 23.54 for euthyroid, and 11.34 ± 13.72 for thyroiditis, whereas SUVmax was 196.62 ± 118.47 for Graves disease, 45.56 ± 30.74 for euthyroid, and 26.44 ± 35.80 for thyroiditis (Fig. 2). Representative SPECT/CT images for patients with Graves disease, euthyroid, and thyroiditis are shown in Fig. 3.
Figure 2.
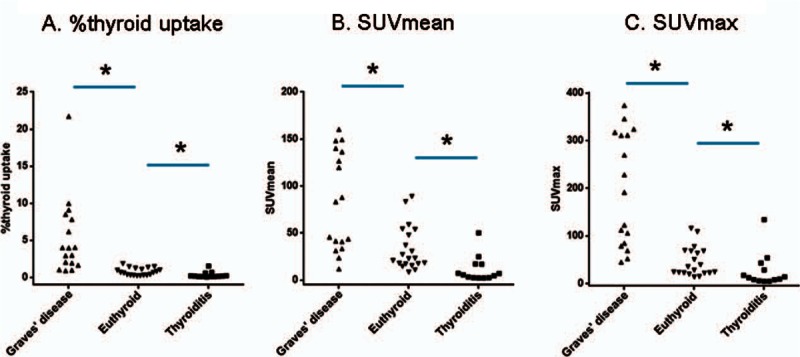
Quantitative single-photon emission computed tomography/computed tomography parameters according to the thyroid diseases. The %thyroid uptake (A), the SUVmean (B), and the SUVmax (C) were significantly different among the 3 patient groups (P < 0.0001, Kruskal–Wallis test). Patients with Graves disease had the highest values, patients with euthyroid had the second highest values, and patients with thyroiditis had the lowest values (P < 0.05 each). ∗P < 0.05. SUV = standardized uptake value.
Figure 3.
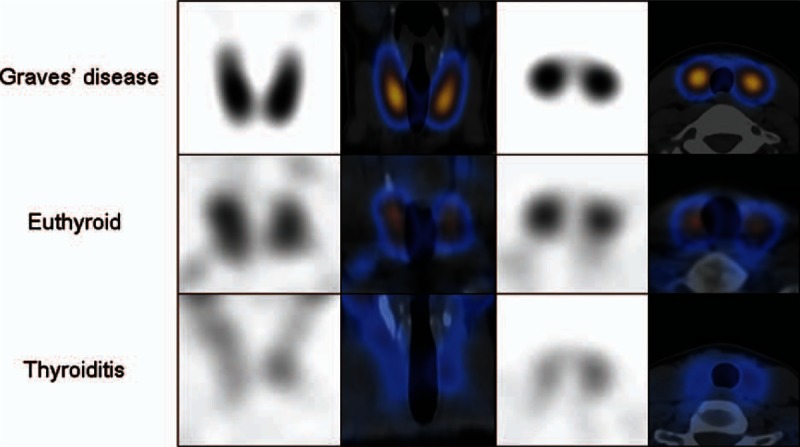
Typical SPECT/CT images of patients with Graves disease, euthyroid, and thyroiditis. The first column shows coronal SPECT, the second column coronal SPECT/CT, the third column transaxial SPECT, and the last column transaxial SPECT/CT fusion images. CT = computed tomography, SPECT = single-photon emission computed tomography.
3.3. Correlations of SPECT/CT parameters with thyroid hormone levels
Next, we investigated the correlations between SPECT/CT parameters and thyroid hormone levels. In the patients with Graves disease, the %thyroid uptake had a significant positive correlation with the free T4 level (P = 0.0184) and a marginally significant positive correlation with the T3 level (P = 0.0531, n = 16). However, there was no correlation between the %thyroid uptake and the TSH level (P = 0.2050) (Fig. 4A and Table 2). SUVmean and SUVmax were not significantly correlated with the free T4, T3, or TSH levels (P > 0.05 each) (Table 2).
Figure 4.
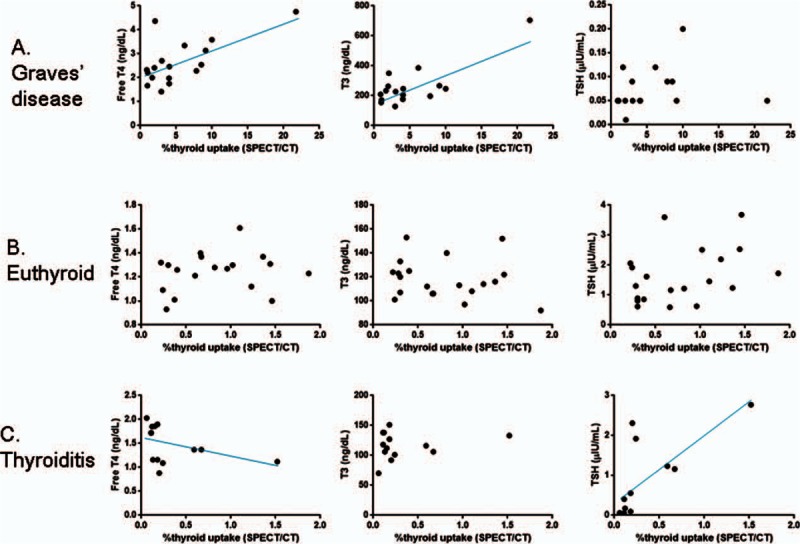
Correlations between SPECT/CT %thyroid uptake and thyroid hormone levels. (A) In patients with Graves disease, the %thyroid uptake measured by SPECT/CT had a statistically significant positive correlation with the free T4 level (P = 0.0184) and a marginally significant positive correlation with the T3 level (P = 0.0531). There was no correlation between the SPECT/CT %thyroid uptake and TSH level (P = 0.2050). (B) In patients with euthyroid, there were no correlations between SPECT/CT %thyroid uptake and thyroid hormone levels (P > 0.05). (C) In patients with thyroiditis, the SPECT/CT %thyroid uptake showed a negative correlation with the free T4 level with a statistical significance (P = 0.0243) and a positive correlation with TSH level with a statistical significance (P = 0.0032). No correlation was observed between the %thyroid uptake and the T3 level (P = 0.8754) in the patients with thyroiditis. CT = computed tomography, SPECT = single-photon emission computed tomography, TSH = thyroid stimulating hormone.
Table 2.
Correlations of SPECT/CT parameters with thyroid hormone levels.

In the patients with euthyroid, the %thyroid uptake had no significant correlations with the free T4, T3, or TSH levels (P > 0.05 each) (Fig. 4B and Table 2). However, SUVmean and SUVmax showed significant positive correlations with TSH (P = 0.0012 for SUVmean, and P = 0.0021 for SUVmax) (Table 2).
In case of thyroiditis, %thyroid uptake, SUVmean, and SUVmax showed significant negative correlations with the free T4 level (P = 0.0243 for %thyroid uptake, P = 0.0043 for SUVmean, and P = 0.0030 for SUVmax) and significant positive correlations with the TSH level (P = 0.0032 for %thyroid uptake, P = 0.0010 for SUVmean, and P = 0.0008 for SUVmax), but they did not reveal any correlation with the T3 level (P > 0.05 each) (Fig. 4C and Table 2).
3.4. Comparison of %thyroid uptake between thyroid the uptake system and quantitative SPECT/CT
Of the 50 patients in this study, 21 (10 Graves disease and 11 thyroiditis) underwent %thyroid uptake measurements using both the TUS and SPECT/CT (Fig. S2). The 2 measurement systems were compared for the %thyroid uptake. There was no significant difference in age or gender between the 2 groups: 10 Graves disease (male:female, 2:8; age, 42.5 ± 17.6 years) versus 11 thyroiditis (male:female, 3:8; age, 48.7 ± 13.5 years) (P > 0.05 each).
In these 21 patients, the %thyroid uptake by the TUS (7.85 ± 4.25%), measuring the anterior neck counts, was significantly greater than that by the SPECT/CT (2.39 ± 3.11%, P < 0.0001 by paired t test), which measured only thyroid activity (Fig. 5A). Extra-thyroid tissues (bilateral parotid glands, bilateral submandibular glands, and oral cavity saliva) were measured for their %uptake of 99mTcO4 using SPECT/CT (Fig. 5B), and the %uptakes of the extra-thyroid tissues were added to the %uptake of thyroid, yielding the summed (thyroid plus extra-thyroid tissues) %uptake of 99mTcO4 (7.17 ± 6.18%) by the SPECT/CT, which was not significantly different from the %uptake by the TUS (P = 0.2773 by paired t test) (Fig. 5A). Therefore, the thyroid and the aforementioned extra-thyroid tissues seem to account for the anterior neck counts that were measured using the TUS.
Figure 5.
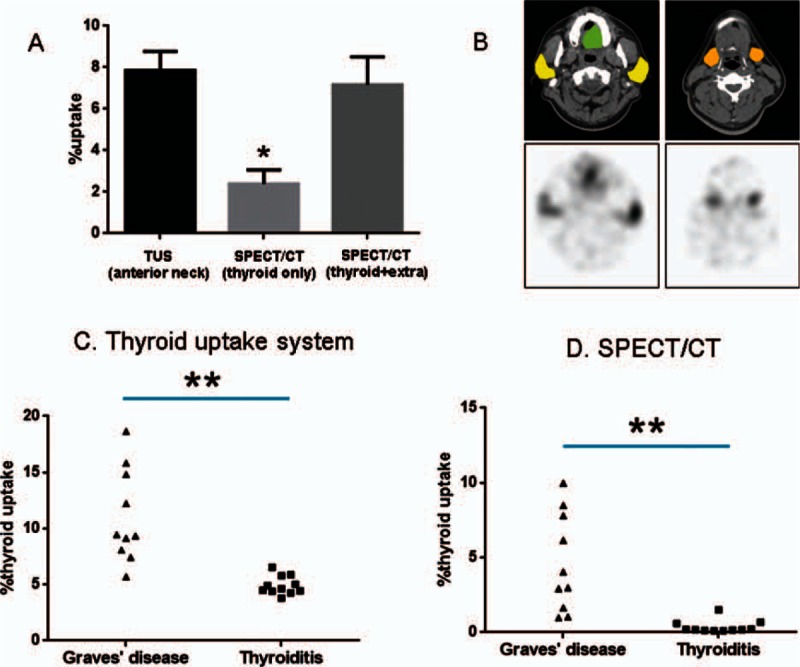
Comparison of 99mTcO4 %thyroid uptakes between the thyroid uptake system and the SPECT/CT. (A) The %thyroid uptake determined by the thyroid uptake system, reflecting the anterior neck counts, was significantly greater than that determined by SPECT/CT, which only measured thyroid activity (P < 0.0001). The summation of %uptakes from the thyroid and the extra-thyroid tissues (salivary glands and oral cavity saliva) (B) generated a summed %uptake with the SPECT/CT, which was equivalent to the %uptake determined by the thyroid uptake system (P = 0.2773). Data are mean ± standard error of the mean (∗P < 0.0001) (yellow = parotid glands, orange = submandibular glands, and green = saliva in oral cavity). %Thyroid uptakes determined by the thyroid uptake system (C) and by the SPECT/CT (D) were significantly greater in patients with Graves disease than in patients with thyroiditis (∗∗P = 0.0003). There was a systemic overestimation of %thyroid uptake by the thyroid uptake system compared with SPECT/CT. CT = computed tomography, SPECT = single-photon emission computed tomography, TUS = thyroid uptake system.
The %thyroid uptake measured by the TUS was significantly different between the 2 patient groups: 11.07 ± 4.17% for Graves disease versus 4.93 ± 0.82% for thyroiditis. Patients with Graves disease had significantly higher %thyroid uptake values compared with patients with thyroiditis (P = 0.0003, Mann–Whitney test) (Fig. 5C). A significant difference in the SPECT/CT %thyroid uptake was also observed between the patients with Graves disease (4.61 ± 3.28%) and those with thyroiditis (0.37 ± 0.43%, P = 0.0003, Mann–Whitney test) (Fig. 5D). The TUS generated systemically higher %thyroid uptake compared with the SPECT/CT.
3.5. Potential utility of SUVs in patients with a hot nodule
Three patients with an apparent hot nodule were investigated using the quantitative SPECT/CT. Two patients (no. 1 and no. 2) had a thyroid nodule detected by ultrasonography. The TSH levels were subnormal (<0.05 μIU/mL) in all the patients (Table 3). For each patient, the %thyroid uptake was measured over the whole thyroid gland, including the hot nodule and the other thyroid parenchyma (Fig. 1). For the measurement of SUVs, a spherical VOI was drawn over the hot nodule, and the same-sized VOI was applied to the contralateral parenchyma (Fig. 6). The first 2 patients (no. 1 and no. 2) had high %thyroid uptakes (3.22% and 3.33%) that were in the range of Graves disease (Fig. 2A). The SUVmean (166.03 and 188.76, respectively) and SUVmax (203.35 and 216.66, respectively) of the hot nodules of the first 2 patients were also substantially elevated in the range of Graves disease (Fig. 2B and C). Interestingly, the contralateral parenchyma showed a remarkable difference in the SUVs between patient no. 1 and patient no. 2. Patient no. 1 had a highly elevated SUVmean (114.02) and SUVmax (153.07) in the contralateral parenchyma, which were in the range of Graves disease (Fig. 2B and C), whereas SUVmean (43.07) and SUVmax (53.65) of patient no. 2 were in the range of euthyroid patients (Fig. 2B and C). The clinical symptoms, signs, and thyroid hormonal status were more toxic in patient no. 1 than in patient no. 2 (Table 3). The last no. 3 patient had euthyroidal %thyroid uptake (1.00%), upper euthyroidal SUVmean/SUVmax (92.18/105.10) in the hot nodule, and euthyroidal SUVmean/SUVmax (53.25/63.34) in the contralateral parenchyma. The no. 3 patient was asymptomatic and only free T4 level was mildly elevated (Table 3).
Table 3.
Patients with a hot nodule.
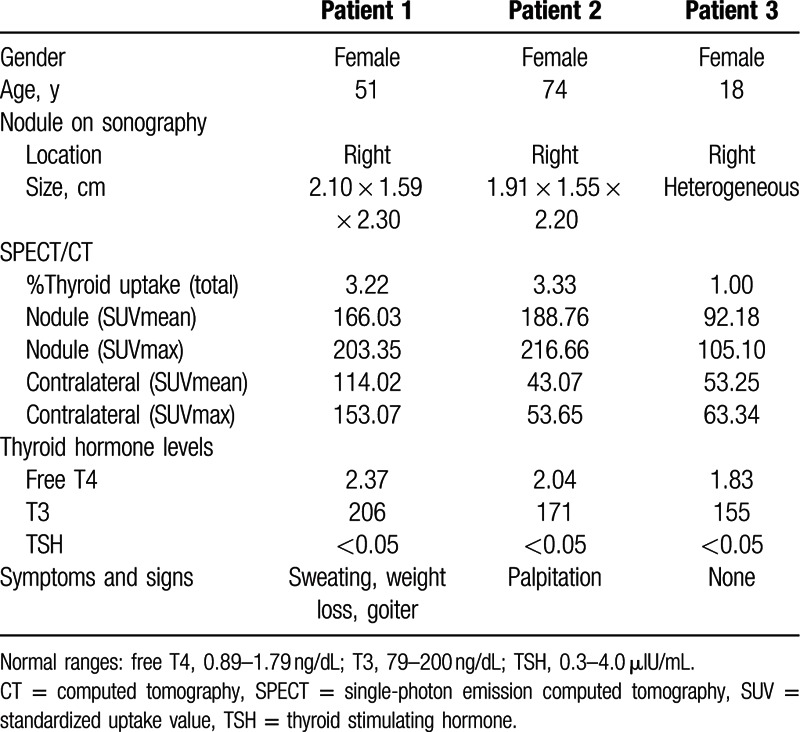
Figure 6.
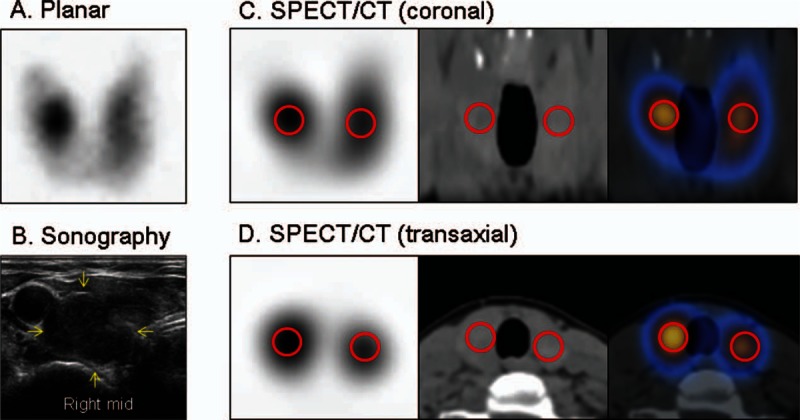
A patient with a hot nodule in the right lobe of the thyroid gland (patient no. 1 from Table 3). All the 3 patients in Table 3 showed similar pattern of hot nodule. (A) Planar scintigraphy. (B) Sonography. (C) Coronal SPECT/CT (SPECT, CT, and SPECT/CT fusion, from left to right). (D) Transaxial SPECT/CT (SPECT, CT, and SPECT/CT fusion, from left to right). Red circles denote the volumes of interest for the standardized uptake value measurements. CT = computed tomography, SPECT = single-photon emission computed tomography.
4. Discussion
The present study demonstrates that quantitative SPECT/CT is more accurate than the traditional TUS for the measurement of %thyroid uptake of 99mTcO4. The %uptake values from the quantitative SPECT/CT in the present study were quite comparable to the data found in the literature.[9,15,16,19] The quantitative SPECT/CT parameters (%thyroid uptake, SUVmean, and SUVmax) were significantly different among patients with Graves disease, euthyroid, and thyroiditis (Fig. 2). Of course, the %thyroid uptake by the TUS was also significantly elevated in the patients with Graves disease. Therefore, the TUS may still play a role in the differential diagnosis of typical Graves disease from thyroiditis (Fig. 5C). However, it is of note that there is a systemic error in the %thyroid uptake measurement using the TUS (the overestimation of %thyroid uptake) (Fig. 5A). The systemic overestimation of 99mTcO4 %thyroid uptake using the TUS could be explained by the spill-in effects of the extra-thyroidal activities such as salivary glands and saliva in the oral cavity (Fig. 5B). This is inevitable because the TUS only measures the anterior neck counts, and the true thyroid counts cannot be discriminated from other counts of neighboring salivary glands or saliva. This phenomenon may lead to the overestimation of 99mTcO4 %thyroid uptake by the TUS. Of course, this kind of error is not encountered in case of the SPECT/CT, which directly measures the thyroid activity in a 3-dimensional way using CT images for the thyroid segmentation (Fig. 1).
The advantage of the %thyroid uptake measurement using the quantitative SPECT/CT was anticipated, but the identification of new functional parameters was unexpected. SUV is the radioactivity per unit volume (as a numerator) divided by the injected radioactivity per unit weight (as a denominator).[20,21] SUVmean represents the average radioactivity in the thyroid, and SUVmax reflects the maximum radioactivity in a single voxel within the thyroid. In the present study, SUVmean and SUVmax showed comparable accuracy with the %thyroid uptake in terms of differentiation of thyroid diseases (Fig. 2). In the patients with thyroiditis, as with the %thyroid uptake, both SUVmean and SUVmax were negatively correlated with free T4 levels and positively correlated with TSH levels (Table 2), which seemed to inversely reflect the degree of thyroid gland destruction and subsequent release of thyroid hormone and responsive TSH suppression. In the present study, the euthyroid patients had normal thyroid hormone levels, but the SUVs were positively correlated with the TSH levels, which may be related to the nature of the euthyroid patients. Most of the euthyroid patients had subnormal TSH levels prior to the present SPECT/CT study, although the whole-thyroid hormone levels were normalized at the time of SPECT/CT. These patients may be categorized as “resolved” thyroiditis rather than “resolving” thyroiditis. In the circumstances of normalized free T4, T3, and even TSH, the positive correlations between the SUVs and TSH (Table 2) may be remnant evidence of past injury to the thyroid gland. The application of the SUVs to the patients with hot nodules signifies the heterogeneity of functioning thyroid tissues (Table 3). The hot nodules and contralateral thyroid tissues were heterogeneous with regard to the SUVs. Nonetheless, some insights can be derived from the quantitative SPECT/CT parameters about the clinical features of the patients with hot nodules. The combination of hyperfunctioning (with high SUVs) hot nodule and contralateral thyroid was related to the most severe case of thyrotoxicosis (no. 1 patient). The hyperfunctioning hot nodule with euthyroidal contralateral thyroid tissue was associated with less severe clinical features (no. 2 patient). An apparent hot nodule, without any evidence of hyperfunction in the nodule and the contralateral thyroid tissue as indicated by less elevated SUVs, may not seriously affect the patient (no. 3 patient). In all of these patients, the contralateral thyroid parenchyma did not appear to be suppressed in terms of the SUV. Therefore, a hot nodule may develop in the soil of hyperfunctioning thyroid tissue in some cases, which can be effectively assessed using the SUV from quantitative SPECT/CT. In addition, %thyroid uptake or SUVs may be related to the disease severity of Graves disease and the prognosis of the disease may be relevantly predicted using the SPECT/CT quantitative parameters, which is being investigated in our institute.
The clinical application of quantitative SPECT/CT is long overdue since the suggested potential usefulness has been repeatedly stated in the literature.[1,2,22,23] In the present study, the quantitative SPECT/CT proved to be more accurate than the previous gold standard test for thyroid uptake measurement. The low performance of the TUS for the 99mTcO4 %thyroid uptake measurement has been previously acknowledged in the societies of endocrinology and nuclear medicine (personal communication). To date, planar scintigraphy has played a more critical role than the %thyroid uptake in the differential diagnosis of thyrotoxicosis patients, placing more emphasis on the subjective qualitative images rather than the objective quantitative data. In the present study, we did not attempt to detract from the importance of planar scintigraphy. Indeed, planar scintigraphy may still play some important roles in the delineation of hot nodules (Fig. 6), and it remains an integral aspect of quantitative SPECT/CT studies. In the future, however, the TUS may encounter further challenge because the %thyroid uptake can be more accurately measured using quantitative SPECT/CT.
Radiation exposure is one of the concerns associated with SPECT/CT. In the present study, the estimated effective dose was 3.34 mSv (1.12 mSv for CT plus 2.22 mSv for 5 mCi of 99mTcO4),[24] which is not an unbearable radiation exposure. Furthermore, lower power X-ray CT and lower dose of 99mTcO4 may be readily applicable at no expense of quantitative accuracy.[25,26] Thus, we aim to further reduce the radiation exposure in future studies.
Limitation of the present study is the lack of head-to-head comparison between radioiodine uptake and 99mTcO4 uptake in the same patients. If the quantitative SPECT/CT technology is expanded to cover 131I or 123I in the future, the comparative study using both radioiodine and 99mTcO4 would have a greater impact in the understanding of the pros and cons of the SPECT/CT-based thyroid uptake measurement.
In conclusion, quantitative SPECT/CT could provide more accurate values of %thyroid uptake of 99mTcO4 than conventional TUS. SUVs from quantitative SPECT/CT were useful as parameters for the evaluation of thyroid functional status.
Supplementary Material
Footnotes
Abbreviations: %thyroid uptake = percentage thyroid uptake, 99mTcO4 = technetium pertechnetate, RIA = radioimmunoassay, ROI = region of interest, SPECT/CT = single-photon emission computed tomography/computed tomography, SUV = standardized uptake value, TSH = thyroid stimulating hormone, TUS = thyroid uptake system, VOI = volume of interest.
This work was supported by Basic Science Research Program through the National Research Foundation of Korea (NRF) funded by the Ministry of Education (2015R1D1A1A01059146) and by a grant (02-2015-041) from the SNUBH Research Fund.
The authors have no conflicts of interest to disclose.
Supplemental Digital Content is available for this article.
References
- 1.Bailey DL, Willowson KP. An evidence-based review of quantitative SPECT imaging and potential clinical applications. J Nucl Med 2013; 54:83–89. [DOI] [PubMed] [Google Scholar]
- 2.Ritt P, Vija H, Hornegger J, et al. Absolute quantification in SPECT. Eur J Nucl Med Mol Imaging 2011; 38 Suppl 1:S69–S77. [DOI] [PubMed] [Google Scholar]
- 3.Cachovan M, Vija AH, Hornegger J, et al. Quantification of 99mTc-DPD concentration in the lumbar spine with SPECT/CT. EJNMMI Res 2013; 3:45. [DOI] [PMC free article] [PubMed] [Google Scholar]
- 4.Suh MS, Lee WW, Kim Y-K, et al. Maximum standardized uptake value of Tc-99m HDP single-photon emission computed tomography/computed tomography for the evaluation of temporomandibular joint disorder. Radiology 2016; Mar 31:152294. [DOI] [PubMed] [Google Scholar]
- 5.Chung JK. Sodium iodide symporter: its role in nuclear medicine. J Nucl Med 2002; 43:1188–1200. [PubMed] [Google Scholar]
- 6.Chung JK, Youn HW, Kang JH, et al. Sodium iodide symporter and the radioiodine treatment of thyroid carcinoma. Nucl Med Mol Imaging 2010; 44:4–14. [DOI] [PMC free article] [PubMed] [Google Scholar]
- 7.Becker D, Charkes ND, Dworkin H, et al. Procedure guideline for thyroid uptake measurement: 1.0. Society of Nuclear Medicine. J Nucl Med 1996; 37:1266–1268. [PubMed] [Google Scholar]
- 8.Balon HR, Silberstein EB, Meier DA, et al. Society of Nuclear Medicine procedure guideline for thyroid uptake measurement: version 3.0. J Nucl Med 2006; 1–4.16391179 [Google Scholar]
- 9.Atkins HL, Richards P. Assessment of thyroid function and anatomy with technetium-99m as pertechnetate. J Nucl Med 1968; 9:7–15. [PubMed] [Google Scholar]
- 10.Atkins HL, Fleay RF. Data blending with 99mTc in evaluating thyroid anatomy by scintillation scanning. J Nucl Med 1968; 9:66–73. [PubMed] [Google Scholar]
- 11.Meller J, Becker W. The continuing importance of thyroid scintigraphy in the era of high-resolution ultrasound. Eur J Nucl Med Mol Imaging 2002; 29 Suppl 2:S425–S438. [DOI] [PubMed] [Google Scholar]
- 12.Shimmins JG, Harden RM, Alexander WD. Loss of pertechnetate from the human thyroid. J Nucl Med 1969; 10:637–640. [PubMed] [Google Scholar]
- 13.Lee WW, Lee B, Kim SJ, et al. Kinetics of iodide uptake and efflux in various human thyroid cancer cells by expressing sodium iodide symporter gene via a recombinant adenovirus. Oncol Rep 2003; 10:845–849. [PubMed] [Google Scholar]
- 14.Clerc J. Imaging the thyroid in children. Best Pract Res Clin Endocrinol Metab 2014; 28:203–220. [DOI] [PubMed] [Google Scholar]
- 15.Hoschl R, Gimlette TM. Diagnostic value of 20 minute 99m Tc pertechnetate thyroid uptake. Nucl Med (Stuttg) 1971; 10:305–315. [PubMed] [Google Scholar]
- 16.Higgins HP, Ball D, Eastham S. 20-Min 99mTc thyroid uptake: a simplified method using the gamma camera. J Nucl Med 1973; 14:907–911. [PubMed] [Google Scholar]
- 17.Sucupira MS, Camargo EE, Nickoloff EL, et al. The role of 99mTc pertechnetate uptake in the evaluation of thyroid function. Int J Nucl Med Biol 1983; 10:29–33. [DOI] [PubMed] [Google Scholar]
- 18.Christner JA, Kofler JM, McCollough CH. Estimating effective dose for CT using dose-length product compared with using organ doses: consequences of adopting International Commission on Radiological Protection publication 103 or dual-energy scanning. AJR Am J Roentgenol 2010; 194:881–889. [DOI] [PubMed] [Google Scholar]
- 19.Franken PR, Guglielmi J, Vanhove C, et al. Distribution and dynamics of (99m)Tc-pertechnetate uptake in the thyroid and other organs assessed by single-photon emission computed tomography in living mice. Thyroid 2010; 20:519–526. [DOI] [PubMed] [Google Scholar]
- 20.Park T, Lee S, Park S, et al. Value of (18)F-FDG PET/CT in the detection of ovarian malignancy. Nucl Med Mol Imaging 2015; 49:42–51. [DOI] [PMC free article] [PubMed] [Google Scholar]
- 21.Lee JH, Lee GY, Kim SJ, et al. Imaging findings and literature review of (18)F-FDG PET/CT in primary systemic AL amyloidosis. Nucl Med Mol Imaging 2015; 49:182–190. [DOI] [PMC free article] [PubMed] [Google Scholar]
- 22.Al-Jafar H, Al-Shemmeri E, Al-Shemmeri J, et al. Precision of SPECT/CT allows the diagnosis of a hidden Brodie's abscess of the talus in a patient with sickle cell disease. Nucl Med Mol Imaging 2015; 49:153–156. [DOI] [PMC free article] [PubMed] [Google Scholar]
- 23.Kumar N, Xie K, Mar W, et al. Software-based hybrid perfusion SPECT/CT provides diagnostic accuracy when other pulmonary embolism imaging is indeterminate. Nucl Med Mol Imaging 2015; 49:303–311. [DOI] [PMC free article] [PubMed] [Google Scholar]
- 24.Johansson L, Mattsson S, Nosslin B, et al. Effective dose from radiopharmaceuticals. Eur J Nucl Med 1992; 19:933–938. [DOI] [PubMed] [Google Scholar]
- 25.Zaidi H, Hasegawa B. Determination of the attenuation map in emission tomography. J Nucl Med 2003; 44:291–315. [PubMed] [Google Scholar]
- 26.Fricke E, Fricke H, Weise R, et al. Attenuation correction of myocardial SPECT perfusion images with low-dose CT: evaluation of the method by comparison with perfusion PET. J Nucl Med 2005; 46:736–744. [PubMed] [Google Scholar]
Associated Data
This section collects any data citations, data availability statements, or supplementary materials included in this article.


