Supplemental Digital Content is available in the text
Abstract
Many SLC26A4 mutations have been identified in patients with nonsyndromic enlarged vestibular aqueduct (EVA). However, the roles of SLC26A4 genotypes and phenotypes in hereditary deafness remain unexplained.
This study aims to perform a meta-analysis based on the PRISMA statement to evaluate the diagnostic value of SLC26A4 mutant alleles and their correlations with multiethnic hearing phenotypes in EVA patients.
The systematic literature search of the PubMed, Wiley Online Library, EMBASE, Web of Science, and Science Direct databases was conducted in English for articles published before July 15, 2015.
Two investigators independently reviewed retrieved literature and evaluated eligibility. Discrepancy was resolved by discussion and a third investigator. Quality of included studies was evaluated using Newcastle-Ottawa Quality Assessment Scale. Data were synthesized using random-effect or fixed-effect models. The effect sizes were estimated by measuring odds ratios (ORs) with 95% confidence interval (CI).
Twenty-five eligible studies involved 2294 cases with EVA data. A total of 272 SLC26A4 variations were found in deafness with EVA and 26 mutations of SCL26A4 had higher frequency. The overall OR was 646.71 (95% CI: 383.30–1091.15, P = 0.000). A total of 22 mutants were considered statistically significant in all ethnicities (ORs >1, P < 0.05). In particular, 8 mutants were specificity of EVA phenotypes in mutations of SLC26A4 for Asia deafness populations (ORs >1, P < 0.05), 4 mutants for Europe and North America (ORs >1, P < 0.05), and the IVS7-2A>G mutations in SLC26A4 were found to have the highest frequency in deafness individuals with EVA phenotype (62.42%). Moreover, subgroups for studies limited to cases with EVA phenotype, 11 mutants relevant risks (RRs) were P < 0.05, especially for IVS7-2A>G bi-allelic mutants assayed in a deafness population (RR = 0.880, P = 0.000). Diagnostic accuracy of SLC26A4 mutation results also identified the significant association of IVS7-2A>G (AUC = 0.99, 95% CI: 0.97–0.99) and p.H723R (AUC = 0.99, 95% CI: 0.98–1.00) detecting deafness with EVA.
To conclude, the IVS7-2A>G and H723R in SLC26A4 present a significant predicting value and discriminatory ability for clinical use on diagnosis of EVA within a deafness population.
INTRODUCTION
Hearing loss is the most common sensory deficit in humans. There have been reports revealing that severe prelingual hearing loss or profound hearing loss is mainly due to recessive inheritance, and mutations the GJB2 (DNFB1, OMIM: 121011) and SLC26A4 (DFNB4, OMIM: 600791) genes are considered to be the major contributors to recessive hereditary deafness.1,2 The SLC26A4 gene encodes an anion transporter called pendrin.3 Mutations in this gene are related to a prominent clinical characteristic of the inner ear, which radiologically manifests as enlarged vestibular aqueduct (EVA).4 EVA is most common in nonsyndromic hearing loss (NSHL) or Pendred syndrome (PS) with syndromic hearing loss (SHL). To date, more than 200 SLC26A4 mutations have been identified in patients with nonsyndromic EVA or PS (http://www.healthcare.uiowa.edu/labs/pendredandbor), including missense, frame-shift, splice-site, nonsense, and small-deletion mutations. Additionally, it is interesting to note that in the EVA patients, only 28% of the SLC26A4 mutants were detected in the French population, while 98.9% of the SLC26A4 mutants were found in the Chinese population.5,6 The variable frequencies and genotypes of SLC26A4 mutations differed in both the ethnic populations and the phenotypes. Therefore, it can be speculated that there is significant genetic heterogeneity in SLC26A4.
In the present study, we performed a comprehensive meta-analysis in terms of odds ratios (ORs) and diagnostic accuracy for mutations of SLC26A4 gene in hereditary deafness with EVA. We used data from 24 articles from Asia, Europe, and North America, including 2294 cases and 3193 controls in multiethnic cohorts.5–28 The aim of the study is to determine whether these mutations are associated with EVA. Here, we first conducted a meta-analysis on summary data from global studies on SLC26A4 mutations in hearing loss cases with EVA. Further subset analysis was also performed for different genotypes of multiethnic backgrounds. The EVA phenotype was also examined, and the objective response rate (ORR) was used to assess the effect on the association of the identified mutations with hearing loss. On the other hand, we pooled the summary receive operating characteristic curve (SROC) of the SLC26A4 mutations in the prediction of deafness with EVA, and then calculated the mutations accuracy of EVA in SHL and NSHL group. This report demonstrated a high level of accuracy for the SLC26A4 mutation assay in the diagnosis of EVA. We found that 2 mutations are present at higher frequencies which are ethnically different in the distribution of the SLC26A4 mutant alleles with EVA. We also identified associations between the mutations and deafness with EVA.
MATERIALS AND METHODS
Publication Search
A systematic literature search of the PubMed, Wiley Online Library, EMBASE, Web of Science, and Science Direct databases was conducted in English for articles published before July, 2015. The following keywords and medical subheadings were used simultaneously in each set: (“hearing loss” or “deafness” or “hearing impairment” or “epimorphosis”) and (“SLC26A4”) and (“Pendred syndrome” or “enlarged vestibular aqueduct” or “dilated vestibular aqueduct”). Alternative spellings were also considered. The authors were contacted via e-mail to obtain the relevant articles and any data needed for the meta-analysis. The literature search was performed by 2 independent researchers.
Inclusion Criteria
Eligible studies included in our meta-analysis met the following inclusion criteria: they were published in English; they were case–control studies conducted in humans; they studied sporadic deafness or probands in more than 2 deafness families; they were clinical studies evaluating SLC26A4 mutations in order to allow for an estimation of the ORs within a 95% confidence interval (CI) or to calculate the diagnostic accuracy; they reported the true positives, false positives, false negatives, and true negatives; they were not the duplicates or continued work of previous publications; and they were not review articles, abstracts, or editorial articles.
Data Extraction
The necessary data were extracted from the final eligible articles as follows: the first author, the publication year, the country of origin, the subject ethnicity, the number of cases and controls, the type of study (group of sporadic or multifamily study), the research methods, and the complete data for diagnostic meta-analysis (sensitivity [SEN] and specificity [SPE]). A flowchart describing the identifying process of the qualifying studies is presented in Figure 1. The methodological qualities of the final eligible articles were assessed using the Quality Assessment of Diagnostic Accuracy Studies 2 (QUADAS-2) score system. The QUADAS-2 tool is a combined index of the patient selection, the index test, the reference standard and the flow, and timing. It allows for the risk of bias and applicability concerns to be assessed.29
FIGURE 1.
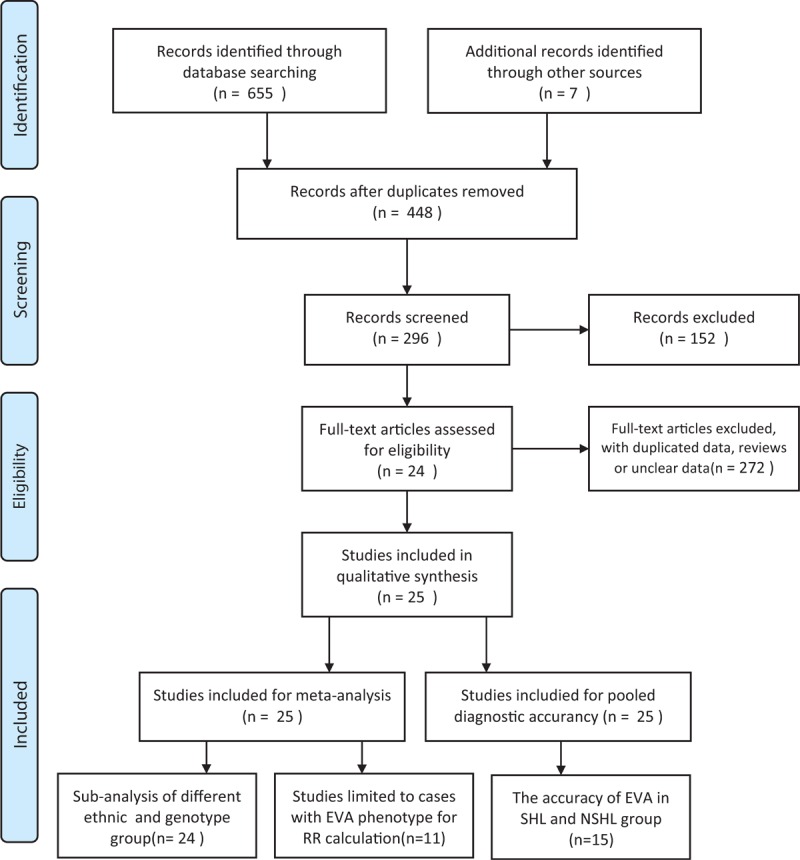
Flowchart for inclusion and exclusion of studies in the meta-analysis (see Preferred Reporting Items for Systematic Reviews and Meta-Analysis [PRISMA] 2009 Flow Diagram).
Quality Assessment
To ensure the quality of the meta-analysis, we designed and followed the guidelines of Preferred Reporting Items for Systematic Reviews and Meta-Analysis (PRISMA), Statement issued in 2009 (Checklist S1). All selected articles were scored and categorized according to the Newcastle-Ottawa Scale.30 Score ≧5 were considered to be of high quality (Table S1). Two authors (Y-JL and Q-JW) reached consensus on each other to identify eligible studies and solved disagreement by discussion. If no agreements could be reached, other authors (JY, X-GQ, and XC) would check the extracted studies again to determine their inclusion.
Statistical Analysis
We performed all statistical analyses using RevMan 5.1 (Cochrane Collaboration, Oxford, UK) and STATA 11.2 (STATA Corporation, College Station, TX). Both P values in Chi-square test and Fisher test are all presented as 2-tailed, and values <0.05 were considered statistically significant. To calculate the ORs and 95% CIs, we estimate the association between SLC26A4 mutations and deafness samples. Different SLC26A4 mutations were distributed by multiethnic. The subset analyses were performed on different Genotypes in Ethnic Groups and CT Scans Tests. Furthermore, the SEN, SPE, positive likelihood ratio (PLR), negative likelihood ratio (NLR), true positive rate, the false positive rate, and diagnostic odds ratio (DOR) of all included studies were used to plot the SROC curves and area under the SROC curve (AUC) value were calculated to assess the diagnostic accuracy.31 An AUC value close to 1.0 signifies that the test has almost perfect discrimination, and an AUC value close to 0.5 suggests that it has poor discrimination. A clinically useful test was defined to have a PLR >5.0 and an NLR <0.2. DOR is a measure of the combined SEN and SPE, which is calculated as PLR/NLR. The value of DOR ranges from 0 to infinity, with higher values indicating better discriminatory test performance.32 The interstudy heterogeneity was assessed with the χ2 and I2 statistics. The fixed-effects model (the Mantel–Haensel method) was used when absence of heterogeneity across studies was identified (P > 0.05 and I2 < 50%), unless P < 0.05 or I2 > 50% the random-effects model (DerSimonian and Laird method) was utilized.33 The evidence of a publication bias was analyzed by the Begg funnel plot and Egger test (P < 0.05 was considered a significant publication bias).34 Finally, to determine whether using the SLC26A4 mutation would result in a better prediction of patients with the EVA phenotype, we ran the algorithms of the SLC26A4 mutation detection in 2 ways: we divided the samples into groups without/with the EVA phenotype, and we then collected the data randomly from cases from different sources to perform the SLC26A4 mutation number between the “good” and “bad” samples. As a meta-analysis study, ethical approval of this work is not required.
RESULTS
Included Studies
The flow diagram of the selected eligible studies is shown in Figure 1. A total of 662 articles were identified from databases and other sources. After screening, we included 25 case–control studies from 24 articles.5–28 Table S1, shows the characteristics and quality assessments of the eligible studies published between January, 1997 and July, 2015, with Newcastle-Ottawa Scale scores greater than or equal to 5. Among these, 24 papers included were categorized as grade A. All case–control studies also met the requirements of the Hardy–Weinberg equilibrium. There were 2294 patients with hearing loss and 3193 controls available in the present meta-analysis, with the EVA data for the 25 studies were obtained from blood samples and genetic testing. Of the studies, 272 SLC26A4 variations were found in deafness with EVA (Table S2). For diagnostic accuracy, all 25 studies were included. Fifteen eligible studies were available for the stratified diagnostic analysis of genotype IVS7-2A>G and p.H723R, respectively.
Meta-Analysis of Overall Data
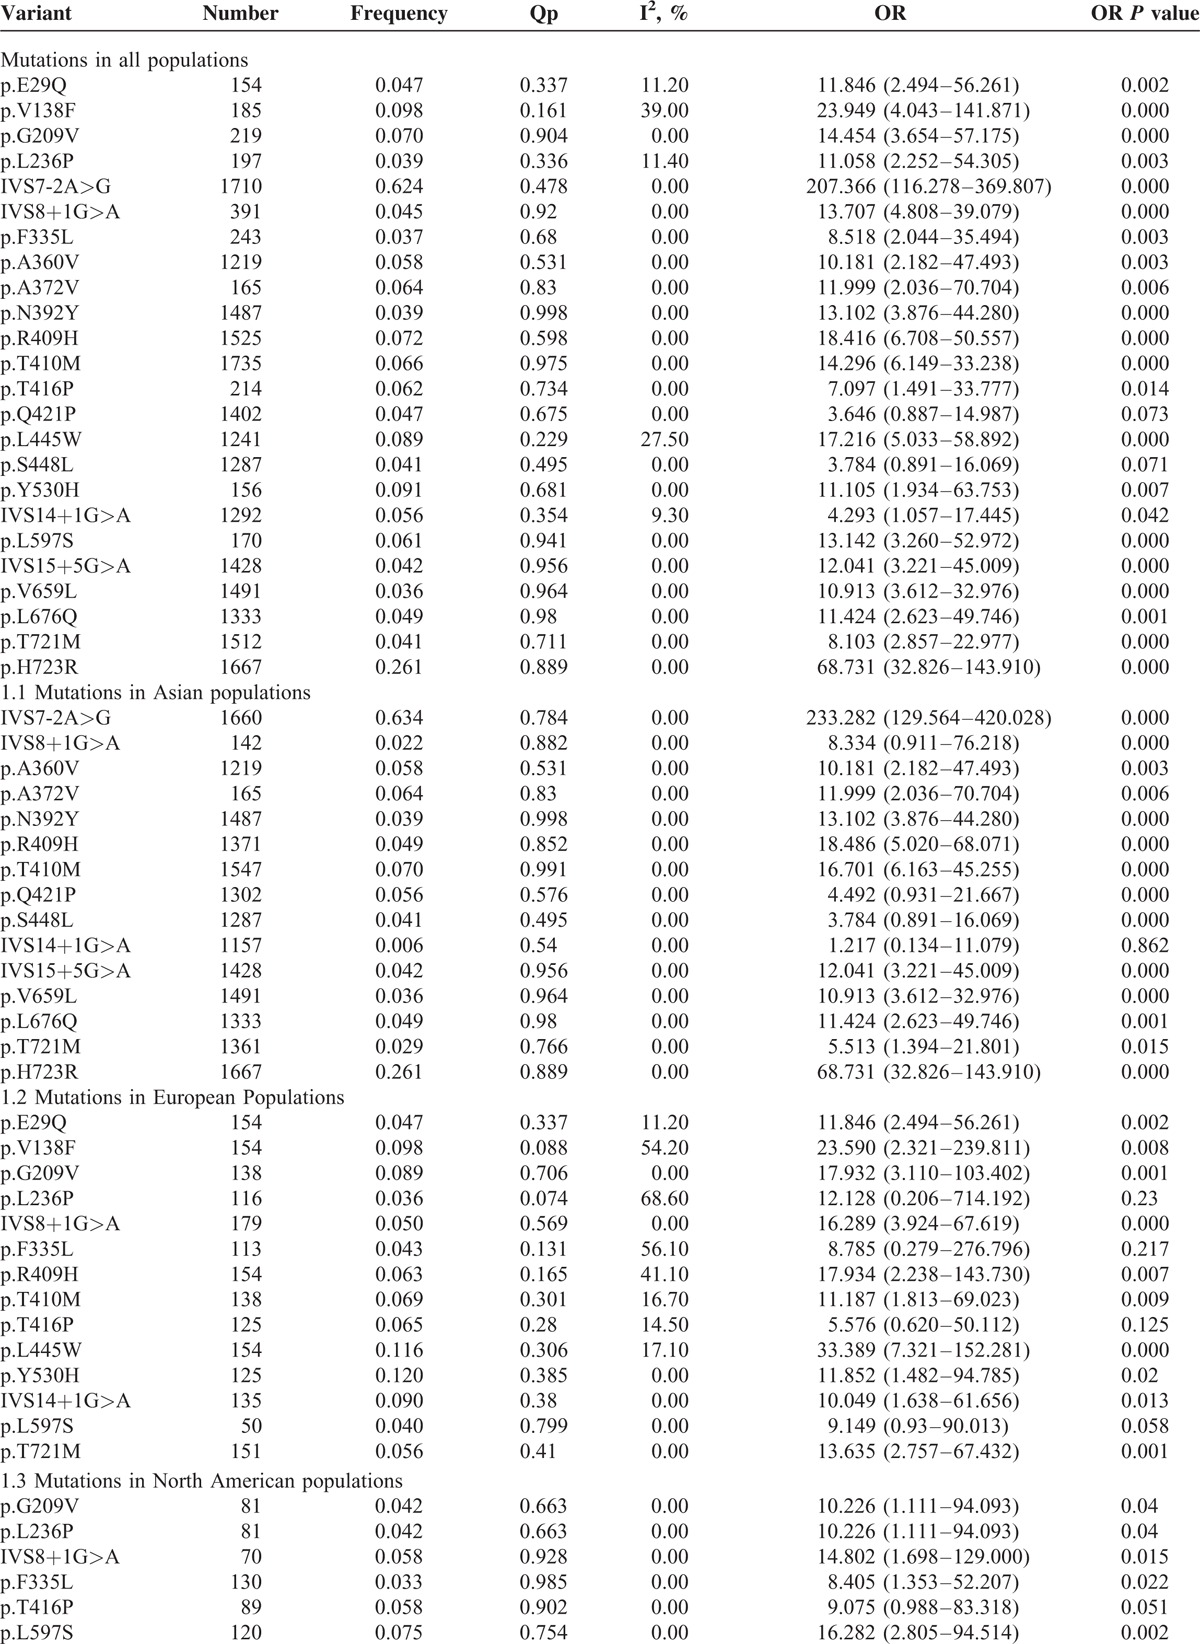
For the systematic review, we first wanted to determine the relationships between the global data available on SLC26A4 mutations and deafness. Twenty-five studies were included for a meta-analysis of ORs, no heterogeneity was found (I2 = 0%, P = 0.480); thus, a fixed effect model was applied to calculate the ORs (646.71, 95% CI: 383.30–1091.15, P = 0.000) (Fig. 2). A comprehensive analysis of SLC26A4 mutations was performed on the EVA patients. Table 1 shows the pooled results for mutations in the top of 10% mutation rate, the 24 ORs and confidence values which can be calculated in the meta-analysis combining all ethnicities (Table 1). All mutations showing significant association with hearing loss with no or low significant heterogeneity, except for p.V138F and p.L445W with moderate heterogeneity (I2 = 39.0% and 27.5%), Z test results of 22 mutation showed statistically significant (ORs >1, P < 0.05) in the overall population.
FIGURE 2.
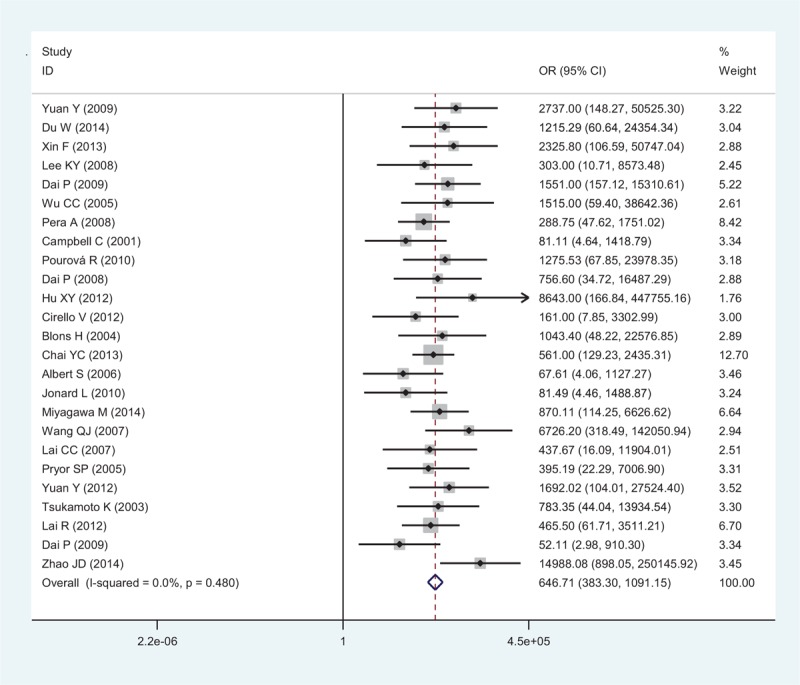
Forest plots of the SLC26A4 mutation OR on deafness individuals with EVA using the fixed effects model. The bars indicate the 95% CI of OR in patients versus controls. The areas of the squares are proportional to the weights used for combining the data. The center of the lozenge gives the combined OR. CI = confidence intervals, EVA = enlarged vestibular aqueduct, OR = odds ratio.
TABLE 1.
Variants Showing Significance for Hearing Loss
The Distribution of Different SLC26A4 Mutations in the Multiethnic
This study, 26 kinds of mutations, at the top of 10% mutation rate (Table S2), in SLC26A4 were gathered by 24 studies on the EVA patients (Fig. 3). The results indicate that different ethnic groups have different mutational hotspots. Compared to the different ethnics, IVS7-2A>G was present as the highest-frequency mutation of SLC26A4 (62.42%). The frequencies of p.H723R, p.V138F, p.Y530H, p.L445W, p.R409H, p.G209V, p.T410M, p.A372V, p.T416P, p.L597S, p.A360V, and IVS14 + 1G>A, were all above 5% and were, respectively, 26.11%, 9.76%, 9.08%, 8.91%, 7.25%, 7.03%, 6.60%, 6.41%, 6.17%, 6.12%, 5.84%, and 5.64%. p.A372V, p.A360V, p.N392Y, p.S448L, IVS15+5G>A, p.V659L, p.L676Q, and p.H723R were only found in Asia, while p.E29Q and IVS14 + 1G>A were only found in Europe. The IVS9 + 3A>G and p.Q514K with high frequents, respectively, mentioned in one study (Fig. 3).
FIGURE 3.
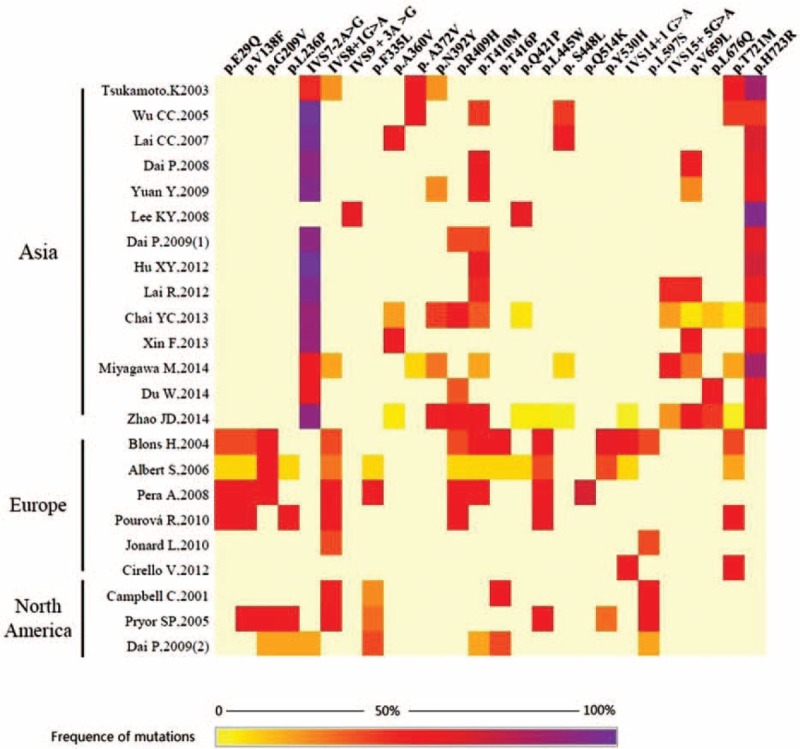
Heat maps demonstrating 26 mutations of SLC26A4, which at the top of 10% frequence in the deafness patients in the 25 included studies (the 25 included deafness studies are displayed on the Y-axis, and the types of SLC26A4 mutations are displayed on the X-axis. The color gradient represents the carrier frequence of the SLC26A4 mutations).
Subset Analysis of Different Genotypes in Ethnic Groups
As expected, we selected the subset of deafness with EVA to the identified ORs of the SLC26A4 mutations on different ethnics (Table 1). Of 26 mutations, 2 occur in only 1 study cannot be calculated the ORs, the rest 15 occur in Asian populations, 14 occur in European populations and 6 occur in North American populations. Due to the higher prevalence of deafness, the majority of genotype association studies for SLC26A4 mutations have been performed in Asia. Therefore, all 15 mutations ORs >1 and 14 of which were considered statistically significant (P < 0.05) with no heterogeneity for Asian population. In Europe, all the mutations calculated for ORs >1, among which 4 mutations (p.V138F, p.L236P, p.F335L, and p.R409H) with moderate heterogeneity (I2 = 54.2%, 68.6%, 56.1%, and 41.0%). And 4 mutations (p.L236P, p.F335L, p.T416P, and p.L597S) ORs P value were considered not statistically significant for less studies included in the analysis. In North American populations, all 6 mutations showing significant association with hearing loss with no significant heterogeneity, except for p.T416P which P value were considered not statistically significant (P > 0.05) (Table 1).
Subset Analysis on CT Scans Tests
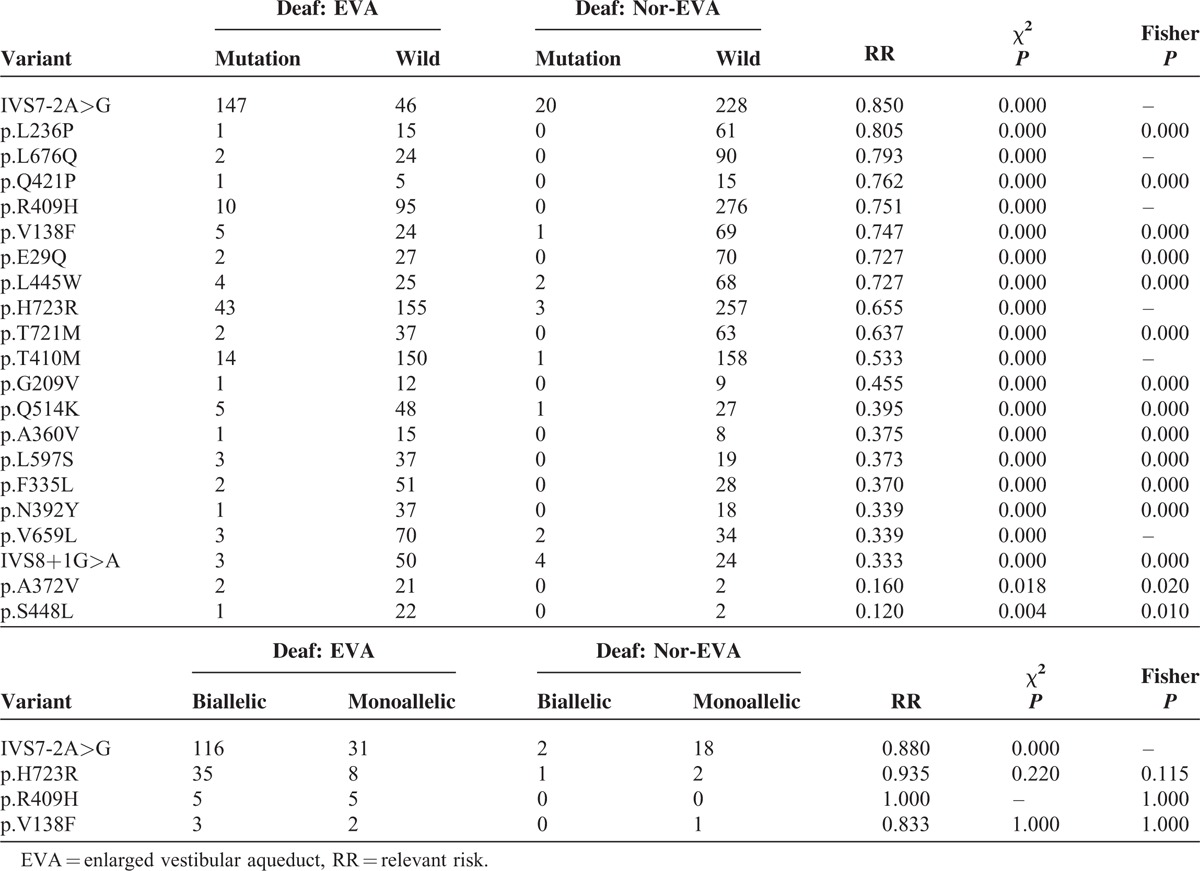
To address whether EVA phenotype affects an association between genotype and mutant alleles, studies limited to cases with EVA phenotype for RR calculation were assessed. When χ2 test and Fisher test are used to compare genotypes and mutant alleles of deaf individuals with EVA to those deaf individuals known to not have EVA, 12 SLC26A4 variants are found to have higher RR > 0.5 with a significant association (Table 2). Of these 12 mutations, the IVS7-2A>G variant has the strongest association, as well as having the highest objective response rate. As most studies do not indicate whether participants have EVA, this association was also assessed by performing the meta-analysis on deaf individuals with known CT scans compared with all normal controls. Twenty-two SLC26A4 variants were found in this analysis, all with ORs in the same direction (Table 1). IVS7-2A>G (OR = 207.366, 95% CI 116.278–369.807, P = 0.000) and p.L236P (OR = 11.058, 95% CI 2.252–54.305, P = 0.003) had the strongest associations. Biallelic (2 mutant alleles, including compound heterozygous or homozygous mutant) compared with monoallelic IVS7-2A>G mutation of the χ2 test was also significant in this analysis (P = 0.000); 18 variants including p.L236P via allele data which was not available to perform χ2 test or Fisher test. The p.H723R alleles had only been studied in Asian populations, where this variant was also significant (OR = 68.731, 95% CI 32.826–143.910, P = 0.000). The p.H723R had the strongest association with EVA (RR = 0.655). But biallelic compared with monoallelic p.H723R mutation of the Fisher test was no significant in this analysis (P = 0.115) (Table 2).
TABLE 2.
Studies Limited to Cases with EVA Phenotype
Diagnostic Accuracy of the Overall Data
Figure 4 showed SROC curve for the SLC26A4 mutation assays in the diagnosis of deafness EVA in the 25 included studies. In the graphical representation of our data, the SROC curve was positioned near the desirable upper left corner of the graph; the red point indicates the maximum joint sensitivity and specificity. As shown, the area under the curve is 1.00, indicating a high level of accuracy for the SLC26A4 mutation assays in the diagnosis of EVA. The pooled results for the overall diagnostic accuracy are listed in Table 3. The SEN was 0.995 (0.979–0.999), the SPE was 0.957 (0.922–0.977) (Fig. 5), the pooled PLR was 23.036 (12.600–42.114), the NLR was 0.005 (0.001–0.022), the DOR was 4325.898(1203.304–1.6E+04), and the AUC was 1.00 (95% CI: 0.99–1.00) and all the P value were <0.05, demonstrating that a good EVA diagnosis effect for SLC26A4 mutation assays.
FIGURE 4.
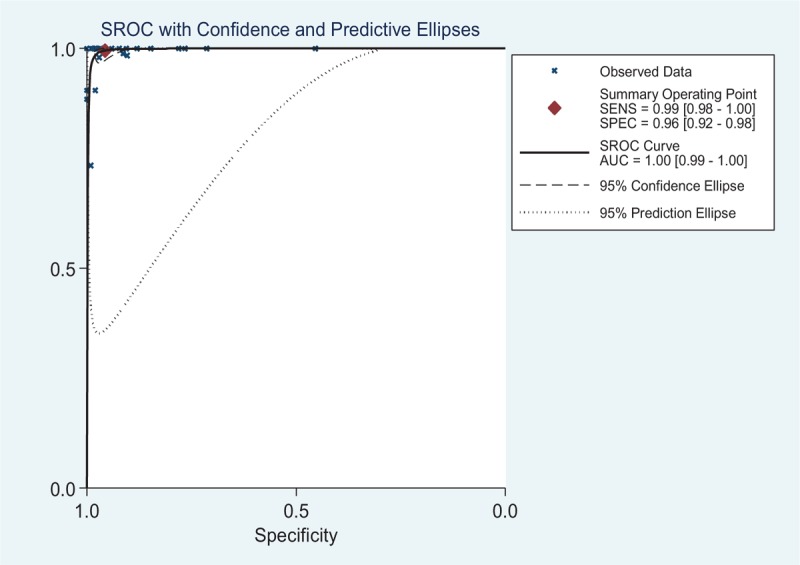
An SROC curve for the SLC26A4 mutation assays in the diagnosis of deafness EVA in the 25 included studies. Solid circles represent each study included in the meta-analysis. The size of each study is indicated by the size of the solid circle. The regression SROC curve summarizes the overall diagnostic accuracy. AUC = area under the SROC curve, EVA = enlarged vestibular aqueduct, SENS = sensitivity, SPEC = specificity, SROC = summary receiver operating characteristic curve.
TABLE 3.
Pooled EVA Diagnostic Accuracy of SLC26A4 Mutations
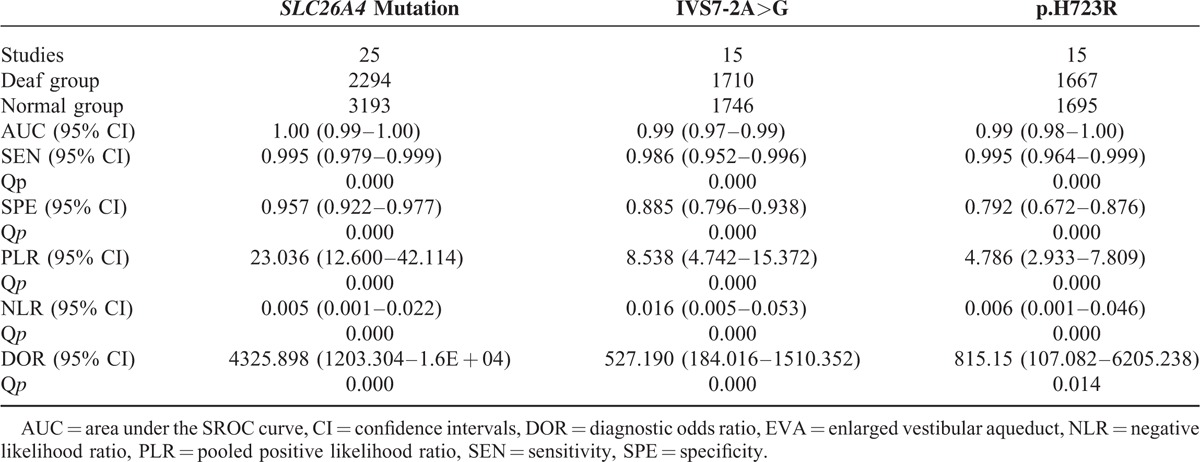
FIGURE 5.
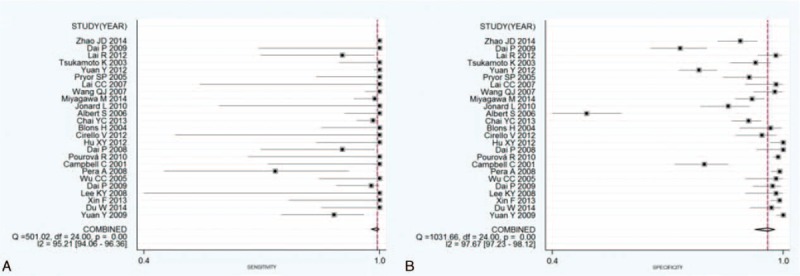
Forest plots of estimates of sensitivity and specificity for the overall SLC26A4 mutations on EVA diagnostic. The point estimates of the sensitivity (A) and specificity (B) from each study are shown as solid points. Error bars represent the 95% CI. Numbers indicated the 25 reference studies listed in Table 3. , CI = confidence interval, EVA = enlarged vestibular aqueduct.
Stratified Diagnostic Accuracy
In order to find more accurate targets, stratified diagnostic accuracy for SLC26A4 genotypes have been done. Only IVS7-2A>G and p.H723R can be used to the stratified analysis for having sufficient data (Table 3). The AUC value of IVS7-2A>G and p.H723R were 0.99 (0.97–0.99) and 0.99 (0.98–1.00). Furthermore, values of SEN, SPE, PLR NLR, and DOR for IVS7-2A>G were 0.986 (0.952–0.996), 0.885 (0.796–0.938), 8.538 (4.742–15.372), 0.016 (0.005–0.053), and 527.190 (184.016–1510.352), respectively; while for p.H723R, being 0.995 (0.964–0.999), 0.792 (0.672–0.876), 4.786 (2.933–7.809), 0.006 (0.001–0.046), 815.15 (107.082–6205.238), respectively. All the P value were <0.05, demonstrating that a good EVA diagnosis effect for IVS7-2A>G, and p.H723R assay.
To assess the accuracy of IVS7-2A>G and p.H723R detect EVA in NSHL deafness, we ran the algorithms using the 1437 NSHL deafness samples from the 10 datasets6,10–14,17,18,27,28 for the analysis of IVS7-2A>G and 1444 NSHL deafness samples from the 9 datasets for the analysis of p.H723R. The results suggested that the signatures had a high application value. By detecting IVS7-2A>G and p.H723R in SLC26A4, we were able to stratify the NSHL deafness samples into low-risk and high-risk groups. We tested the predictive performance of IVS7-2A>G, which showed a 31.47%–98.04% accuracy for the low-risk groups and an 89.47%–100% accuracy for the high-risk groups in the testing set of 2711 samples. And the predictive performance of p.H723R that showed 13.3%–98.00% accuracy for the low-risk groups and 100% accuracy for the high-risk groups in the testing set of 2617 samples (Table 4).
TABLE 4.
The Accuracy of EVA in NSHL by Detecting IVS7-2A>G and p.H723R
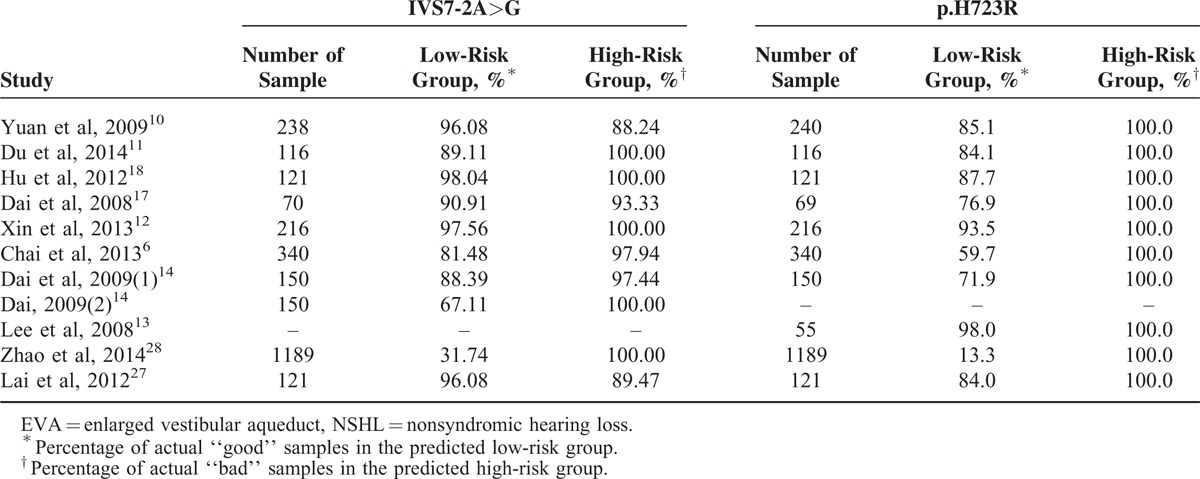
To identify the accuracy of IVS7-2A>G and p.H723R detect EVA in SHL deafness, we ran the same algorithms using the 273 SHL deafness samples from the 5 datasets.15,21–23,26 By detecting IVS7-2A>G and p.H723R, we were able to stratify the SHL samples into low-risk and high-risk groups. The results of the 5 testing cohorts also highlighted the practicability of the 2 mutations. IVS7-2A>G and p.H723R performed better in the SHL samples than the NSHL samples. By detecting IVS7-2A>G with a 68.82%–98.04% accuracy for the low-risk groups and a 100% accuracy for the high-risk groups, p.H723R with a 49.7%–90.9% accuracy for the low-risk groups and a 98.4%–100% accuracy for the high-risk groups, the both testing sets containing 745 samples (Table 5).
TABLE 5.
The Accuracy of EVA in SHL by Detecting IVS7-2A>G and p.H723R

Sensitivity Analysis and Publication Bias
Sensitivity analysis was performed to assess the stability of our study. As presented in Figure 6, no individual study dominantly influenced the overall OR. To assess possible publication bias in this study, the included studies were evaluated using Begg funnel plots and the Egger test. As shown in Figure 7, the Begg funnel plots were almost symmetrical, and the Egger regression intercept was 0.161. Thus, no evidence was found to suggest a significant publication bias in this meta-analysis.
FIGURE 6.
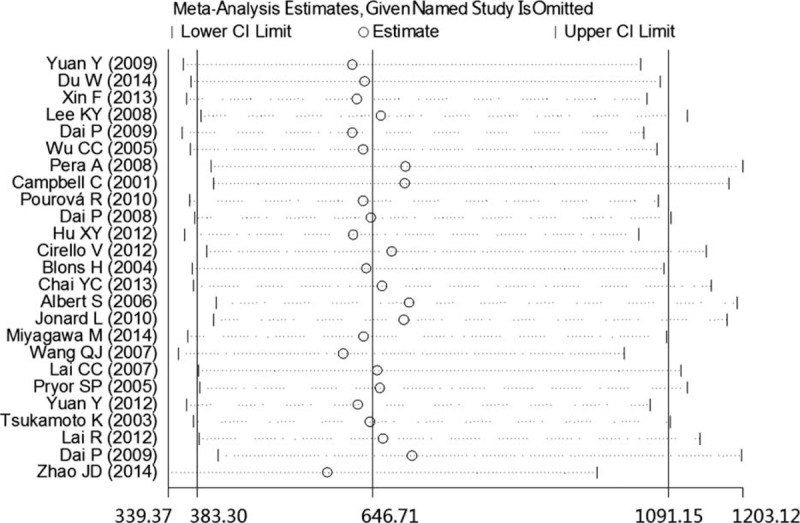
Sensitivity analysis of the pooled SLC26A4 mutation OR influence in the deafness and control groups. The results were computed by omitting each study in turn. Meta-analysis random effects estimates (in the exponential form) were used. The 2 ends of the dotted lines represent the 95% CI. CI = confidence interval, OR = odds ratio.
FIGURE 7.
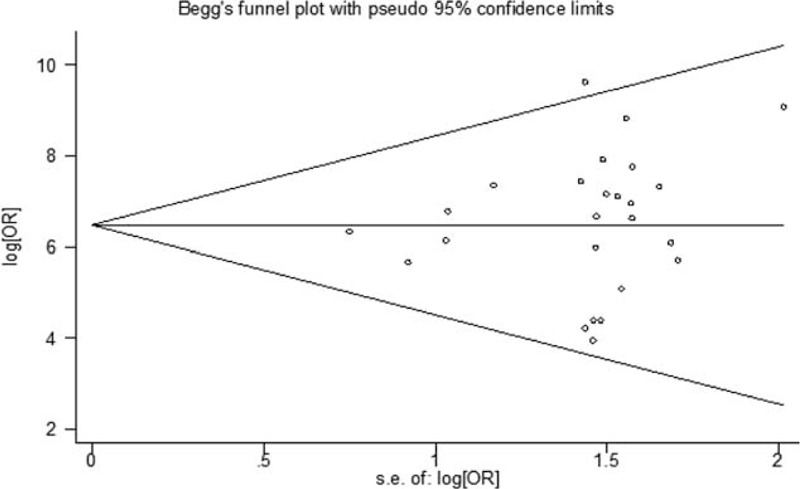
Begg funnel plots of publication bias for studies evaluating the odds ratio (OR) of the SLC26A4 mutation in deafness. Each point represents a separate study for the indicated association. Log [OR], natural logarithm of OR. The horizontal line indicates the magnitude of the effect.
DISCUSSION
The SLC26A4 mutations in hearing loss patients from around the world were found to be very diverse, with a wide mutation spectrum. The most common pathological types of mutations were reported, and ethnic specificity was present in the SLC26A4 mutations. Although different hotspots of SLC26A4 mutations were present in the different ethnic populations, NSHL with EVA or PS may be caused by the same mutation. Several studies have investigated the genotype–phenotype correlation of deafness with SLC26A4 mutations.35–40 Tsukamoto et al26 reported that 78.13% (25/32) of EVA-positive patients carried SLC26A4 mutations in the Japanese population, while 46.94% (23/49) of such patients carried mutations in the Chinese population.11 Additionally, we found that the overall mutations in the SLC26A4 gene accounted for 73.64% (648/880) of the patients with EVA. Presumably, genetic factors are involved in the pathogenesis of EVA in the multiethnic cohort. In order to obtain a confident result from the genotype–phenotype correlations in PS or nonsyndromic EVA patients with SLC26A4 mutations, we conducted meta-analysis between the SLC26A4 mutations and the deafness with EVA. The ORs of the mutations in the SLC26A4 gene with EVA were all found to be greater than 1, indicating a significant correlation between the SLC26A4 mutations and deafness with EVA. The ethnic and regional differences were always the cause for the observed heterogeneity. In the Asian population IVS7-2A>G had the highest frequency of 63.41% (OR = 233.282, P < 0.05), p.H723R had a second higher frequency of 26.11% (OR = 68.731, P < 0.05), while p.G209V was specially found in North America and Europe. Furthermore, IVS8 + 1G>A were common in Asian, North American, and European samples, and the average mutation frequencies of deafness were 2.19%, 5.79%, and 4.99.%, respectively.
According to the results of the meta-analysis by genotypes, there were 22 mutations were considered statistically significant in all ethnicities, which indicated that p.E29Q, p.V138F, p.G209V, p.L236P, IVS7-2A>G, p.F335L, p.A360V, p.A372V, p.N392Y, p.R409H, p.T410M, p.T416P, p.L445W, IVS8 + 1G>A, p.Y530H, IVS14 + 1G>A, p.L597S, IVS15 + 5G>A, p.V659L, p.L676Q, p.T721M, and p.H723R, which were all associated with EVA.
In addition, the auditory phenotype of EVA was reported to be strongly correlated with the number of SLC26A4 mutation alleles in Caucasian populations.38,39 However, in Korean populations, the auditory phenotype is more strongly associated with the type of SLC26A4 mutation than with the number of SLC26A4 mutation alleles.35 In order to better understand the correlation between type of SLC26A4 mutation and number of SLC26A4 mutation, we made the subset analysis on studies limited to cases with EVA phenotype. Ranked from high to low, IVS7-2A>G, p.L236P, p.L676Q, p.Q421P, p.R409H, p.V138F, p.E29Q, p.L445W, p.H723R, and p.T721M present RR >0.5 (Table 2). The highest objective response rate for the type of SLC26A4 mutation was IVS7-2A>G (RR = 0.850). On the other hand, biallelic mutant was more strongly associated with monoallelic mutant for IVS7-2A>G assay on EVA patients (RR = 0.880, P < 0.05). In contrast, both biallelic and monoallelic mutant have no difference for p.H723R, p.R409H, and p.V138F assay on EVA patients (RR > 0.5, P > 0.05). So above 10 types of SLC26A4 mutation are correlated with the EVA phenotype. For IVS7-2A>G assay, biallelic mutant can improve the objective response rate of EVA, while it has no difference in p.H723R, p.R409H, and p.V138F.
Until now, IVS7-2A>G and all p.H723R have been detected in Asia for both NSHL and SHL, while most of mutations have been reported in Europe and North America with inadequate data for further diagnostic accuracy. Furthermore, we pooled the overall diagnostic accuracy and subset analysis for EVA individuals with the IVS7-2A>G and p.H723R mutations. The PLR values of the IVS7-2A>G and p.H723R subgroup of the meta-analysis were 8.538 and 4.786, respectively, suggesting that deafness with IVS7-2A>G or p.H723R is approximately 8.538- or 4.786-fold more likely to be associated with EVA than the control. The NLR value of 0.016 or 0.006 in the meta-analysis means that the probability of IVS7-2A>G or p.H723R is 1.6% or 0.6% without EVA, which is low enough to rule out EVA. Furthermore, the SROC curves of p.H723R and IVS7-2A>G show that all the areas under the curve were 0.99. Both IVS7-2A>G and p.H723R had confidence P values. All the results indicated a high level of accuracy for IVS7-2A>G and p.H723R assays in the diagnosis of EVA.
As Li et al mentioned, interpatient and intradisease heterogeneity has an important role in affecting the robustness of gene signatures.41 In this study, we screened the data from randomized samples from a variety of sources to calculate the accuracy of IVS7-2A>G and p.H723R detected in EVA cases with NSHL or SHL. The results showed that this strategy was able to significantly increase the predictive accuracy, especially in high-risk groups. The predictive accuracy was 88.24%–100%, 100% in NSHL, 100%, 98.4%–100% in SHL for IVS7-2A>G and p.H723R-detected EVA, respectively.
Heterogeneity is a potential problem in interpreting the results of any meta-analysis, our meta-analysis was interpreted within the context of its limitations. In this study, 1 of the mutations in Asia ORs P value >0.05, 4 of mutations in Europe ORs P value > 0.05, 1 of the mutations in North America ORs P value > 0.05, however, the available data from Oceania and Africa were inadequate for analysis, which means that getting more ongoing studies or data in future may contribute to statistical significance in our meta-analysis.
CONCLUSIONS
In this study, we provide evidences that 22 mutations in SLC26A4 are significantly associated with EVA risk via a systematic meta-analysis. For 22 common mutations, IVS7-2A>G and p.H723R may be responsible for deafness in Asian populations, while p.G209V may be a genetic hotspot for deafness in European and American populations. Furthermore, SLC26A4 mutations are significantly associated with EVA diagnoses. Importantly, IVS7-2A>G and p.H723R may be used as a molecular target to identify deafness with EVA, especially the assay of IVS7-2A>G and its biallelic mutants can improve the objective response rate of EVA.
Supplementary Material
Supplementary Material
Acknowledgement
The authors thank the grants from the National Natural Science Foundation of China (31171217) to XC; the grants from Jiangsu Health Administration of China (LJ201120) and a Project Funded by the Priority Academic Program Development of Jiangsu Higher Education Institutions (PAPD) to GX.
Footnotes
Abbreviations: AUC = area under the SROC curve, CI = confidence interval, DOR = diagnostic odds ratio, EVA = enlarged vestibular aqueduct, NLR = negative likelihood ratio, NSHL = nonsyndromic hearing loss, OR = odds ratio, ORR = objective response rate, PLR = positive likelihood ratio, PS = Pendred syndrome, RR = relevant risk, SEN = sensitivity, SHL = syndromic hearing loss, SPE = specificity, SROC = summary receiver operating characteristic curve.
The authors thank the grants from the National Natural Science Foundation of China (31171217) to XC; the grants from Jiangsu Health Administration of China (LJ201120) and a Project Funded by the Priority Academic Program Development of Jiangsu Higher Education Institutions (PAPD) to GX.
The authors have no conflicts of interest to disclose.
REFERENCES
- 1.Prasad S, Kölln KA, Cucci RA, et al. Pendred syndrome and DFNB4-mutation screening of SLC26A4 by denaturing high-performance liquid chromatography and the identification of eleven novel mutations. Am J Med Genet A 2004; 124:1–9.(A). [DOI] [PubMed] [Google Scholar]
- 2.Usami S, Abe S, Weston MD, et al. Non-syndromic hearing loss associated with enlarged vestibular aqueduct is caused by PDS mutations. Hum Genet 1999; 104:188–192. [DOI] [PubMed] [Google Scholar]
- 3.Mount DB, Romero MF. The SLC26 gene family of multifunctional anion exchangers. Pflugers Arch 2004; 447:710–721. [DOI] [PubMed] [Google Scholar]
- 4.Hone SW, Smith RJ. Genetic screening for hearing loss. Clin Otolaryngol Allied Sci 2003; 28:285–290. [DOI] [PubMed] [Google Scholar]
- 5.Blons H, Feldmann D, Duval V, et al. Screening of SLC26A4 (PDS) gene in Pendred's syndrome: a large spectrum of mutations in France and phenotypic heterogeneity. Clin Genet 2004; 66:333–340. [DOI] [PubMed] [Google Scholar]
- 6.Chai Y, Huang Z, Tao Z, et al. Molecular etiology of hearing impairment associated with nonsyndromic enlarged vestibular aqueduct in East China. Am J Med Genet 2013; 161:2226–2233. [DOI] [PubMed] [Google Scholar]
- 7.Jonard L, Niasme-Grare M, Bonnet C, et al. Screening of SLC26A4, FOXI1 and KCNJ10 genes in unilateral hearing impairment with ipsilateral enlarged vestibular aqueduct. Int J Pediatr Otorhinolaryngol 2010; 74:1049–1053. [DOI] [PubMed] [Google Scholar]
- 8.Pera A, Villamar M, Viñuela A, et al. A mutational analysis of the SLC26A4 gene in Spanish hearing-impaired families provides new insights into the genetic causes of Pendred syndrome and DFNB4 hearing loss. Eur J Hum Genet 2008; 16:888–896. [DOI] [PubMed] [Google Scholar]
- 9.Campbell C, Cucci RA, Prasad S, et al. Pendred syndrome, DFNB4, and PDS/SLC26A4 identification of eight novel mutations and possible genotype-phenotype correlations. Hum Mutat 2001; 17:403–411. [DOI] [PubMed] [Google Scholar]
- 10.Yuan Y, You Y, Huang D, et al. Comprehensive molecular etiology analysis of nonsyndromic hearing impairment from typical areas in China. J Transl Med 2009; 7:79. [DOI] [PMC free article] [PubMed] [Google Scholar]
- 11.Du W, Cheng J, Ding H, et al. A rapid method for simultaneous multi-gene mutation screening in children with nonsyndromic hearing loss. Genomics 2014; 104:264–270. [DOI] [PubMed] [Google Scholar]
- 12.Xin F, Yuan Y, Deng X, et al. Genetic mutations in nonsyndromic deafness patients of Chinese minority and Han ethnicities in Yunnan, China. J Transl Med 2013; 11:312. [DOI] [PMC free article] [PubMed] [Google Scholar]
- 13.Lee KY, Choi SY, Bae JW, et al. Molecular analysis of the GJB2, GJB6 and SLC26A4 genes in Korean deafness patients. Int J Pediatr Otorhinolaryngol 2008; 72:1301–1309. [DOI] [PMC free article] [PubMed] [Google Scholar]
- 14.Dai P, Stewart AK, Chebib F, et al. Distinct and novel SLC26A4/Pendrin mutations in Chinese and U.S. patients with nonsyndromic hearing loss. Physiol Genomics 2009; 38:281–290. [DOI] [PubMed] [Google Scholar]
- 15.Wu CC, Chen PJ, Hsu CJ. Specificity of SLC26A4 mutations in the pathogenesis of inner ear malformations. Audiol Neurootol 2005; 10:234–242. [DOI] [PubMed] [Google Scholar]
- 16.Pourová R, Janousek P, Jurovcík M, et al. Spectrum and frequency of SLC26A4 mutations among Czech patients with early hearing loss with and without enlarged vestibular aqueduct (EVA). Ann Hum Genet 2010; 74:299–307. [DOI] [PubMed] [Google Scholar]
- 17.Dai P, Yuan Y, Huang D, et al. Molecular etiology of hearing impairment in Inner Mongolia: mutations in SLC26A4 gene and relevant phenotype analysis. J Transl Med 2008; 6:74. [DOI] [PMC free article] [PubMed] [Google Scholar]
- 18.Hu X, Liang F, Zhao M, et al. Mutational analysis of the SLC26A4 gene in Chinese sporadic nonsyndromic hearing-impaired children. Int J Pediatr Otorhinolaryngol 2012; 76:1474–1480. [DOI] [PubMed] [Google Scholar]
- 19.Cirello V, Bazzini C, Vezzoli V, et al. Molecular and functional studies of 4 candidate loci in Pendred syndrome and nonsyndromic hearing loss. Mol Cell Endocrinol 2012; 351:342–350. [DOI] [PubMed] [Google Scholar]
- 20.Albert S, Blons H, Jonard L, et al. SLC26A4 gene is frequently involved in nonsyndromic hearing impairment with enlarged vestibular aqueduct in Caucasian populations. Eur J Hum Genet 2006; 14:773–779. [DOI] [PubMed] [Google Scholar]
- 21.Miyagawa M, Nishio SY. Usami SQ and Deafness Gene Study Consortium. Mutation spectrum and genotype-phenotype correlation of hearing loss patients caused by SLC26A4 mutations in the Japanese: a large cohort study. J Hum Genet 2014; 59:262–268. [DOI] [PMC free article] [PubMed] [Google Scholar]
- 22.Wang QJ, Zhao YL, Rao SQ, et al. A distinct spectrum of SLC26A4 mutations in patients with enlarged vestibular aqueduct in China. Clin Genet 2007; 72:245–254. [DOI] [PubMed] [Google Scholar]
- 23.Lai CC, Chiu CY, Shiao AS, et al. Analysis of the SLC26A4 gene in patients with Pendred syndrome in Taiwan. Metabolism 2007; 56:1279–1284. [DOI] [PubMed] [Google Scholar]
- 24.Pryor SP, Madeo AC, Reynolds JC, et al. SLC26A4/PDS genotype-phenotype correlation in hearing loss with enlargement of the vestibular aqueduct (EVA): evidence that Pendred syndrome and non-syndromic EVA are distinct clinical and genetic entities. J Med Genet 2005; 42:159–165. [DOI] [PMC free article] [PubMed] [Google Scholar]
- 25.Yuan Y, Guo W, Tang J, et al. Molecular epidemiology and functional assessment of novel allelic variants of SLC26A4 in non-syndromic hearing loss patients with enlarged vestibular aqueduct in China. PLoS One 2012; 7:e49984. [DOI] [PMC free article] [PubMed] [Google Scholar]
- 26.Tsukamoto K, Suzuki H, Harada D, et al. Distribution and frequencies of PDS (SLC26A4) mutations in Pendred syndrome and nonsyndromic hearing loss associated with enlarged vestibular aqueduct: a unique spectrum of mutations in Japanese. Eur J Hum Genet 2003; 11:916–922. [DOI] [PubMed] [Google Scholar]
- 27.Lai R, Hu P, Zhu F, et al. Genetic diagnosis and cochlear implantation for patients with nonsyndromic hearing loss and enlarged vestibular aqueduct. J Laryngol Otol 2012; 126:349–355. [DOI] [PubMed] [Google Scholar]
- 28.Zhao J, Yuan Y, Huang S, et al. KCNJ10 may not be a contributor to nonsyndromic enlargement of vestibular aqueduct (NSEVA) in Chinese Subjects. PLoS One 2014; 11:e108134. [DOI] [PMC free article] [PubMed] [Google Scholar]
- 29.Whiting PF, Rutjes AW, Westwood ME, et al. QUADAS-2: a revised tool for the quality assessment of diagnostic accuracy studies. Ann Intern Med 2011; 155:529–536. [DOI] [PubMed] [Google Scholar]
- 30.Wells G, Shea B, O’Connell D, et al. The Newcastle OttawaScale (NOS) for assessing the quality of nonrandomized studies in meta-analyses [EB/OL]. http://www.ohri.ca/programs/clinical-epidemiology/oxford.htm (cited October 19, 2009). [Google Scholar]
- 31.Liao W, Mao Y, Ge P, et al. Value of quantitative and qualitative analyses of circulating cell-free DNA as diagnostic tools for hepatocellular carcinoma: a meta-analysis. Medicine (Baltimore) 2015; 94:e722. [DOI] [PMC free article] [PubMed] [Google Scholar]
- 32.Glas AS, Lijmer JG, Prins MH, et al. The diagnostic odds ratio: a single indicator of test performance. J Clin Epidemiol 2003; 56:1129–1135. [DOI] [PubMed] [Google Scholar]
- 33.Higgins JP, Thompson SG, Deeks JJ, et al. Measuring inconsistency in meta-analyses. BMJ 2003; 327:557–560. [DOI] [PMC free article] [PubMed] [Google Scholar]
- 34.Begg CB, Mazumdar M. Operating characteristics of a rank correlation test for publication bias. Biometrics 1994; 50:1088–1101. [PubMed] [Google Scholar]
- 35.Rah YC, Kim AR, Koo JW, et al. Audiologic presentation of enlargement of the vestibular aqueduct according to the SLC26A4 genotypes. Laryngoscope 2015; 125:E216–E222. [DOI] [PubMed] [Google Scholar]
- 36.Zalewski CK, Chien WW, King KA, et al. Vestibular dysfunction in patients with enlarged vestibular aqueduct. Otolaryngol Head Neck Surg 2015; 153:257–262. [DOI] [PMC free article] [PubMed] [Google Scholar]
- 37.Pritchett C, Zwolan T, Huq F, et al. Variations in the cochlear implant experience in children with enlarged vestibular aqueduct. Laryngoscope 2015; 25187.doi:10 1002/lary. [DOI] [PubMed] [Google Scholar]
- 38.Azaiez H, Yang T, Prasad S, et al. Genotype-phenotype correlations for SLC26A4-related deafness. Hum Genet 2007; 122:451–457. [DOI] [PMC free article] [PubMed] [Google Scholar]
- 39.Choi BY, Stewart AK, Madeo AC, et al. Hypo-functional SLC26A4 variants associated with nonsyndromic hearing loss and enlargement of the vestibular aqueduct: genotype-phenotype correlation or coincidental polymorphisms? Hum Mutat 2009; 30:599–608. [DOI] [PMC free article] [PubMed] [Google Scholar]
- 40.Yao J, Qian X, Bao J, et al. Probing the effect of two heterozygous mutations in codon 723 of SLC26A4 on deafness phenotype based on molecular dynamics simulations. Sci Rep 2015; 5:10831. [DOI] [PMC free article] [PubMed] [Google Scholar]
- 41.Li J, Lenferink AE, Deng Y, et al. Identification of high-quality cancer prognostic markers and metastasis network modules. Nat Commun 2010; 1:34. [DOI] [PMC free article] [PubMed] [Google Scholar]
Associated Data
This section collects any data citations, data availability statements, or supplementary materials included in this article.


