Abstract
The clinical prognostic significance of tumor size (Ts) in gastric cancer remains under debate. This study aims to evaluate the prognostic value of Ts in gastric cancer patients undergoing gastrectomy.
A total of 2405 patients with gastric cancer, all having received radical resection, were enrolled in this retrospective study from 2000 to 2011. Patients were categorized by minimum P value from log-rank χ2 statistics using X-tile. The relationships between Ts and other clinicopathologic characteristics were analyzed, and the survival prediction accuracy was also compared between Ts and T stage.
Patients were divided into 5 groups, according to which Ts stage and TsNM stage system were proposed. Ts, an independent prognostic factor identified by univariate and multivariate survival analysis, was significantly associated with sex, age, tumor location, macroscopic type, tumor diffferentiation, vessel invasion, perineural invasion, T stage, N stage, and TNM stage. Compared with T stage system, Ts stage system was found no superiorities in survival prediction. However, for patients with lymph node metastasis and patients with age ≥60, Ts stage system revealed a significant improvement of predictive accuracy in subgroup survival analysis. Furthermore, TsNM stage (c-index = 0.783) system was found to be superior to TNM stage (c-index = 0.743) system in prognostic prediction accuracy (P < 0.05).
Ts is significantly correlated with gastric cancer progression, which can be regarded as a reliable prognostic factor, and the TsNM stage system may improve the prognostic prediction accuracy in gastric cancer patients.
INTRODUCTION
Gastric cancer is now a common gastrointestinal malignancy in China, with the second most frequent cause of cancer-related death worldwide.1,2 The identification of its prognostic factors becomes of increasing importance in predicting and improving outcomes in patients involved. Depth of tumor invasion3 (T) and lymph node metastasis4,5 (N), as the most common prognostic indicators that have been applied in the tumor-nodes metastasis (TNM) classification by both the Japanese Gastric Cancer Association (JGCA)6 and the American Joint Committee on Cancer (AJCC),7 are obtained postoperatively by histopathologic examination of the resected specimen, making it not available for a surgeon to determine the width of safe margin and the extent of lymph node dissection during the radical operation. In this sense, tumor size (Ts), another valuable clinicopathologic feature that can be easily measured before or during radical operation, contributes to providing extremely important information for a surgeon in surgical treatment planning. The fact, however, is that, though being considered consequently as an essential prognostic factor in some solid tumors, for example, lung, breast, and liver cancer, Ts has not been included in the current staging system of gastric cancer practice guideline yet, mainly resulting from the controversy in its prognostic significance.
Recent researchers proposed for consideration of Ts prognostic evaluation in given subgroups of gastric cancer patients,8–15 while some studies persisted that it was not an independent prognostic factor.4,16 It is highly necessary to clarify the prognostic role of Ts in gastric cancer and to determine its potential value. Therefore, we retrospectively analyzed the impact of Ts on the prognosis of 2405 patients with gastric cancer.
PATIENTS AND METHODS
Patients
The West China Hospital Research Ethics Committee approved the retrospective analysis of anonymous data involved in this study. Written informed consent was not obtained but patient records were anonymized and deidentified prior to analysis.
From January 2000 to October 2010, a total of 3037 patients with gastric cancer who received gastrectomy at the Department of Gastrointestinal Surgery, West China Hospital, were retrospectively assessed in this study. Patients were included on the conditions that: they were clearly diagnosed with primary gastric cancer before surgery; pathological examination confirmed that they had received R0 resection,6 a curative resection with negative residual margins; there were no preoperative distant metastases; tumor sizes were clearly recorded. Patients were excluded if they had any of the following situations: with an earlier history of gastrectomy; with any preoperative chemotherapy or radiotherapy; with multiple stomach tumors; with another malignancy or any other life-threatening diseases diagnosed during 3 years prior to the operation; death due to postoperative complications in hospital. Finally, 2405 patients were enrolled in this study with those criteria above. Of these patients, 2152 enrolled from the year 2000 to 2009 were regarded as the training set, while 253 patients from December 2009 to October 2010 were used as a validation set.
Surgical Management
Curative gastrectomy and lymphadenectomy were performed to all of the patients according to Japanese Classification of Gastric Carcinoma (2nd English edition)17 by JGCA. All the operations were performed by an expertise of surgeons specialized in gastrointestinal surgery and expert surgeons routinely checked out lymph nodes from the excised specimens as much as possible after operation. The TNM stage of each tumor was assessed on the basis of the 7th edition of AJCC TNM staging criteria.7
Tumor size, defined as the maximum tumor diameter, was measured by opening the stomach specimens along the greater curvature, or along the lesser curvature if the tumor was located in the greater curvature. The opened stomach specimen was placed on a flat board with the mucosal side up and the maximum tumor diameter was measured and used in the analysis.
Definition of Ts Stage and TsNM Stage
According to the 4 cutoff points determined by X-tile, tumor size (Ts) was divided into 5 subgroups: Ts1 (≤2.5 cm), Ts2 (2.5–4.5 cm), Ts3 (4.5–7.5 cm), Ts4 (7.5–10.0 cm), Ts5 (>10.0 cm), defined as Ts stage, corresponding to T1, T2, T3, T4a, and T4b in T stage, respectively. The TsNM stage system was designed as combination of the Ts stage, N stage, and M stage system including the 7th edition N stage and M stage of TNM stage system.
Gastric cancer progression in the present study is characterized by aggressive tumor behaviors, such as deep tumor invasion, high rate of lymph node metastasis and high tumor grade, and increased growth speed, which are universally regarded to be associated with disadvantages in survival.
Clinicopathologic Characteristics Analysis
The clinicopathologic factors such as sex, age, tumor size, tumor location, macroscopic type, tumor differentiation, vessel invasion, perineural invasion, T stage, N stage, and TNM stage were collected from the database and compared during the 5 Ts subgroups.
Follow-Up
All patients, after undergoing curative resection of gastric cancer, were periodically followed up by letters, telephone interviews, and outpatient visits as well. The follow-up was every 3 months during the first 2 postoperative years, every 6 months after the second year, and all surviving patients were followed annually thereafter until death. The survival time was defined as the time from the date of surgery to the last contact time, October 2015, or the date of death. Of the 2405 patients, 2118 (88.07%) were followed up.
Statistical Analysis
Optimal cutoff points of Ts for survival were determined by minimum P value from log-rank χ2 statistics using the X-tile program.18χ2 test in the SPSS version 17.0 was performed to evaluate differences in proportions, whereas the Mann–Whitney U test was applied to analyze continuous variables. Logistic regression analysis was used to evaluate the risk factors for tumor size, while Spearman correlation analysis was applied to analyze the multicollinearity for tumor size. Univariate and multivariate survival analyses were performed by Cox's proportional hazard regression model with conditional backward stepwise. The overall survival rates were calculated using the Kaplan–Meier method,19 with subgroups compared by the log-rank test through GraphPad Prism 5. Comparisons between the different stage systems for the prognostic prediction were performed with the rcorrp.cens package in Hmisc in R (version 3.9-2. http://www.R-project.org/.) and were evaluated by the concordance index (C-index). The larger the C-index, the more accurate was the prognostic prediction.20 A P value of <0.05 (2 side) was defined to be statistically significant.
RESULTS
Tumor Size Distribution and Optimal Cutoff Values
In the 2405 patients, tumor size ranged from 0.5 to 21.0 cm, with a median of 5.00 cm and a mean of 5.02 + 2.80 cm (Fig. 1A). X-tile plots, constructed in Figure 1B, indicated that the maximum of χ2 log-rank value of 160.8 was produced applying 4.5 and 7.5 cm as cutoff values to divide the cohort with the strongest discriminatory capacity. On the basis of the 2 cutoff values, we found another 2 cutoff values, 2.5 and 10.0 cm, corresponding to the maximum of χ2 log-rank value of 181.0 (P < 0.001). As a consequence, Ts in the training set was divided into 5 subgroups: Ts1 (≤2.5 cm), Ts2 (2.5–4.5 cm), Ts3 (4.5–7.5 cm), Ts4 (7.5–10.0 cm), Ts5 (>10.0 cm), defined as Ts stage.
FIGURE 1.
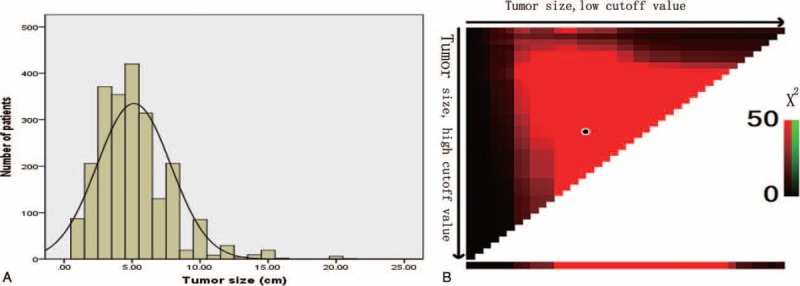
A, The distribution of number of patients related to tumor size. Tumor size ranged from 0.5 to 21.0 cm, with a median of 5.00 cm and a mean of 5.09 ± 2.70 cm. B, X-tile plots for tumor size constructed by patients enrolled in this study. The plots show the X2 log-rank values produced, dividing them into 3 groups by 2 cutoff points. The brightest pixel represents the maximum X2 log-rank value (160.8) generated by the cutoff value (4.5 cm, 7.5 cm) as marked by the black spot.
To show how much improvement was gained by choosing these 4 cutoff values in our study, we also applied the cutoff values of 3.0, 6.5, 9.0, and 12.0 cm reported recently13 to create a new divided subgroup model, producing a new c-index 0.607 which was far less accuracy in survival prediction than 0.645 produced in the present study (P < 0.05).
Clinicopathologic Characteristics and Correlation Analysis
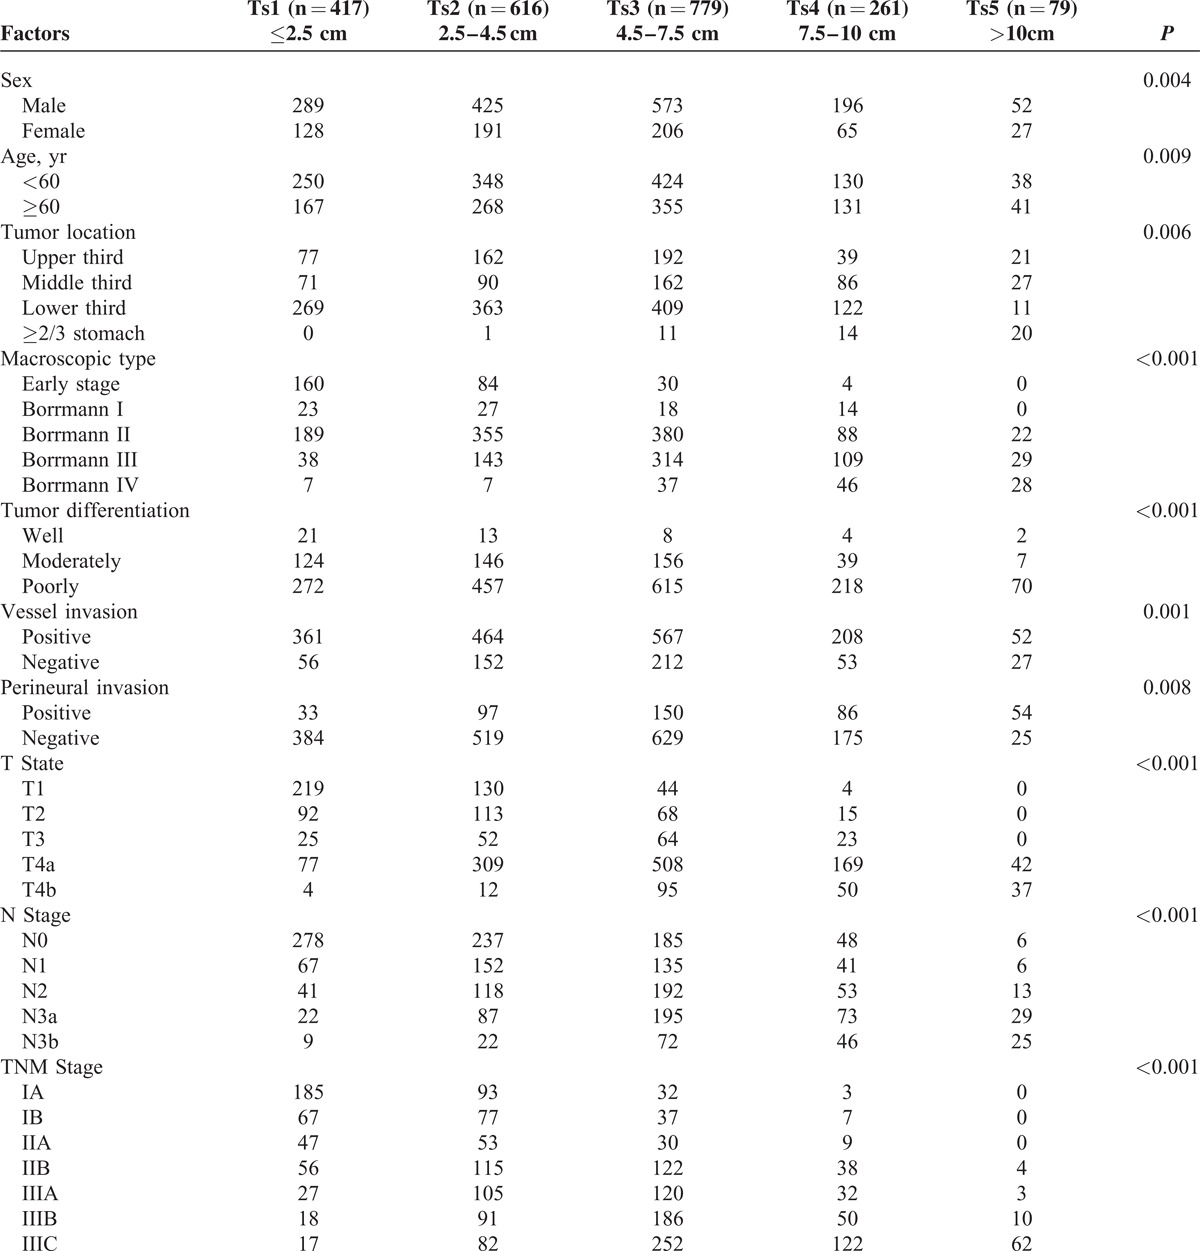
Clinicopathologic characteristics were compared among the 5 Ts subgroups, as shown in Table 1. Ts was significantly associated with sex (P = 0.004), age (P = 0.009), tumor location (P = 0.006), macroscopic type (P < 0.001), tumor differentiation (P < 0.001), vessel invasion (P = 0.001), perineural invasion (P = 0.008), T stage (P < 0.001), N stage (P < 0.001), and TNM stage (P < 0.001). Compared with the small tumor sized patients, patients with larger tumor size were found more frequently in male and in the age of ≥60 years, having a higher proportion in Borrmann type III or IV, in poor differentiation and in positive vessel and perineural invasion.
TABLE 1.
Correlation Between Tumor Size and Clinicopathologic Factors
As demonstrated in Table 2, logistic regression analyses were performed to determine the risk factors for tumor size. In the univariate analyses, the involved variables significantly consisted of clinicopathologic factors: sex (OR = 0.810, P = 0.028), age (OR = 0.814, P = 0.018), macroscopic type (OR = 2.578, P < 0.001), tumor diffferentiation (OR = 1.387, P < 0.001), vessel invasion (OR = 1.412, P = 0.001), perineural invasion (OR = 1.107, P = 0.012), T stage (OR = 2.434, P < 0.001), and N stage (OR = 1.805, P < 0.001). Multivariate regression model suggested that macroscopic type (OR = 1.588, P < 0.001), T stage (OR = 1.956, P < 0.001), and N stage (OR = 1.305, P < 0.001) were independent risk factors for Ts.
TABLE 2.
Logistic Regression Analysis of the Risk Factors for Tumor Size

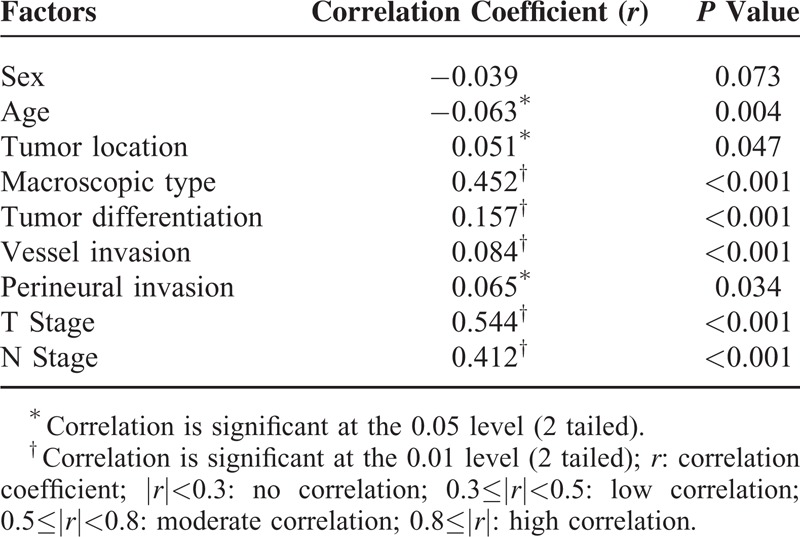
To evaluate the multicollinearity between Ts and other factors, spearman correlation analyses in Table 3 showed that T stage was moderately correlated with Ts (r = 0.544, P < 0.001), whereas N stage (r = 0.412, P < 0.001) and macroscopic type (r = 0.452, P < 0.001) showed a low correlation. However, there existed no correlation in other clinicpathologic factors, such as age (r = −0.063), sex (r = −0.039), tumor location (r = 0.051), tumor differentiation (r = 0.051), and vessel invasion (r = 0.084) as well as perineural invasion (r = 0.065).
TABLE 3.
Spearman Correlation Analysis of the Multicollinearity for Tumor Size
Univariate and Multivariate Analyses of Factors Associated With Patient Prognosis
The overall 5-year survival rates for all patients and 5 subgroups were 55.4%, 80.5%, 68.2%, 57.4%, 49.3%, and 31.8%, respectively, and this difference was statistically significant (χ2 = 181.0, P < 0.001; Table 4). As illustrated in Table 4, in addition to Ts, Kaplan–Meier analysis suggested that clinicopathologic factors including sex, age, tumor location, macroscopic type, tumor differentiation, vessel invasion, perineural invasion, T stage, N stage, and TNM stage were significant prognostic factors. The same results were also found by univariate analysis with Cox regression model in Table 5. Multivariate analysis by Cox regression showed that only age (HR = 0.752, P < 0.001), Ts (HR = 1.290, P = 0.002), T stage (HR = 1.304, P < 0.001), and N stage (HR = 1.387, P < 0.001) were independent prognostic factors of overall survival for patients with gastric cancer.
TABLE 4.
Kapplan–Meier Survival Analysis of the Patients’ Clinicopathologic Factors
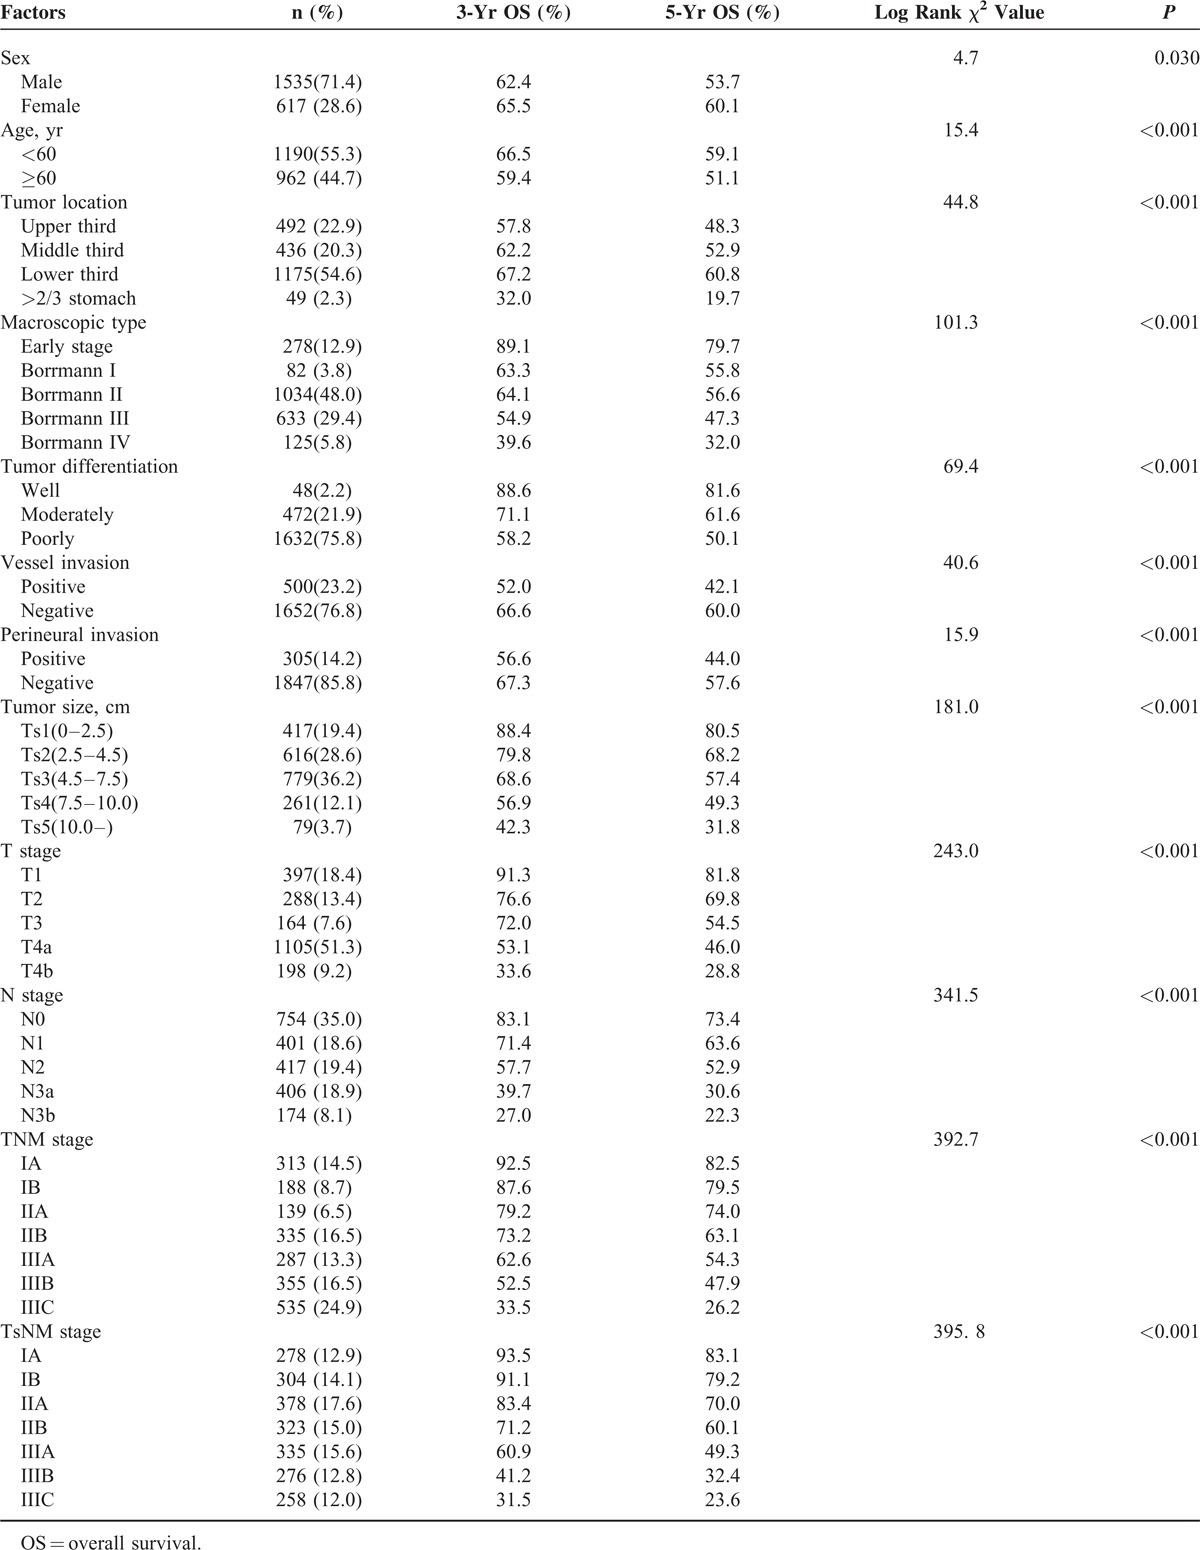
TABLE 5.
Univariate and Multivariate Analyses of the Patients’ Clinicopathologic Factors by Cox Regression Model

Comparison of Subgroup Survival Analysis Between T and Ts Stage
In training set, comparative accuracies of survival curves in Figure 2 showed that Ts stage model (c-index = 0.693, Figure 2A) was found no significant superiorities to T stage (c-index = 0.684, Figure 2B) in prognostic prediction (P > 0.05), while TsNM stage (c-index = 0.783, Figure 2C) revealed to be advantageous to TNM stage (c-index = 0.743, Figure 2D) in survival prediction accuracy (P < 0.05). Besides, with the stratified analysis, we found that overlapping survival curves were in the TNM stage system but not in the TsNM stage system and that no significant survival difference between stages IA and IB (P = 0.377), stages IIA and IB (P = 0.188), stages IIB and IIA (P = 0.081) existed in the TNM stage system.
FIGURE 2.
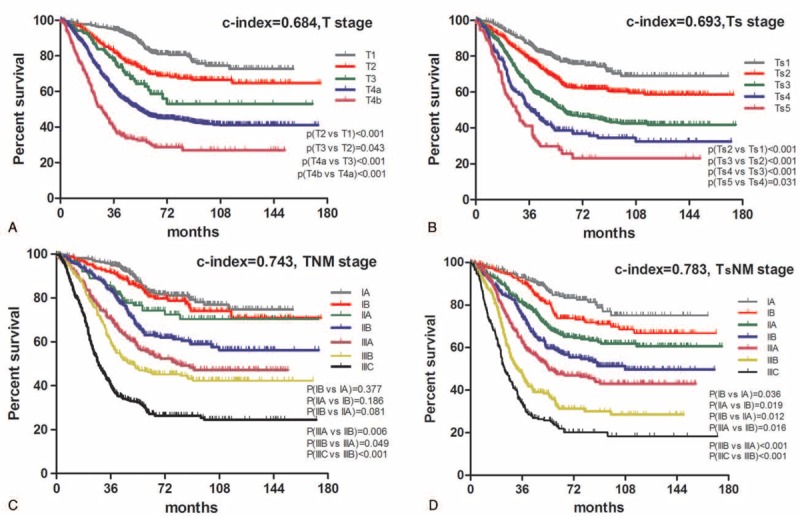
Comparative accuracies of survival analysis. A, Survival curve of patients according to subgroups of T stage. B, Survival curve of patients according to subgroups of Ts stage. C, Survival curve of patients according to subgroups of TNM stage. D, Survival curve of patients according to subgroups of TsNM stage. The significance of difference between survival curves was determined by the log-rank test.
Kaplan–Meier survival curves in Figure 3C and D demonstrated that, for patients with positive lymph node metastasis (N+), the Ts stage system with a c-index of 0.671 revealed significant improvement than the T stage system with a c-index of 0.652 (P < 0.05). However, there was no significant difference existing between these 2 stage systems for patients with negative lymph node (N0) metastasis (c-index of Ts vs T = 0.669 vs 0.662, P > 0.05) despite a slight increase of c-index (Fig. 3A and B). We also found that there was no difference between T3 and T2 in the T stage system with N+ patients (P = 0.307) in Figure 3C by log-rank test.
FIGURE 3.
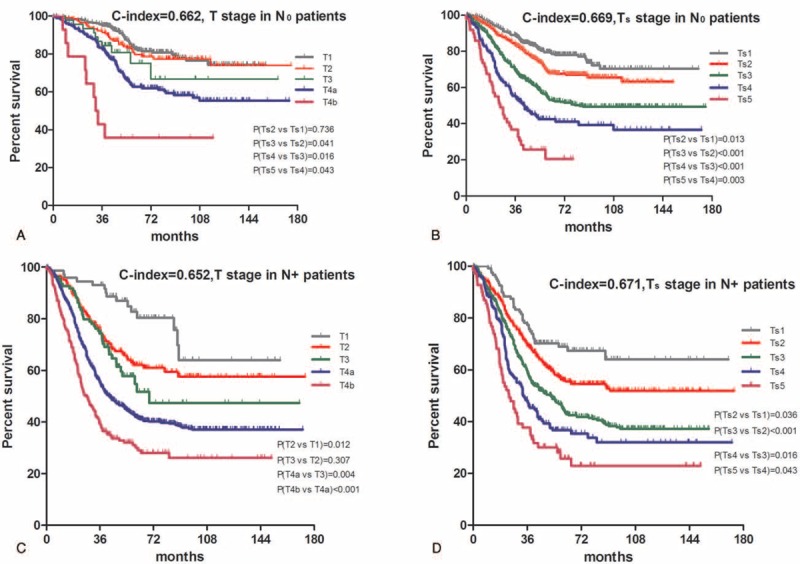
Comparative accuracies of survival analysis between T and Ts stages in terms of the lymph node status. A, Survival curve of patients with negative lymph node metastastis (N0) according to subgroups of T stage. B, Survival curve of patients with negative lymph node metastastis (N0) according to subgroups of Ts stage. C, Survival curve of patients with positive lymph node metastastis (N+) according to subgroups of T stage. D, Survival curve of patients with positive lymph node metastastis (N+) according to subgroups of Ts stage. The significance of difference between survival curves was determined by the log-rank test.
Ts stage (c-index = 0.645, Figure 4B) showed significant superiority to T stage (c-index = 0.630, Figure 4A) for patients with age ≥60 (P < 0.05) and that no such difference was found for patients with age <60 (c-index of Ts vs T = 0.655 vs 0.652, P > 0.05, Figure 4C and D). Furthermore, overlapping survival curves were also found in patients both with age ≥60 and <60 in the T stage system, and in patients with age <60 in the Ts stage system. Log-rank test revealed that survival difference did not exist between stages T4a and T3 (P = 0.164, Figure 4A), stages T2 and T3 (P = 0.853, Figure 4C), stages Ts3 and Ts4 (P = 0.064, Figure 4D), stages Ts4 and Ts3 (P = 0.074, Figure 4D).
FIGURE 4.
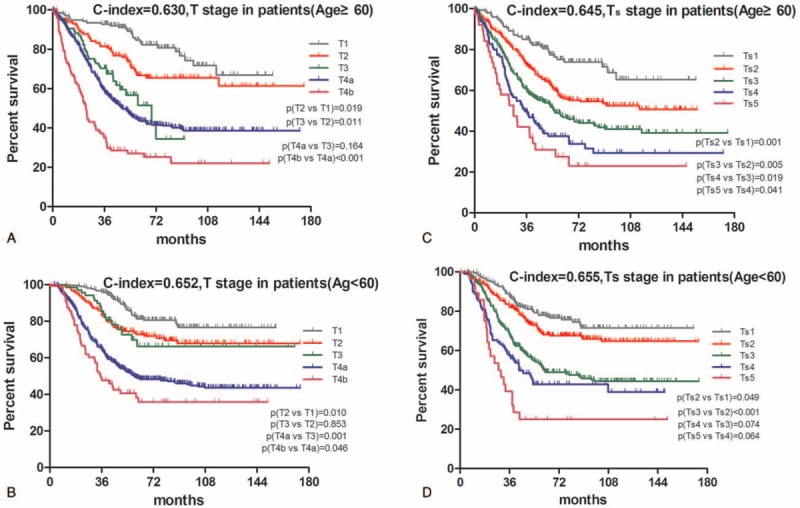
Comparative accuracies of survival analysis between T and Ts stages in terms of age. A, Survival curve of patients with age ≥60 according to subgroups of T stage. B, Survival curve of patients with age ≥60 according to subgroups of Ts stage. C, Survival curve of patients with age <60 according to subgroups of T stage. D, Survival curve of patients with age <60 according to subgroups of Ts stage. The significance of difference between survival curves was determined by the log-rank test.
We applied the TsNM stage system in the validation set, found that TsNM (c-index = 0.776) showed significant superiority to TNM (c-index = 0.744) stage system (P < 0.05). There was no significant difference of C-index between Ts and T stages (P > 0.05). However, Ts stage revealed superiority to T stage for patients with positive lymph node metastasis (c-index of Ts vs T, 0.681 vs 0.665, P < 0.05) and with age ≥60 (c-index of Ts vs T, 0.661 vs 0.645, P < 0.05). All of these validations were consistent with the results in the training set.
DISCUSSION
Ts has been already integrated into the TNM classification for some malignancies, for example, liver cancer, breast cancer, and lung cancer; however, it is unclear as to what role it plays in the prognostic prediction of gastric cancer and whether it can be included in the gastric cancer classification system. A large number of studies, evaluating the importance of Ts in outcome prediction for gastric cancer, indeed illustrated that more emphases should be put on Ts, as it was an independent prognostic factor. Unfortunately, no agreement by far has yet been reached because of the limitation in different cutoff points and sample sizes as well as evaluation criteria. Particularly, there were no well-recognized and unified cutoff points for Ts existing in gastric cancer. Based on different cutoff points varying in a large range from 3 to 12 cm, different subgroups have been independently established.8–11,13,21–23 In our study, we adopted 4 cutoff points: 2.5, 4.5, 7.5, 10.0 cm, which showed more prognostic accuracy than cutoff points applied in the previous study,13 and found that patients with larger tumor had more aggressive features as well as worse biological behavior than patients with small sized tumor.
To be specific, larger tumors in our study were found more frequently in male and elder patients. Some papers reported that age and sex can be valuable prognostic indicators in patients with early gastric cancer.22,24 Gastric cancer tends to exhibit more aggressive tumor behavior in young patients than in old patients.25 Moreover, patients with large sized tumor were often more likely to be diagnosed with the presence of deeper tumor invasion, wider lymph node metastasis, higher tumor grade, or poorer differentiation. Logistic regression analyses in our study suggested that factors of macroscopic type, T stage, and N stage were independent risk factors for Ts, indicating that these 3 factors were closely associated with Ts, even after adjustment for potential confounding factors such as age, sex, tumor differentiation, and vessel invasion together with perineural invasion. Larger tumors were significantly related to more advanced Borrmann type, deeper depth of invasion, and higher incidence of lymph node metastases, which was consistent with other reports.10,21
We also focused on the prognostic value of Ts. Kaplan–Meier analysis in our study showed that patients with small sized tumor presented an overwhelming survival advantage to patients with larger tumor. This finding is generally similar to some previous studies that pointed a higher hazard ratio of death among patients with larger tumor.26,27 Univariate analysis revealed that Ts, as well as other clinicopathologic characteristics such as sex, age, tumor location, macroscopic type, tumor differentiation, vessel invasion, perineural invasion, T stage, and N stage, was significantly associated with overall survival, which could serve as a prognostic factor for gastric cancer. The poor survival outcomes related to large sized tumor, therefore, may be attributed to their aggressive features and biological behavior as well as advanced stages.
In addition to T stage, N stage, and age as well, Ts was demonstrated in our study by multivariate Cox regression analysis to be an independent prognostic factor of overall survival for patients with gastric cancer. Multicollinearity should be taken into consideration as Ts stage was confirmed to be moderately correlated with T stage. Comparison of survival prognostic accuracy for T and Ts stages was further performed in the present study, though, unfortunately, no significant difference was found between them despite a tiny improvement of C-index. However, taking the place of the T stage in the TNM stage system, Ts provided powerful survival discrimination for patients with gastric cancer based on findings in this study (Fig. 2). Additionally, TsNM, a modified stage system based on Ts, predicted survival more accurately by comparison of the present TNM stage system, which is consistent with the result mentioned in previous studies.13,28 It has also been reported that integrating Ts stage, T stage, and N stage together into the staging system could enhance the accuracy of the prognostic prediction of gastric cancer patients.12,29,30 Results in the present study illustrated that Ts alone would not show distinctive improvement than T stage in survival prognostic prediction, but great advantages and obvious discrimination ability were exhibited when being combined with N stage, bringing much more benefit in prognostic accuracy than that of T stage. Due to the consideration above, we recommended utilizing TsNM rather than the TNM stage system for prognostic prediction.
Furthermore, stratified analysis of comparison between Ts and T stage according to lymph node status and age was performed (Figs. 3 and 4). Ts stage revealed significant improvement in patients with N+ and patients with age ≥60, and showed much better discrimination ability than that of T stage. Xu et al30 proposed that Ts could just improve prognostic accuracy in stage T3/4aN0 tumors, but there was no prognostic difference existing between Ts and T stages for patients with N0 in our study, which might be due to the consideration that a great proportion of N0 patients were in early stage and a timely operation generally resulted in a better outcome regardless of tumor size. Even so, Ts stage still gained improvement of discrimination ability compared with T stage for N0 patients. Interestingly, age, also an independent prognostic factor in our study, was negatively linked to the prognostics because the HR was 0.752, which meant that younger patients had worse prognosis than older ones. Nakamura et al concluded that the pathway of gastric carcinogenesis differs between young and elderly patients so that young patients with gastric cancer, in comparison to elderly patients, showing a more aggressive clinical course, have a poorer prognosis.31,32 That might be the reason why there was no statistical difference in prognostic prediction for patients with age <60. Therefore, for patients with N+ and patients with age ≥60 in clinical works, Ts stage could be recommended as a clinicopathologic variable for the survival prediction which was more accurate than T stage.
There were also limitations in our study. On one hand, as a nonrandomized retrospective single-center study, our findings we got could have been observed by chance despite the large sample and the baseline was not well balanced because of confounding influences of covariates. On the other hand, the optimal Ts cutoff points could only make prognoses in our study. Lacking of another separated validation set, we failed to validate the TsNM system to access its predictive power. Optimal cutoff points should be determined and unified in more separated validation studies. Therefore, large-scale and prospective multicenter studies are needed to evaluate that Ts can whether or not be an important supplementary or substituted index for the current TNM staging system of gastric cancer before stronger statement can be done.
CONCLUSION
As shown in our results, Ts, significantly correlated with gastric cancer progression, can be regarded as a reliable prognostic factor, and TsNM may improve the prognostic accuracy of gastric cancer patients which would be of productive value to comprehensively evaluate the status of primary tumor and greatly contribute to the management of gastric cancer.
Acknowledgment
Special thanks to Ms Xue Zhao, a professor from the Institute of Foreign Language, Sichuan University, who has been engaged for decades in academic English writing in medicine, for her kind help in grammar revision and suggestion.
Footnotes
Abbreviations: AJCC = American Joint Committee on Cancer, CI = confidence interval, HR = hazard ratio, JGCA = Japanese Gastric Cancer Association, N = lymph node metastasis, N+ = positive lymph node metastasis, N0 = negative lymph node metastasis, OS = overall survival, r = correlation coefficient, T = depth of tumor invasion, TNM = tumor-nodes metastasis stage system, Ts = tumor size, TsNM = tumor size-nodes metastasis.
Domestic support from: National Natural Science Foundation of China (No. 81372344, No. 81301867); New Century Excellent Talents in University support program, Ministry of Education of China (2012SCU-NCET-11-0343); Sichuan Province Youth Science and Technology Innovative Research Team, No. 2015TD0009.
The authors have no conflicts of interest to disclose.
REFERENCES
- 1.Jemal A, Siegel R, Ward E, et al. Cancer statistics, 2008. CA Cancer J Clin 2008; 58:71–96. [DOI] [PubMed] [Google Scholar]
- 2.Desai AM, Pareek M, Nightingale PG, et al. Improving outcomes in gastric cancer over 20 years. Gastric Cancer 2004; 7:196–201. [DOI] [PubMed] [Google Scholar]
- 3.Yasuda K, Shiraishi N, Inomata M, et al. Prognostic significance of macroscopic serosal invasion in advanced gastric cancer. Hepatogastroenterology 2007; 54:2028–2031. [PubMed] [Google Scholar]
- 4.Yokota T, Ishiyama S, Saito T, et al. Lymph node metastasis as a significant prognostic factor in gastric cancer: a multiple logistic regression analysis. Scand J Gastroenterol 2004; 39:380–384. [DOI] [PubMed] [Google Scholar]
- 5.Saito H, Fukumoto Y, Osaki T, et al. Prognostic significance of level and number of lymph node metastases in patients with gastric cancer. Ann Surg Oncol 2007; 14:1688–1693. [DOI] [PubMed] [Google Scholar]
- 6.Japanese Gastric Cancer Association. Japanese classification of gastric carcinoma: 3rd English edition. Gastric Cancer 2011; 14:101–112. [DOI] [PubMed] [Google Scholar]
- 7.Washington K. 7th edition of the AJCC cancer staging manual: stomach. Ann Surg Oncol 2010; 17:3077–3079. [DOI] [PubMed] [Google Scholar]
- 8.Guo P, Li Y, Zhu Z, et al. Prognostic value of tumor size in gastric cancer: an analysis of 2,379 patients. Tumour Biol 2013; 34:1027–1035. [DOI] [PubMed] [Google Scholar]
- 9.Mohri Y, Tanaka K, Ohi M, et al. Prognostic significance of host- and tumor-related factors in patients with gastric cancer. World J Surg 2010; 34:285–290. [DOI] [PubMed] [Google Scholar]
- 10.Wang HM, Huang CM, Zheng CH, et al. Tumor size as a prognostic factor in patients with advanced gastric cancer in the lower third of the stomach. World J Gastroenterol 2012; 18:5470–5475. [DOI] [PMC free article] [PubMed] [Google Scholar]
- 11.Aoyama T, Yoshikawa T, Watanabe T, et al. Macroscopic tumor size as an independent prognostic factor for stage II/III gastric cancer patients who underwent D2 gastrectomy followed by adjuvant chemotherapy with S-1. Gastric Cancer 2011; 14:274–278. [DOI] [PubMed] [Google Scholar]
- 12.Lu J, Huang CM, Zheng CH, et al. Consideration of tumor size improves the accuracy of TNM predictions in patients with gastric cancer after curative gastrectomy. Surg Oncol 2013; 22:167–171. [DOI] [PubMed] [Google Scholar]
- 13.Deng J, Zhang R, Pan Y, et al. Tumor size as a recommendable variable for accuracy of the prognostic prediction of gastric cancer: a retrospective analysis of 1521 patients. Ann Surg Oncol 2015; 22:565–572. [DOI] [PubMed] [Google Scholar]
- 14.Quan J, Zhang R, Liang H, et al. The impact of tumor size on survival of patients with pT4aN0M0 gastric cancer. Am Surg 2013; 79:328–331. [PubMed] [Google Scholar]
- 15.Huang CM, Xu M, Wang JB, et al. Is tumor size a predictor of preoperative N staging in T2-T4a stage advanced gastric cancer? Surg Oncol 2014; 23:5–10. [DOI] [PubMed] [Google Scholar]
- 16.Adachi Y, Oshiro T, Mori M, et al. Tumor size as a simple prognostic indicator for gastric carcinoma. Ann Surg Oncol 1997; 4:137–140. [DOI] [PubMed] [Google Scholar]
- 17.Japanese Gastric Cancer Association. Japanese Classification of Gastric Carcinoma - 2nd English Edition. Gastric Cancer 1998; 1:10–24. [DOI] [PubMed] [Google Scholar]
- 18.Camp RL, Dolled-Filhart M, Rimm DL. X-tile: a new bio-informatics tool for biomarker assessment and outcome-based cut-point optimization. Clin Cancer Res 2004; 10:7252–7259. [DOI] [PubMed] [Google Scholar]
- 19.Zhou ZY, Xu L, Li HG, et al. Chemotherapy in conjunction with traditional Chinese medicine for survival of elderly patients with advanced non-small-cell lung cancer: protocol for a randomized double-blind controlled trial. J Integr Med 2014; 12:175–181. [DOI] [PubMed] [Google Scholar]
- 20.Huitzil-Melendez FD, Capanu M, O’Reilly EM, et al. Advanced hepatocellular carcinoma: which staging systems best predict prognosis? J Clin Oncol 2010; 28:2889–2895. [DOI] [PMC free article] [PubMed] [Google Scholar]
- 21.Zu H, Wang F, Ma Y, et al. Stage-stratified analysis of prognostic significance of tumor size in patients with gastric cancer. PLoS One 2013; 8:e54502. [DOI] [PMC free article] [PubMed] [Google Scholar]
- 22.Kunisaki C, Makino H, Takagawa R, et al. Tumor diameter as a prognostic factor in patients with gastric cancer. Ann Surg Oncol 2008; 15:1959–1967. [DOI] [PubMed] [Google Scholar]
- 23.Xu CY, Shen JG, Shen JY, et al. Ulcer size as a novel indicator marker is correlated with prognosis of ulcerative gastric cancer. Dig Surg 2009; 26:312–316. [DOI] [PubMed] [Google Scholar]
- 24.Bando E, Kojima N, Kawamura T, et al. Prognostic value of age and sex in early gastric cancer. Br J Surg 2004; 91:1197–1201. [DOI] [PubMed] [Google Scholar]
- 25.Hsieh FJ, Wang YC, Hsu JT, et al. Clinicopathological features and prognostic factors of gastric cancer patients aged 40 years or younger. J Surg Oncol 2012; 105:304–309. [DOI] [PubMed] [Google Scholar]
- 26.Coburn NG, Swallow CJ, Kiss A, et al. Significant regional variation in adequacy of lymph node assessment and survival in gastric cancer. Cancer 2006; 107:2143–2151. [DOI] [PubMed] [Google Scholar]
- 27.Li C, Oh SJ, Kim S, et al. Risk factors of survival and surgical treatment for advanced gastric cancer with large tumor size. J Gastrointest Surg 2009; 13:881–885. [DOI] [PubMed] [Google Scholar]
- 28.Sung CO, Lee SM, Choi JS, et al. Tumor size predicts survival in mucinous gastric carcinoma. J Surg Oncol 2012; 106:757–764. [DOI] [PubMed] [Google Scholar]
- 29.Lu J, Huang CM, Zheng CH, et al. Prognostic value of tumor size in patients with remnant gastric cancer: is the seventh UICC stage sufficient for predicting prognosis? PLoS One 2014; 9:e115776. [DOI] [PMC free article] [PubMed] [Google Scholar]
- 30.Xu M, Huang CM, Zheng CH, et al. Does tumor size improve the accuracy of prognostic predictions in node-negative gastric cancer (pT1-4aN0M0 stage)? PLoS One 2014; 9:e101061. [DOI] [PMC free article] [PubMed] [Google Scholar]
- 31.Nakamura T, Yao T, Niho Y, et al. A clinicopathological study in young patients with gastric carcinoma. J Surg Oncol 1999; 71:214–219. [DOI] [PubMed] [Google Scholar]
- 32.Sasao S, Hiyama T, Tanaka S, et al. Clinicopathologic and genetic characteristics of gastric cancer in young male and female patients. Oncol Rep 2006; 16:11–15. [PubMed] [Google Scholar]


