Abstract
This study aimed to investigate the relationships among parameters from dynamic contrast-enhanced (DCE) MRI, diffusion-weighted MRI (DWI), and 18F-fluorodeoxyglucose (18F-FDG) PET in patients with primary head-and-neck squamous cell carcinoma (HNSCC).
A total of 34 patients with primary HNSCC underwent DCE-MRI, DWI, and 18F-FDG PET before treatment. The perfusion parameters (Ktrans, Ktransmax, Kep, Ve, Vp, and AUC60) from DCE-MRI and ADC (ADCmean, ADCmin) values from DWI were calculated within the manually placed ROI around the main tumor. Standardized uptake value (SUVmax, SUVmean), metabolic tumor volume (MTV), and total lesion glycolysis (TLG = SUVmean × MTV) were calculated with thresholds of 3.0 SUV. The associations between parameters were evaluated by Pearson correlation analysis.
Significant correlations were identified between Ktrans and Kep (r = 0.631), Ktrans and Ve (r = 0.603), Ktrans and ADCmean (r = 0.438), Ktransmax and Kep (r = 0.667), Ktransmax and Vp (r = 0.351), Ve and AUC60 (r = 0.364), Ve and ADCmean (r = 0.590), and Ve and ADCmin (r = 0.361). ADCmin was reversely correlated with TLG (r = –0.347). Tumor volume was significantly associated with Ktransmax (r = 0.348).
The demonstrated relationships among parameters from DCE, DWI, and 18F-FDG PET suggest complex interactions among tumor biologic characteristics. Each diagnostic technique may provide complementary information for HNSCC.
INTRODUCTION
Squamous cell carcinomas are the most common neoplasm of head-and-neck cancer. Although head-and-neck squamous cell carcinomas (HNSCCs) do not account for a large portion of the total cancer incidence or mortality, they have a particularly crucial influence on a patient's quality of life because of their functional and cosmetic significance.
18F-fluorodeoxyglucose (18F-FDG) positron emission tomography (PET) has been widely used for tumor staging, monitoring of treatment responses, and detection of recurrence of head-and-neck cancers.1–4 The standardized uptake value (SUV) is the most commonly used PET parameter and is a semiquantitative measure of glucose metabolism. Recently, the clinical significance of volume-based PET parameters – such as the metabolic tumor volume (MTV) and total lesion glycolysis (TLG) – has been investigated.5,6 These PET parameters have been suggested as valuable biomarkers of tumor characteristics.7,8
Similarly, noninvasive magnetic resonance imaging (MRI) techniques, including diffusion-weighted MRI (DWI) and dynamic contrast-enhanced (DCE)-MRI have shown potential in HNSCC patients for assessing treatment response and outcome.9–12 DWI provides quantitative information about tumor cellularity that is presented as the apparent diffusion coefficient (ADC).13 DCE-MRI involves sequential imaging during the passage of a contrast agent through the tissue of interest. Using compartmental modeling, DCE-MRI measures the pharmacokinetics of tissue microcirculation and provides data on vascular perfusion and permeability.13–15
Tumor biologic characteristics – including tumor microcirculation, cellularity, and glucose metabolism – may exhibit relationships and interactions. An understanding of such complexities could expand the knowledge of tumor characteristics and have clinical implications such as in guidance for treatment planning, early prediction of treatment responses, and evaluation of treatment outcome.16 To our knowledge, there is no report showing the relationships among DCE-MRI, DWI, and 18F-FDG PET parameters in the primary HNSCC. Thus, we investigated the correlations among these 3 parameters in patients with HNSCC.
METHODS
Patients
We retrospectively reviewed consecutive 39 patients with histopathologically proven squamous cell carcinoma of the head and neck who underwent routine diagnostic work-up MRI including DCE-MRI, DWI sequences, and 18F-FDG PET/CT within an interval of 2 weeks (mean interval between the 2 examinations: 3.24 days, range: 0–14 days) before treatment. Three patients were excluded because the primary lesion was smaller than 1 cm3 in volume or was not well detected on MR or PET images. Two patients were excluded because the primary lesion contained so many large vessels and necrotic portions which can influence perfusion and diffusion parameters. Finally, 34 patients were enrolled. This study was approved by the ethics committee of our university (Ajou Institutional review board), and the requirement for written informed consent was waived because of its retrospective nature.
MRI Examinations
For all patients, MR imaging was performed using 1.5 T MR scanner (Signa HDxt, GE Healthcare, Milwaukee, WI) with a 12-channel neurovascular head-and-neck array coil. Axial fat saturated T2WI (TR, 3700 ms; TE, 102 ms; FOV, 200 × 200 mm; matrix, 320 × 256; slice thickness, 4 mm; interslice gap, 1 mm; 26 slices; ETL, 16; NEX, 2) and axial T1WI (TR, 517 ms; TE, 11 ms; FOV, 200 × 200 mm; matrix, 320 × 256; slice thickness, 4 mm; interslice gap, 1 mm; 26 slices; NEX, 1.5), as well as coronal T2 and sagittal T1WI were acquired before contrast agent administration. After gadolinium contrast (Gadovist, gadobutrol, Bayer HealthCare, Berlin, Germany) injection (0.2 mmol/kg; flow rate 2.5 mL/s) using a power injector immediately followed by a 20 mL saline flush, fat-saturated, axial, and coronal T1WI were acquired. The DCE-MR imaging was performed using a 3-dimensional fast spoiled gradient echo sequence with the following parameters: TR, 5.2 ms; TE, 1 ms; FOV, 200 × 200 mm; matrix, 160 × 128; flip angle, 25°; slice thickness, 5 mm; 26 slices, NEX, 1.5; 55 dynamic cycles; temporal resolution, 5 s; total acquisition time, 5 min 35 s.
DWI was performed using the periodically rotated overlapping parallel lines with enhanced reconstruction (PROPELLER) sequences to reduce imaging distortion and artifact (b value, 0 and 1000 sec/mm2; TR, 8000 ms; TE, 85 ms; FOV, 200 × 200 mm; matrix 128 × 128; 26 slices; slice thickness 4 mm; interslice gap, 1 mm; ETL, 20; NEX, 1.5).
18F-FDG PET/CT Examinations
All of the subjects fasted for at least 6 hours before 18F-FDG PET/CT examination. All blood glucose levels at the time of injection of 18F-FDG were <200 mg/dL. PET/CT was performed using a dedicated PET/CT scanner (Discovery STE, GE Healthcare). Before PET, unenhanced CT was performed at 60 minutes after a 5 MBq/kg 18F-FDG injection using 16-slice helical CT (120 keV; 30–100 mA in the AutomA mode; section width, 3.75 mm), and then an emission scan was acquired from the thigh to the head for 2.5 min per frame in 3-dimensional mode. Attenuation-corrected PET images using CT data were reconstructed by an ordered-subsets expectation maximization algorithm (20 subsets, 2 iterations).
Image Data Analysis
One board certified neuroradiologist (MH), blinded to the PET/CT findings, reviewed tumor findings on MR images. The DCE-MRI and DWI data were transferred for postprocessing to a workstation running commercially available software for tissue perfusion and diffusion estimation (NordicICE, NordicNeuroLab, Bergen, Norway). Motion correction and arterial input function (AIF) determination were automatically processed using the software. The AIF pixel was located in the tumor neighboring vessels (carotid arteries). The baseline (precontrast) T1 value was fixed at a specified value for all of the voxels.
Quantitative DCE-MRI analyses of the tumor tissue time course data were performed using the 2-compartment Tofts model.17 The model fitted the tissue contrast agent concentration and yielded the following quantitative parameters: Ktrans, volume transfer constant in minute–1of contrast agent from blood plasma to extravascular extracellular space (EES) reflecting both plasma flow and permeability; Ktransmax, maximum value of Ktrans; Ve, EES volume per unit volume of tissue; Vp, blood plasma volume per unit volume of tissue; and kep, redistribution rate constant of contrast agent from EES to plasma and equal to Ktrans/Ve. The area under the curve (AUC60) at the initial 60 second interval was calculated from the time signal intensity curve. Mean ADC (ADCmean) and minimum ADC (ADCmin) values were calculated on the ADC map.
A freehand region of interest (ROI) was drawn along the tumor boarder on postcontrast T1WI in all involved slices by a board certified neuroradiologist (MH). T2WI was also utilized to avoid necrotic areas and large feeding vessels in close proximity. Tumor volume (cm3) was calculated as the sum of ROI area multiplied by the slice thickness and gap for each slice. The same ROIs were placed on each corresponding slice of postprocessed quantitative maps from DCE MRI and ADC map from DWI using commercial software (NordicICE, NordicNeuroLab, Bergen, Norway). The values of DCE-MRI and DWI parameters of each slice were cumulated and recorded as the pixel-by-pixel. The averaged value of all pixels was used to present the whole tumor parameters.
A nuclear medicine specialist (SJL) reviewed 18F-FDG PET images on a dedicated workstation (GE Advantage Workstation 4.4; GE Healthcare) using volume viewer software that provides an automatically delineated volume of interest (VOI) using an isocontour threshold method based on SUV. We used several fixed thresholds for determining the VOI boundary: 2.5, 3.0, 3.5, and 4.0. Using these 4 threshold SUVs, the VOIs of the primary tumor were generated automatically. The software calculated the maximum SUV (SUVmax), average SUV (SUVmean), and MTV of the entire primary tumor according to the tumor VOIs. The TLG was calculated by multiplying the mean SUV by the MTV (TLG = SUVmean × MTV).
Statistical Analysis
All statistical calculations were performed using the SPSS version 19 software (SPSS Inc, Chicago, IL). The values are presented as means ± standard deviation (SD). Data normality were tested by the Kolmogorov–Smirnov test. The relationships between imaging parameters from DCE-MRI (Ktrans, Ktransmax, Kep, Ve, Vp, and AUC60), DWI (ADCmean, ADCmin), and 18F-FDG PET (SUVmax, SUVmean, MTV, and TLG) were examined using Pearson correlation because the variables exhibited a normal distribution. The Pearson correlation was also used to analyze the interrelations between tumor volume and imaging parameters. A P-value of less than 0.05 was considered to indicate significance.
RESULTS
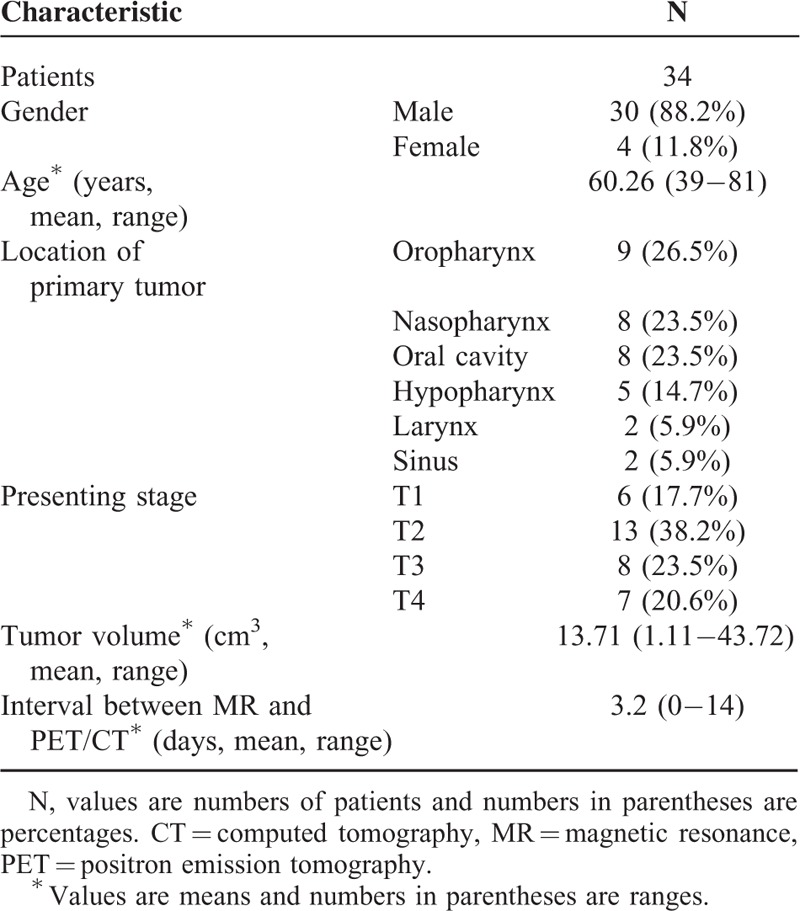
Clinical characteristics of the 34 patients are presented in Table 1. The mean age of the patients was 60.3 years (range, 39–81 years). Primary tumor sites were as follows: 9 oropharynx, 8 oral cavity, 8 nasopharynx, 5 hypopharynx, 2 larynx, and 2 paranasal sinus, maxillary sinus.
TABLE 1.
Patients’ Characteristics
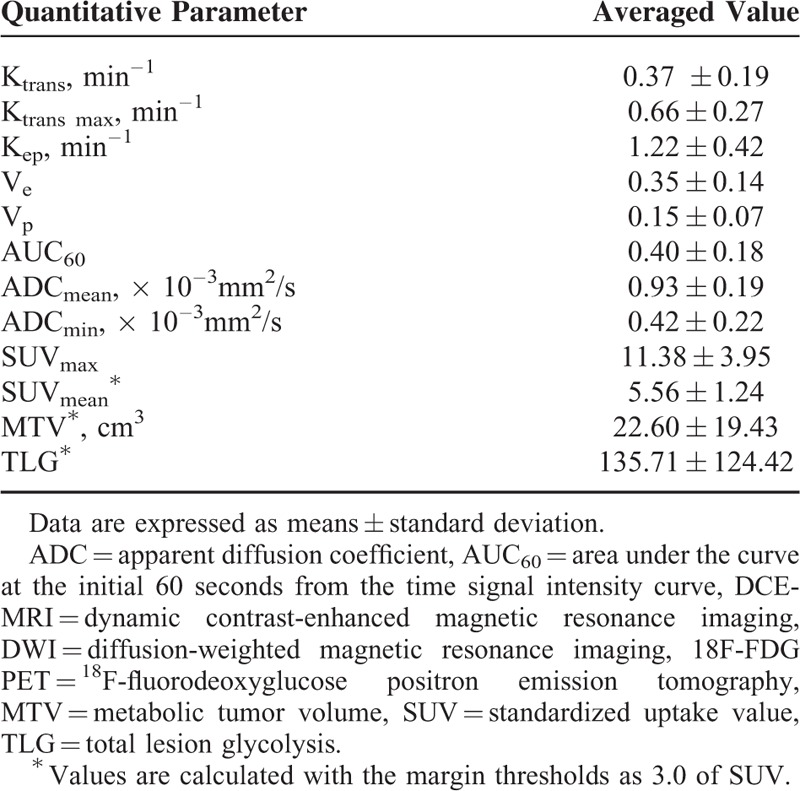
The averaged values of DCE-MRI, DWI, and 18F-FDG PET parameters for the 34 patients are summarized in Table 2. The correlation results were similar when the SUV threshold was changed. Therefore, we adopted a fixed value for SUV of 3.0 because it showed the greatest statistical significance.
TABLE 2.
Averaged DCE-MRI, DWI and 18F-FDG PET Parameter Values at the Tumor Sites
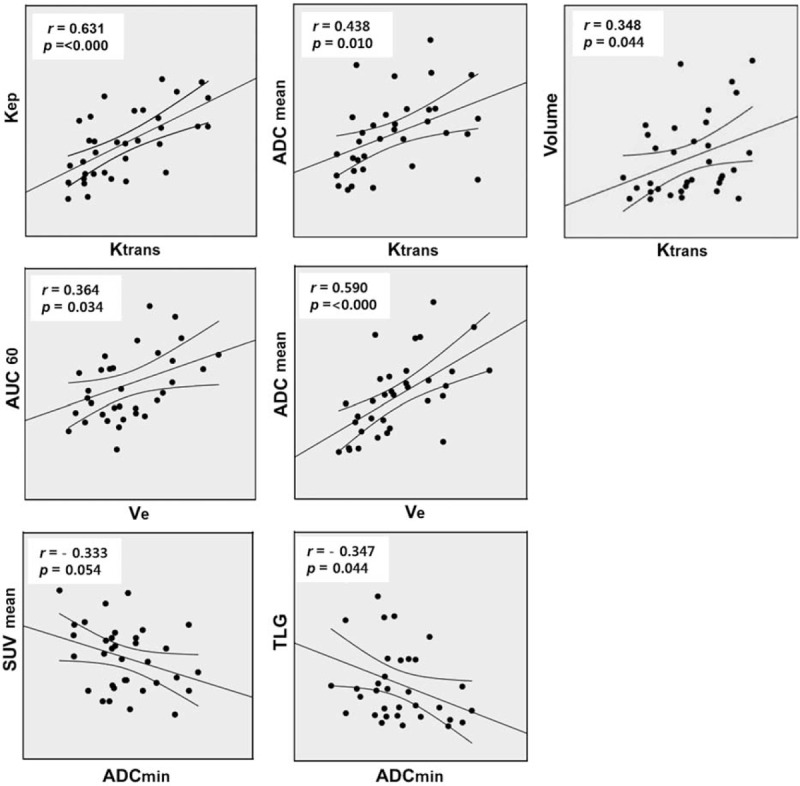
Ktrans showed a positive correlation with Kep (r = 0.631, P < 0.000), Ve (r = 0.603 P < 0.000), and ADCmean (r = 0.438, P = 0.010); Ktransmax showed a positive correlation with Kep (r = 0.667, P < 0.000) and Vp (r = 0.351, P = 0.042). A significant positive association was also demonstrated between Ve and AUC60 (r = 0.364, P = 0.034), Ve and ADCmean (r = 0.590, P < 0.000), and Ve and ADCmin (r = 0.361, P = 0.036). ADCmin exhibited a reverse correlation with TLG (r = −0.347, P = 0.044). ADCmin also showed a reverse correlation with SUVmean, although it was not statistically significant (r = −0.333, P = 0.054).
No parameters from DCE-MRI, including Ktransmax, showed a significant relationship with those from 18F-FDG PET (Table 3, Fig. 1).
TABLE 3.
Correlation Analysis of the DCE-MRI, DWI, and 18F-FDG PET Parameters at the Tumor Sites
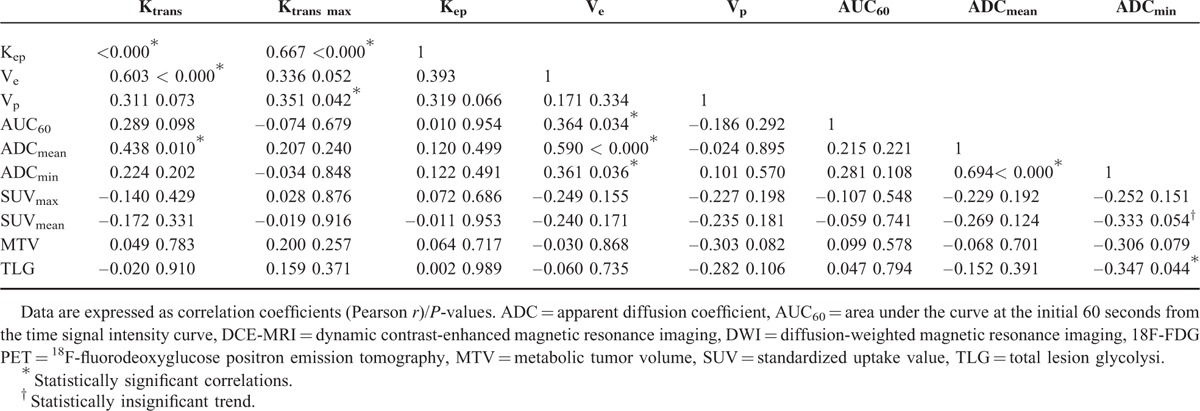
FIGURE 1.
Scatterplots demonstrating the results of Pearson correlations between the various DEC-MRI, DWI, and 18F-FDG-PET parameters. For each scatterplot, the best-fit line is shown as a central solid line. Curves above and below the best-fit line represent the upper and lower bounds of the 95% confidence interval. DCE-MRI = dynamic contrast-enhanced magnetic resonance imaging, DWI = diffusion-weighted magnetic resonance imaging, 18F-FDG PET = 18F-fluorodeoxyglucose positron emission tomography.
Tumor volume measured using MRI showed a significant correlation with Ktransmax (r = 0.348 P = 0.044), with the exception of MTV (r = 0.768, P < 0.000) and TLG (r = 0.712, P < 0.000), which contain by definition the value of volume (Fig. 1).
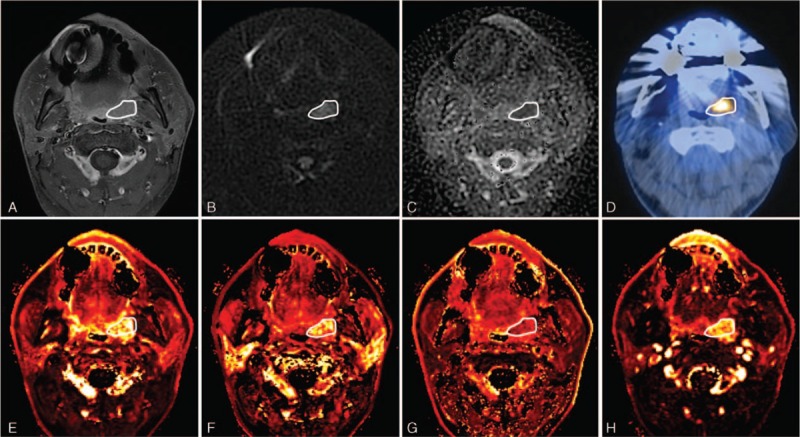
A representative case of DCE-MRI, DWI, and 18F-FDG PET imaging is shown in Figure 2.
FIGURE 2.
A 55 year-old male diagnosed with left tonsillar cancer with multiple ipsilateral lymph nodes metastasis (T2N2b, metastatic lymph nodes are not shown on these images). (A) Axial contrast-enhanced T1WI shows an enhancing mass lesion at the left tonsil. (B) DWI and (C) ADC map show diffusion restriction and a decreased ADC value at the corresponding lesion. (D) The corresponding 18F-FDG PET/CT displays the 18F-FDG uptake at the left tonsillar mass. Parametric maps of DCE-perfusion MRI represent (E) Ktrans, (F) Kep, (G) Ve, and (H) AUC60 in tumor site. The primary mass lesion is outlined by a white line in each image. ADC = apparent diffusion coefficient, AUC60 = area under the curve at the initial 60 seconds from the time signal intensity curve, DCE-MRI = dynamic contrast-enhanced magnetic resonance imaging, DWI = diffusion-weighted magnetic resonance imaging, 18F-FDG PET = 18F-fluorodeoxyglucose positron emission tomography.
DISCUSSION
This study is to our knowledge the first to assess the relationships among parameters derived from 3 imaging modalities for HNSCC. DCE-MRI, DWI, and 18F-FDG PET are typically included in initial staging work-ups for HNSCC. These noninvasive imaging tools may offer pathophysiological information about tumors. DCE-MRI parameters can provide information regarding the microvessel permeability and extracellular space, whereas ADC from DWI can provide an indication of the cellular density of a tumor, and 18F-FDG PET can measure glucose metabolism.13
We found a variety of interrelations between kinetic parameters from DCE-MRI. These results are supported by previous reports.18,19 Our findings showed a positive correlation between Ktrans and Kep. The structurally and functionally incompetent neovessels of a tumor promote the extravasation of contrast medium (represented as Ktrans) and may also allow rapid influx back into the capillary plasma (represented as Kep). As reported by Bisdas et al19 Ve had a significant positive association with AUC in our study. In general, the EES of a tumor is characterized by a larger interstitial space, higher collagen concentration, lower proteoglycan and hyaluronate concentrations, higher interstitial fluid pressure, and more effective interstitial diffusion coefficient of macromolecules compared to normal tissues. These structural and physiologic characteristics are responsible for the transport and accumulation of contrast injected into the body.9,20 Therefore, the relationship between Ve and AUC, which represents the amount of contrast agent delivered to and retained within the tumor in a given time period, can be explained.
The DWI of head-and-neck lesions is particularly problematic because of the artifacts induced by physiologic motion as well as susceptibility artifacts from the many air tissue boundaries and dental fillings.13,21 As echo-planar DWI, a widely accepted method, is vulnerable to these artifacts, we used the PROPELLER sequence for DWI in this study. Previous reports22–24 have demonstrated that PROPELLER sequences significantly reduce image distortion and provide more accurate ADC values in head-and-neck lesions.
No study has demonstrated a correlation between MR parameters from DCE and DWI in HNSCC. Ahn et al16 evaluated the relationship between only Ktrans and ADC in advanced hepatocellular carcinoma, but found no significant correlation. Conversely, we found that Ktrans showed a positive correlation with ADC. Difference in tumor type and pathologic conditions can explain this discordance. Our results also suggested a positive correlation between Ve and ADC. The Ve parameter reflects the EES and can be an indicator of the cell density in a tissue of interest. Therefore, a positive correlation between Ve and ADC value, which is a quantitative DWI parameter determined by cell density, is reasonable.25,26
The most commonly used PET parameter to measure the degree of 18F-FDG uptake is SUV. Although the SUVmax is widely used due to its simplicity of determination, it is a single voxel value that may not represent total tumor uptake and may be vulnerable to statistical noise. Recently, there has been an increasing interest in the use of volumetric parameters of metabolism such as MTV and TLG.11,27–29 MTV is defined as the volume of 18F-FDG activity in the tumor, and TLG is the sum of SUV within the tumor. Several studies have suggested that volume-based PET parameters may better represent HNSCC tumor characteristics than SUV.11 We found a significant reverse correlation between ADC and TLG, but not between ADC and SUVmax, in the present study.
Few studies have evaluated associations between DCE or DWI-MR parameters and 18F-FDG PET parameters in head-and-neck cancer. One recent study evaluating 47 HNSCC patients demonstrated that ADCratio and SUVmean were significantly correlated, possibly due to a higher-cellularity region as a result of increased tumor proliferation.30 However, volume-based PET parameters were not evaluated in the study. We found a significant correlation between ADC and TLG. Thus, our data may suggest that high-glucose metabolism is related to increased cellularity. Another study of tumor metabolism by 18F-FDG PET and perfusion by DCE-MRI in 16 HNSCC patients reported that no perfusion parameter had a significant relationship with SUV and TLG.18 In agreement with that study, our results showed no significant associations between metabolic parameters by 18F-FDG PET and parameters from DCE-MRI.
We identified a positive correlation between tumor volume and Ktransmax from DCE-MRI. Initially, tumor cells are nourished by diffusion. As the tumor grows and reaches a certain size, tumor angiogenesis is activated and the formation of a vascular plexus supplying the growing tumor is started. However, these newly formed vasculatures, as well as the endothelium and vessel wall, are structurally and functionally abnormal.31,32 The leakiness of these incompetent tumor vessels can be represented as Ktrans as mentioned above. Therefore, we can accept the logic whereby a larger tumor exhibits plentiful angiogenesis and higher Ktrans value, although a previous report18 failed to demonstrate such a correlation.
Our study had several limitations. First, this was a retrospective study. Second, it had a small sample size. Third, current study data represented untreated primary HNSCC and, thus, has no direct clinical implications for differential diagnosis or treatment monitoring. Nonetheless, this preliminary study shows that the various parameters from DCE-MRI, DWI, and 18F-FDG PET, each of which is based on a different mechanism, have complex correlations. Thus, combined multiparametric analysis of these parameters may useful in treatment planning, predicting treatment response, and monitoring treatment with further insight into the tumor biology. Additional prospective studies with a larger patient population are required to confirm these findings.
CONCLUSION
We evaluated the relationships among imaging parameters derived from DCE-MRI, DWI, and 18F-FDG PET with the aim of establishing a more comprehensive understanding of tumor characteristics of HNSCC. Although there was no exact one-to-one correlation among these noninvasive imaging techniques, we found correlations between selected imaging parameters. The demonstrated relationships among DCE-MRI, DWI, and 18F-FDG PET data suggest complex interactions between the biological characteristics of tumor. These diagnostic techniques might play a complementary role in the assessment of HNSCC.
Footnotes
Abbreviations: DCE-MRI = dynamic contrast-enhanced MRI, DWI = diffusion-weighted MRI, HNSCC = head-and-neck squamous cell carcinoma, 18F-FDG PET = 18F-fluorodeoxyglucose positron emission tomography, MTV = metabolic tumor volume, PROPELLER = periodically rotated overlapping parallel lines with enhanced reconstruction, TLG = total lesion glycolysis.
JWC and SJL contributed equally to this work.
The English in this document has been checked by at least two professional editors, both native speakers of English. For a certificate, please see: http://www.textcheck.com/certificate/HN4GQ8.
The authors have no funding and conflicts of interest to disclose.
REFERENCES
- 1.Al-Ibraheem A, Buck A, Krause BJ, et al. Clinical applications of FDG PET and PET/CT in head and neck cancer. J Oncol 2009; 2009:208725. [DOI] [PMC free article] [PubMed] [Google Scholar]
- 2.Ong SC, Schoder H, Lee NY, et al. Clinical utility of 18F-FDG PET/CT in assessing the neck after concurrent chemoradiotherapy for Locoregional advanced head and neck cancer. J Nucl Med 2008; 49:532–540. [DOI] [PubMed] [Google Scholar]
- 3.Wong RJ, Lin DT, Schoder H, et al. Diagnostic and prognostic value of [(18)F]fluorodeoxyglucose positron emission tomography for recurrent head and neck squamous cell carcinoma. J Clin Oncol 2002; 20:4199–4208. [DOI] [PubMed] [Google Scholar]
- 4.Yao M, Smith RB, Hoffman HT, et al. Clinical significance of postradiotherapy [18F]-fluorodeoxyglucose positron emission tomography imaging in management of head-and-neck cancer-a long-term outcome report. Int J Radiat Onco Biol Phys 2009; 74:9–14. [DOI] [PubMed] [Google Scholar]
- 5.Rahim MK, Kim SE, So H, et al. Recent trends in PET image interpretations using volumetric and texture-based quantification methods in nuclear oncology. Nucl Med Mol Imaging 2014; 48:1–15. [DOI] [PMC free article] [PubMed] [Google Scholar]
- 6.Lee SJ, Choi JY, Lee HJ, et al. Prognostic value of volume-based 18F-fluorodeoxyglucose PET/CT parameters in patients with clinically node-negative oral tongue squamous cell carcinoma. Korean J Radiol 2012; 13:752–759. [DOI] [PMC free article] [PubMed] [Google Scholar]
- 7.Kwon SH, Yoon JK, An YS, et al. Prognostic significance of the intratumoral heterogeneity of F-FDG uptake in oral cavity cancer. J Surg Oncol 2014; 110:702–706. [DOI] [PubMed] [Google Scholar]
- 8.Schwartz DL, Rajendran J, Yueh B, et al. FDG-PET prediction of head and neck squamous cell cancer outcomes. Arch Otolaryngol Head Neck Surg 2004; 130:1361–1367. [DOI] [PubMed] [Google Scholar]
- 9.Chawla S, Kim S, Dougherty L, et al. Pretreatment diffusion-weighted and dynamic contrast-enhanced MRI for prediction of local treatment response in squamous cell carcinomas of the head and neck. AJR Am J Roentgenol 2013; 200:35–43. [DOI] [PMC free article] [PubMed] [Google Scholar]
- 10.Kim S, Loevner LA, Quon H, et al. Prediction of response to chemoradiation therapy in squamous cell carcinomas of the head and neck using dynamic contrast-enhanced MR imaging. AJNR Am J Neuroradiol 2010; 31:262–268. [DOI] [PMC free article] [PubMed] [Google Scholar]
- 11.Ng SH, Lin CY, Chan SC, et al. Dynamic contrast-enhanced MR imaging predicts local control in oropharyngeal or hypopharyngeal squamous cell carcinoma treated with chemoradiotherapy. PLoS One 2013; 8:e72230. [DOI] [PMC free article] [PubMed] [Google Scholar]
- 12.Kim S, Loevner L, Quon H, et al. Diffusion-weighted magnetic resonance imaging for predicting and detecting early response to chemoradiation therapy of squamous cell carcinomas of the head and neck. Clin Cancer Res 2009; 15:986–994. [DOI] [PMC free article] [PubMed] [Google Scholar]
- 13.Quon H, Brizel DM. Predictive and prognostic role of functional imaging of head and neck squamous cell carcinomas. Semin Radiat Oncol 2012; 22:220–232. [DOI] [PubMed] [Google Scholar]
- 14.Hylton N. Dynamic contrast-enhanced magnetic resonance imaging as an imaging biomarker. J Clin Oncol 2006; 24:3293–3298. [DOI] [PubMed] [Google Scholar]
- 15.Chikui T, Obara M, Simonetti AW, et al. The principal of dynamic contrast enhanced MRI, the method of pharmacokinetic analysis, and its application in the head and neck region. Int J Dent 2012; 2012:480659. [DOI] [PMC free article] [PubMed] [Google Scholar]
- 16.Ahn SJ, Park MS, Kim KA, et al. 18F-FDG PET metabolic parameters and MRI perfusion and diffusion parameters in hepatocellular carcinoma: a preliminary study. PLoS One 2013; 8:e71571. [DOI] [PMC free article] [PubMed] [Google Scholar]
- 17.Tofts PS, Brix G, Buckley DL, et al. Estimating kinetic parameters from dynamic contrast-enhanced T(1)-weighted MRI of a diffusable tracer: standardized quantities and symbols. J Magn Reson Imaging 1999; 10:223–232. [DOI] [PubMed] [Google Scholar]
- 18.Jansen JF, Schoder H, Lee NY, et al. Tumor metabolism and perfusion in head and neck squamous cell carcinoma: pretreatment multimodality imaging with 1H magnetic resonance spectroscopy, dynamic contrast-enhanced MRI, and [18F]FDG-PET. In J Radiat Oncol Biol Phys 2012; 82:299–307. [DOI] [PMC free article] [PubMed] [Google Scholar]
- 19.Bisdas S, Seitz O, Middendorp M, et al. An exploratory pilot study into the association between microcirculatory parameters derived by MRI-based pharmacokinetic analysis and glucose utilization estimated by PET-CT imaging in head and neck cancer. Eur Radiol 2010; 20:2358–2366. [DOI] [PubMed] [Google Scholar]
- 20.Jain RK. Transport of molecules in the tumor interstitium: a review. Cancer Res 1987; 47:3039–3051. [PubMed] [Google Scholar]
- 21.Thoeny HC, De Keyzer F, King AD. Diffusion-weighted MR imaging in the head and neck. Radiology 2012; 263:19–32. [DOI] [PubMed] [Google Scholar]
- 22.Juan CJ, Chang HC, Hsueh CJ, et al. Salivary glands: echo-planar versus PROPELLER Diffusion-weighted MR imaging for assessment of ADCs. Radiology 2009; 253:144–152. [DOI] [PubMed] [Google Scholar]
- 23.Chen X, Xian J, Wang X, et al. Role of periodically rotated overlapping parallel lines with enhanced reconstruction diffusion-weighted imaging in correcting distortion and evaluating head and neck masses using 3 T MRI. Clin Radiol 2014; 69:403–409. [DOI] [PubMed] [Google Scholar]
- 24.Mahmoud OM, Tominaga A, Amatya VJ, et al. Role of PROPELLER diffusion weighted imaging and apparent diffusion coefficient in the diagnosis of sellar and parasellar lesions. Eur J Radiol 2010; 74:420–427. [DOI] [PubMed] [Google Scholar]
- 25.Herneth AM, Guccione S, Bednarski M. Apparent diffusion coefficient: a quantitative parameter for in vivo tumor characterization. Eur J Radiol 2003; 45:208–213. [DOI] [PubMed] [Google Scholar]
- 26.Lyng H, Haraldseth O, Rofstad EK. Measurement of cell density and necrotic fraction in human melanoma xenografts by diffusion weighted magnetic resonance imaging. Magn Reson Med 2000; 43:828–836. [DOI] [PubMed] [Google Scholar]
- 27.Lim R, Eaton A, Lee NY, et al. 18F-FDG PET/CT metabolic tumor volume and total lesion glycolysis predict outcome in oropharyngeal squamous cell carcinoma. J Nucl Med 2012; 53:1506–1513. [DOI] [PubMed] [Google Scholar]
- 28.Pak K, Cheon GJ, Nam HY, et al. Prognostic value of metabolic tumor volume and total lesion glycolysis in head and neck cancer: a systematic review and meta-analysis. J Nucl Med 2014; 55:884–890. [DOI] [PubMed] [Google Scholar]
- 29.Abd El-Hafez YG, Moustafa HM, Khalil HF, et al. Total lesion glycolysis: a possible new prognostic parameter in oral cavity squamous cell carcinoma. Oral Oncol 2013; 49:261–268. [DOI] [PubMed] [Google Scholar]
- 30.Choi SH, Paeng JC, Sohn CH, et al. Correlation of 18F-FDG uptake with apparent diffusion coefficient ratio measured on standard and high b value diffusion MRI in head and neck cancer. J Nucl Med 2011; 52:1056–1062. [DOI] [PubMed] [Google Scholar]
- 31.Bergers G, Benjamin LE. Tumorigenesis and the angiogenic switch. Nat Rev Cancer 2003; 3:401–410. [DOI] [PubMed] [Google Scholar]
- 32.Carmeliet P, Jain RK. Principles and mechanisms of vessel normalization for cancer and other angiogenic diseases. Nat Rev Drug Discov 2011; 10:417–427. [DOI] [PubMed] [Google Scholar]


