

Abstract
To compare the long-term effects of a very low carbohydrate, high-protein, low saturated fat (LC) diet with a traditional high unrefined carbohydrate, low-fat (HC) diet on markers of renal function in obese adults with type 2 diabetes (T2DM), but without overt kidney disease.
One hundred fifteen adults (BMI 34.6 ± 4.3 kg/m2, age 58 ± 7 years, HbA1c 7.3 ± 1.1%, 56 ± 12 mmol/mol, serum creatinine (SCr) 69 ± 15 μmol/L, glomerular filtration rate estimated by the Chronic Kidney Disease Epidemiology Collaboration formula (eGFR 94 ± 12 mL/min/1.73 m2)) were randomized to consume either an LC (14% energy as carbohydrate [CHO < 50 g/day], 28% protein [PRO], 58% fat [<10% saturated fat]) or an HC (53% CHO, 17% PRO, 30% fat [<10% saturated fat]) energy-matched, weight-loss diet combined with supervised exercise training (60 min, 3 day/wk) for 12 months. Body weight, blood pressure, and renal function assessed by eGFR, estimated creatinine clearance (Cockcroft–Gault, Salazar–Corcoran) and albumin excretion rate (AER), were measured pre- and post-intervention.
Both groups achieved similar completion rates (LC 71%, HC 65%) and reductions in weight (mean [95% CI]; −9.3 [−10.6, −8.0] kg) and blood pressure (−6 [−9, −4]/−6[−8, −5] mmHg), P ≥ 0.18. Protein intake calculated from 24 hours urinary urea was higher in the LC than HC group (LC 120.1 ± 38.2 g/day, 1.3 g/kg/day; HC 95.8 ± 27.8 g/day, 1 g/kg/day), P < 0.001 diet effect. Changes in SCr (LC 3 [1, 5], HC 1 [−1, 3] μmol/L) and eGFR (LC −4 [−6, −2], HC −2 [−3, 0] mL/min/1.73 m2) did not differ between diets (P = 0.25). AER decreased independent of diet composition (LC −−2.4 [−6, 1.2], HC −1.8 [−5.4, 1.8] mg/24 h, P = 0.24); 6 participants (LC 3, HC 3) had moderately elevated AER at baseline (30–300 mg/24 h), which normalized in 4 participants (LC 2, HC 2) after 52 weeks.
Compared with a traditional HC weight loss diet, consumption of an LC high protein diet does not adversely affect clinical markers of renal function in obese adults with T2DM and no preexisting kidney disease.
INTRODUCTION
Concerns exist about the safety of protein-rich diets for renal function, particularly in populations with type 2 diabetes mellitus (T2DM) who are at risk of nephropathy.1 Despite this, very low carbohydrate, high protein, high fat (LC) diets are rising in popularity amongst individuals with T2DM based on growing evidence of their efficacy as a weight management strategy to improve glycemic control and reduce cardiovascular disease (CVD) risk.2 Few well-controlled, long-term studies have systematically examined the effects of LC diets as part of a comprehensive lifestyle modification program on renal function in T2DM, limiting the applicability of LC diets as a diabetes management strategy. This study compares the effects, after 1 year of consumption of a novel energy-restricted LC diet that limits saturated fat, with an energy-matched traditional high unrefined carbohydrate, low-fat (HC) diet whilst undertaking a supervised exercise program, on renal function in obese adults with T2DM and without diabetic kidney disease (DKD).
MATERIALS AND METHODS
Participants and Study Design
Enrollment criteria, study design, and the primary study outcomes have been previously described.2 Briefly, 115 adults with T2DM and without overt kidney disease (57% male (mean ± SD) BMI 34.6 ± 4.3 kg/m2, age 58 ± 7 years, HbA1c 7.3 ± 1.1%, 56 ± 12 mmol/mol, serum creatinine (SCr) 69 ± 15 μmol/L, glomerular filtration rate estimated by the Chronic Kidney Disease Epidemiology Collaboration formula (eGFR-CKD-EPI) 94 ± 12 mL/min/1.73 m2) were recruited by public advertisement. Exclusion criteria were type-1 diabetes; preexisting renal disease (eGFR < 60 mL/min/1.73 m2, elevated SCr > 120 μmol/l, and/or albumin excretion rate (AER) > 300 mg/24 h); abnormal liver function; any significant endocrinopathy (other than stable treated thyroid disease); history of malignancy, respiratory, gastrointestinal, or CVD; pregnancy/lactation; history of/or current eating disorder or smoking. The study was approved by the Human Research Ethics Committees of the Commonwealth Scientific and Industrial Research Organisation and the Universities of Adelaide and South Australia. All participants gave written informed consent.
In a parallel design, participants were randomized to consume either a hypocaloric (500–1000 kcal/day deficit) LC diet (14% energy as carbohydrate [CHO < 50 g/day], 28% protein [PRO], 58% fat [<10% saturated fat]) or an energy-matched HC diet (53% CHO, 17% PRO, 30% fat [<10% saturated fat]); combined with supervised aerobic/resistance exercise (60 minutes, 3 day/wk) for 12 months. Detailed description of the diets, exercise program and the effects of the dietary interventions on body weight, glycemic control, and CVD risk factors have been reported elsewhere.2
Body Weight, Blood Pressure, HbA1c, Renal Function Measures, and Protein Intake
Body weight was measured using calibrated electronic scales (Mercury AMZ1, Tokyo, Japan) at baseline and monthly intervals. Other outcomes were assessed at weeks 0, 24, and 52. Seated blood pressure was measured by automated sphygmomanometry (SureSigns VS3; Phillips, Andover, MA). HbA1c was measured at a certified pathology laboratory (Institute of Medical and Veterinary Science Pathology, Adelaide, Australia). Outcomes were assessed in the clinic after an overnight fast, with water consumed as required to avoid dehydration.
SCr was measured on a clinical analyzer (Beckman AU480; Beckman Coulter, Inc., Brea, CA) using a standardized assay (Beckman kit #OSR6178). eGFR (mL/min/1.73 m2) was calculated according to CKD-EPI Eq.3 which has greater accuracy compared to the Modification of Diet in Renal Disease (MDRD) equation at higher GFR (>60 mL/min/1.73 m2).4 Creatinine clearance (CrCl, mL/min) was estimated using the Cockcroft–Gault equation5 with fat free mass (FFM—whole-body dual-energy X-ray absorptiometry, Lunar Prodigy; General Electric Corporation, Madison, WI) adjustment to improve estimation in obesity,6 and the Salazar–Corcoran Eq.7 developed for use in obese individuals based on estimated FFM. AER, urinary albumin, and urea obtained from 24 hours urine samples were measured at a certified commercial laboratory (Institute of Medical and Veterinary Science Pathology, Adelaide, Australia).
Protein intake (g/day) was estimated from 24 hours urinary urea excretion at weeks 0, 24, and 52.8,9 Dietary compliance was assessed randomly from 7 consecutive days of daily weighed food records for every 14-day period, analyzed using Foodworks Professional Edition Version 7 (Xyris Software 2012, Highgate Hill, Australia). Both dietary patterns achieved a high level of compliance as reported.2
Statistical Analyses
Baseline group differences were compared by independent t tests and χ2 tests for continuous and categorical variables, respectively. AER and urinary albumin were reciprocally transformed to improve normality before analysis. Comparisons of changes over time between diets were analyzed by random-coefficient analysis, restricted maximum likelihood, mixed effects model using an unstructured covariance with data assumed to be missing at random. The model included all available data from participants who commenced the study and contained the following fixed effects: main effect for each time-point, diet group assignment, and diet group by time-point interaction. The effect of the use of renin-angiotensin system blocking agents including angiotensin-converting-enzyme inhibitors and angiotensin receptor antagonists on the renal outcomes investigated was examined in sensitivity analyses that included this as a covariate. Estimated marginal means (95% confidence intervals, CI) and change from weeks 0 to 52 are reported. Repeated measures ANOVA with diet as between-subjects factor and time as within-subject factor was used to assess changes in dietary protein intake. All analyses were performed using SPSS 20.0 for Windows (SPSS, Inc., Chicago, IL); statistical tests were 2-tailed with statistical significance at P < 0.05.
RESULTS
At baseline, there were no significant clinical or biochemical differences between groups (Table 1). SCr and eGFR were within the normal range (Table 2); 7 participants (LC:4, HC:3) had moderately increased AER (30–300 mg/24 h).10 Antihypertensive therapy use was similar in both groups (LC:41, HC:35, P = 0.29) with 56% of participants using renin-angiotensin system blocking agents (LC:32, HC:32). Sixty-eight percent of participants completed the study with no difference between groups (LC:41/58, HC:37/57; P = 0.51).
TABLE 1.
Baseline Participant Characteristics∗
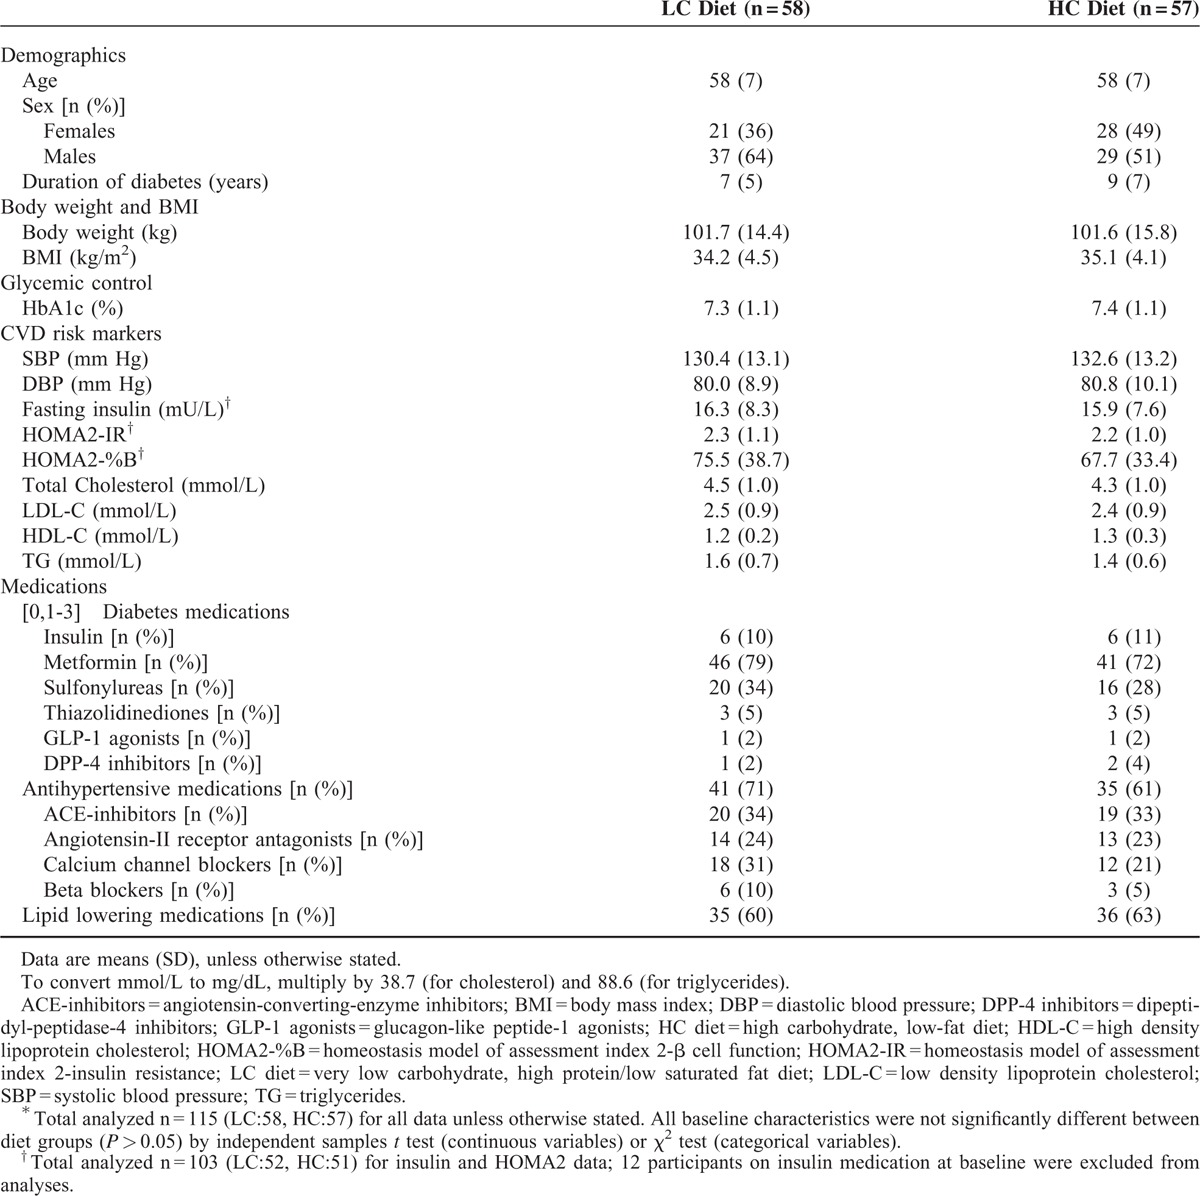
TABLE 2.
Estimated Marginal Means and Changes (95% CI) in Weight, Blood Pressure, Albuminuria, Serum Creatinine, Estimated Glomerular Filtration Rate, and Creatinine Clearance at Baseline and After 52 weeks on a Very Low Carbohydrate, High Protein, Low Saturated Fat (LC) Diet or an Isocaloric High Carbohydrate, Low-Fat (HC) Diet∗
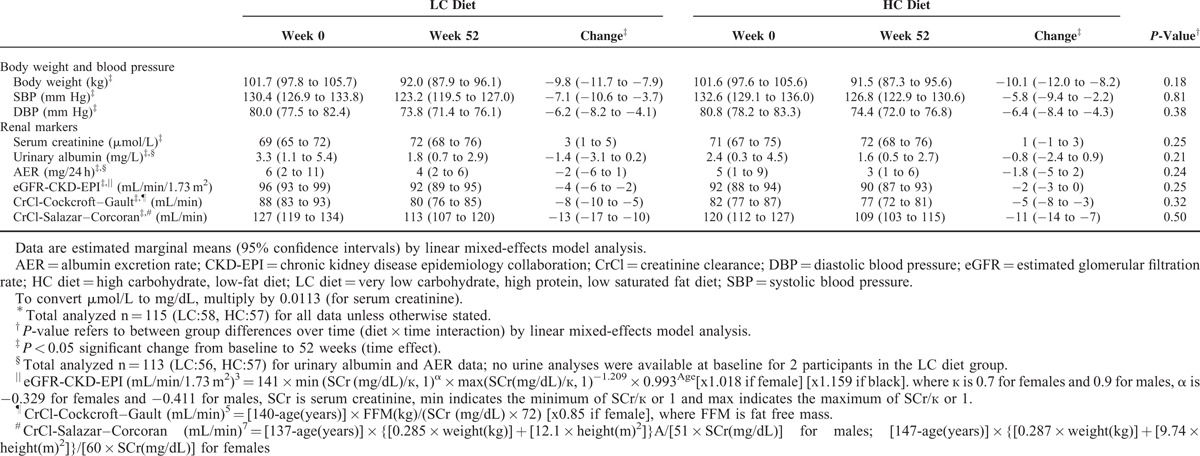
Over the 52 weeks, reductions in weight and blood pressure were comparable between groups (P ≥ 0.18; Table 2). Nine participants reduced (LC:4, HC:5) and 3 increased (LC:2, HC:1) use of renin-angiotensin system blocking agents.
Self-reported protein intake was higher in LC compared to HC (LC:106.1 ± 18.9 g/d (26% energy), 1.2 g/kg/d; HC:78.5 ± 14.8 g/d (18% energy), 0.9 g/kg/d), P < 0.001. Protein intakes estimated from 24 hours urinary urea reflected similar differences (weeks 0, 24, and 52; LC: 112.1 ± 34.3, 118.4 ± 33.8, 120.1 ± 38.2 g/d; 1.1 ± 0.3, 1.4 ± 0.4, 1.3 ± 0.4 g/kg/d; HC: 107.7 ± 28.4, 89.8 ± 18.4, 95.8 ± 27.8 g/d; 1.0 ± 0.3, 1.0 ± 0.2, 1.1 ± 0.3 g/kg/d; P < 0.001).
Over time, SCr increased, while eGFR, CrCl, and AER decreased, with no difference in the responses between groups (Table 2). Sensitivity analyses that adjusted for the use of renin-angiotensin system blocking agents did not alter the results of the primary model. At baseline, 7 participants (LC:4, HC:3) had pathological albuminuria (range 41–101 mg/24 h). After 52 weeks, 4 of these participants (LC:2, HC:2) became normoalbuminuric, 2 (LC:1, HC:1) remained pathologically albuminuric, and 1 LC participant withdrew before week 52. All participants who were normoalbuminuric at baseline remained so after 52 weeks.
DISCUSSION
GFR and albuminuria are established indicators of the presence and progression of DKD.10 This study showed these markers responded similarly following consumption of either energy-matched LC or HC weight-loss diets administered as part of a holistic lifestyle modification program incorporating regular exercise. The overall conclusion was not altered after controlling for antihypertensive treatment. Within the limits of a modest sample size, our results in obese adults with T2DM, but without overt DKD, confirm and extend the findings of previous investigations conducted in people without diabetes and individuals with preexisting DKD.11–14 The literature supporting the utility of protein restriction in slowing GFR decline or delaying DKD progression is controversial. Acknowledging the limitations of observational studies (such as the possibility of unaccounted residual confounding), prospective cohort studies of people with T2DM and without DKD at baseline have found no association between protein intake and eGFR decline,15 or a negative association between protein intake and risk of DKD.16 Although earlier meta-analyses have reported a small but statistically significant reduction in GFR decline and incidence of renal failure or death from dietary protein restriction, only a small number of people with diabetes (predominantly T1DM) were studied and nonrandomized trials were included.17–19 Moreover a reduced risk of renal failure attributed to low protein diets might reflect a delayed initiation of dialysis due to amelioration of uremic symptoms rather than an actual retardation of renal function decline. A recent meta-analysis of randomized controlled trials showed that a low protein diet was not associated with a significant improvement in renal function in people with DKD when compared with a normal protein diet (0.9 g/kg/day cf. 1.3 g/kg/day).20 The present study did not specifically examine a low protein diet (0.8 g/kg/day, 16–18% total energy) recommended by current clinical guidelines for individuals with DKD.21 However, actual protein intakes reported in low protein intervention groups have typically ranged from 0.7 to 1.1 g/kg/d19,20 which includes the mean protein intake range of the comparison HC diet group in this study (1–1.1 g/kg/d) that more likely reflects a typical protein intake. Collectively, these data suggest that compared to a traditional HC diet, consumption of an LC, high protein diet (1.1–1.4 g/kg/d) derived from both plant and animal protein sources, does not adversely affect renal function in individuals with T2DM. This raises the clinical relevance of LC diets as a tenable weight management strategy for individuals with T2DM and comorbidities like hypertension and dyslipidemia, to improve glycemic control and reduce CVD and diabetes complications risk.2
Irrespective of any differences between the diets, both groups experienced an overall reduction in eGFR and CrCl despite substantial weight loss (9.1%), improvement in glycemic control (HbA1c −1%, −10.9 mmol/mol), reductions in blood pressure (−6/−6 mm Hg) and albuminuria.2 The 2% to 4% decrease in eGFR observed in the present study is compatible with the expected age-related change in eGFR in T2DM22,23 and is unlikely to be clinically significant. Previous studies that reported declines in eGFR following weight loss have examined individuals without renal impairment,11,14 compared to those that reported increases in eGFR that examined individuals with preexisting renal dysfunction.13,14 This suggests that weight loss-induced increases in eGFR may more likely occur in populations with preexisting renal dysfunction, a phenomenon that has also been observed postbariatric surgery.24 Moreover, the overall reduction in albuminuria over time and the normalization of levels in patients with albuminuria at baseline support the benefits of weight loss.25
A limitation of this study was that GFR was estimated rather than directly measured. Clearance of inulin and radioisotope-labeled filtration markers (iGFR) are considered “gold standards” for measuring GFR. Nevertheless, equations for eGFR and CrCl are used widely in clinical practice for drug dosing, screening, risk stratification and for monitoring DKD progression. The equations used in this study have been validated in obese populations, including individuals with diabetes and conferred greater accuracy compared with other equations against iGFR.6 Hence, this methodological approach is considered appropriate for the purpose of comparing the long-term renal effects of differing diet regimens.
Variations in determinants of creatinine generation (eg, FFM, exercise, and diet) can also influence eGFR calculations. The combined effect of a similar FFM loss (−1.7 kg) and increase in moderate to vigorous exercise2 could explain the increase in SCr26 and consequent reductions in creatinine-based eGFR calculations observed in both groups, potentially masking any diet-induced differences in renal function. Changes in body composition and the nonsteady-state clearance of endogenous filtration markers expose the limitations of existing methods and the complexity of assessing renal function after weight loss. The use of combined creatinine-cystatin C equations may improve precision by minimizing the influence of any particular non-GFR determinant.27,28
In conclusion, a hypocaloric LC diet and an energy-matched traditional HC diet had similar effects on markers of renal function in people with T2DM without DKD over a 12-month period. These results corroborate evidence that consumption of an LC weight loss diet does not adversely affect renal function in such populations. Longer-term follow-up studies are required to determine whether these renal effects are sustained during long-term weight loss maintenance and to establish if long-term adherence to the diets results in differences in the development and progression of DKD. Examining the effects of LC diets in populations with preexisting vascular complications besides nephropathy would further advance our understanding of the utility of LC diets.
Acknowledgments
We thank the volunteers for their participation. We gratefully acknowledge the work of the Clinical Research Team at the Commonwealth Scientific and Industrial Research Organisation—Animal, Food and Health Sciences, Adelaide, South Australia: Ann McGuffin, Julia Weaver and Vanessa Courage for coordinating the trial; Pennie Taylor, Janna Lutze, Paul Foster, Gemma Williams, Hannah Gilbert, and Fiona Barr for assisting in designing and implementing the dietary intervention; Lindy Lawson and Theresa Mckinnon for nursing expertise; Vanessa Russell, Cathryn Pape, Candita Dang, Andre Nikolic, and Sylvia Usher for performing the biochemical assays; Dr. Thomas Wycherley for conducting the DEXA scans; Julie Syrette for assisting with the data management; Kylie Lange and Mary Barnes for assisting with the statistical analyses; Luke Johnston and Annie Hastwell (Fit for Success, SA), Kelly French, Jason Delfos, Kristi Lacey-Powell, Marilyn Woods, John Perrin, Simon Pane, Annette Beckette (SA Aquatic Centre & Leisure Centre), and Angie Mondello and Josh Gniadek (Boot Camp Plus, SA), for conducting the exercise sessions.
Footnotes
Abbreviations: AER = albumin excretion rate, CKD-EPI = Chronic Kidney Disease Epidemiology Collaboration, CrC = creatinine clearance, CVD = cardiovascular disease, DKD = diabetic kidney disease, eGFR = estimated glomerular filtration rate, FFM = fat free mass, HC diet = high carbohydrate, low-fat diet, LC diet = very low carbohydrate, high protein, low saturated fat diet, SCr = serum creatinine, T2DM = type 2 diabetes mellitus.
This study was supported by a National Health and Medical Research Council of Australia Project Grant (103415). J.T. was supported by a postgraduate research scholarship from the Agency for Science, Technology and Research (A-STAR), Singapore. Funding sponsors had no role in the design, conduct, or reporting of the study or the decision to submit the manuscript for publication.
Trial Registration: http://www.anzctr.org.au/, ANZCTR No. ACTRN12612000369820.
Author contributions: Grant Brinkworth is the guarantor of this work and, as such had full access to all data in the study and takes responsibility for the integrity of the data and the accuracy of the data analysis. Study concept and design: All authors. Analysis and interpretation of data: All authors. Drafting of the manuscript: J.T. and G.D.B. Critical revision the manuscript for intellectual content: N.L.M., C.H.T., M.N., J.D.B., G.A.W., and W.S.Y. Read and approved the final manuscript: All authors. Obtained funding: G.D.B., M.N., J.D.B., N.L.M., and C.H.T. Study supervision: G.D.B., N.L.M., C.H.T., M.N., and J.D.B.
The authors have no conflicts of interest to disclose.
REFERENCES
- 1.Crowe TC. Safety of low-carbohydrate diets. Obes Rev 2005; 6:235–245. [DOI] [PubMed] [Google Scholar]
- 2.Tay J, Luscombe-Marsh ND, Thompson CH, et al. Comparison of low- and high-carbohydrate diets for type 2 diabetes management: a randomized trial. Am J Clin Nutr 2015; 102:780–790. [DOI] [PubMed] [Google Scholar]
- 3.Levey AS, Stevens LA, Schmid CH, et al. A new equation to estimate glomerular filtration rate. Ann Intern Med 2009; 150:604–612. [DOI] [PMC free article] [PubMed] [Google Scholar]
- 4.Earley A, Miskulin D, Lamb EJ, et al. Estimating equations for glomerular filtration rate in the era of creatinine standardization: a systematic review. Ann Intern Med 2012; 156:785–795.W-270, W-271, W-272, W-273, W-274, W-275, W-276, W-277, W-278. [DOI] [PubMed] [Google Scholar]
- 5.Gault MH, Longerich LL, Harnett JD, et al. Predicting glomerular function from adjusted serum creatinine. Nephron 1992; 62:249–256. [DOI] [PubMed] [Google Scholar]
- 6.Jesudason DR, Clifton P. Interpreting different measures of glomerular filtration rate in obesity and weight loss: pitfalls for the clinician. Int J Obes 2012; 36:1421–1427. [DOI] [PubMed] [Google Scholar]
- 7.Salazar DE, Corcoran GB. Predicting creatinine clearance and renal drug clearance in obese patients from estimated fat-free body mass. Am J Med 1988; 84:1053–1060. [DOI] [PubMed] [Google Scholar]
- 8.Masud T, Manatunga A, Cotsonis G, et al. The precision of estimating protein intake of patients with chronic renal failure. Kidney Int 2002; 62:1750–1756. [DOI] [PubMed] [Google Scholar]
- 9.Maroni BJ, Steinman TI, Mitch WE. A method for estimating nitrogen intake of patients with chronic renal failure. Kidney Int 1985; 27:58–65. [DOI] [PubMed] [Google Scholar]
- 10.Stevens PE, Levin A. Kidney Disease: Improving Global Outcomes Chronic Kidney Disease Guideline Development Work Group Members. Evaluation and management of chronic kidney disease: synopsis of the kidney disease: improving global outcomes 2012 clinical practice guideline. Ann Intern Med 2013; 158:825–830. [DOI] [PubMed] [Google Scholar]
- 11.Brinkworth GD, Buckley JD, Noakes M, et al. Renal function following long-term weight loss in individuals with abdominal obesity on a very-low-carbohydrate diet vs high-carbohydrate diet. J Am Diet Assoc 2010; 110:633–638. [DOI] [PubMed] [Google Scholar]
- 12.Friedman AN, Ogden LG, Foster GD, et al. Comparative effects of low-carbohydrate high-protein versus low-fat diets on the kidney. Clin J Am Soc Nephrol 2012; 7:1103–1111. [DOI] [PMC free article] [PubMed] [Google Scholar]
- 13.Tirosh A, Golan R, Harman-Boehm I, et al. Renal function following three distinct weight loss dietary strategies during 2 years of a randomized controlled trial. Diabetes Care 2013; 36:2225–2232. [DOI] [PMC free article] [PubMed] [Google Scholar]
- 14.Jesudason DR, Pedersen E, Clifton PM. Weight-loss diets in people with type 2 diabetes and renal disease: a randomized controlled trial of the effect of different dietary protein amounts. Am J Clin Nutr 2013; 98:494–501. [DOI] [PubMed] [Google Scholar]
- 15.Lin J, Hu FB, Curhan GC. Associations of diet with albuminuria and kidney function decline. Clin J Am Soc Nephrol 2010; 5:836–843. [DOI] [PMC free article] [PubMed] [Google Scholar]
- 16.Dunkler D, Dehghan M, Teo KK, et al. Diet and kidney disease in high-risk individuals with type 2 diabetes mellitus. JAMA Intern Med 2013; 173:1682–1692. [DOI] [PubMed] [Google Scholar]
- 17.Pedrini MT, Levey AS, Lau J, et al. The effect of dietary protein restriction on the progression of diabetic and nondiabetic renal diseases: a meta-analysis. Ann Intern Med 1996; 124:627–632. [DOI] [PubMed] [Google Scholar]
- 18.Kasiske BL, Lakatua JD, Ma JZ, et al. A meta-analysis of the effects of dietary protein restriction on the rate of decline in renal function. Am J Kidney Dis 1998; 31:954–961. [DOI] [PubMed] [Google Scholar]
- 19.Robertson L, Waugh N, Robertson A. Protein restriction for diabetic renal disease. Cochrane Database Syst Rev 2007; CD002181. [DOI] [PMC free article] [PubMed] [Google Scholar]
- 20.Pan Y, Guo LL, Jin HM. Low-protein diet for diabetic nephropathy: a meta-analysis of randomized controlled trials. Am J Clin Nutr 2008; 88:660–666. [DOI] [PubMed] [Google Scholar]
- 21.Tuttle KR, Bakris GL, Bilous RW, et al. Diabetic kidney disease: a report from an ADA Consensus Conference. Diabetes Care 2014; 37:2864–2883. [DOI] [PMC free article] [PubMed] [Google Scholar]
- 22.Rius F, Pizaro E, Salinas I, et al. Age as a determinant of glomerular filtration rate in non-insulin-dependent diabetes mellitus. Nephrol Dial Transplant 1995; 10:1644–1647. [PubMed] [Google Scholar]
- 23.Fontsere N, Salinas I, Bonal J, et al. Are prediction equations for glomerular filtration rate useful for the long-term monitoring of type 2 diabetic patients? Nephrol Dial Transplant 2006; 21:2152–2158. [DOI] [PubMed] [Google Scholar]
- 24.Abou-Mrad RM, Abu-Alfa AK, Ziyadeh FN. Effects of weight reduction regimens and bariatric surgery on chronic kidney disease in obese patients. Am J Physiol Renal Physiol 2013; 305:F613–F617. [DOI] [PubMed] [Google Scholar]
- 25.Afshinnia F, Wilt TJ, Duval S, et al. Weight loss and proteinuria: systematic review of clinical trials and comparative cohorts. Nephrol Dial Transplant 2010; 25:1173–1183. [DOI] [PubMed] [Google Scholar]
- 26.Baxmann AC, Ahmed MS, Marques NC, et al. Influence of muscle mass and physical activity on serum and urinary creatinine and serum cystatin C. Clin J Am Soc Nephrol 2008; 3:348–354. [DOI] [PMC free article] [PubMed] [Google Scholar]
- 27.Stevens LA, Coresh J, Schmid CH, et al. Estimating GFR using serum cystatin C alone and in combination with serum creatinine: a pooled analysis of 3,418 individuals with CKD. Am J Kidney Dis 2008; 51:395–406. [DOI] [PMC free article] [PubMed] [Google Scholar]
- 28.Fan L, Inker LA, Rossert J, et al. Glomerular filtration rate estimation using cystatin C alone or combined with creatinine as a confirmatory test. Nephrol Dial Transplant 2014; 29:1195–1203. [DOI] [PMC free article] [PubMed] [Google Scholar]