Abstract
Background:
The plasma Epstein–Barr virus (EBV) DNA level in patients with nasopharyngeal carcinoma (NPC) performs as an appealing prognostic factor, but conclusions of its prognostic values from previous studies are inconsistent. In this study, we performed a comprehensive meta-analysis to evaluate the prognostic value of EBV DNA level in patients with NPC.
Methods:
Published studies were searched in PubMed. The baseline characteristics of patients, overall survival (OS), and other survival outcomes were extracted. Pooled hazard ratio (HR), 95% confidence interval (CI), and P value were calculated to estimate the prognostic value of EBV DNA level. Each cut-off value mentioned in the studies was obtained. Kaplan–Meier curves were used to extract data, and graphical survival plots were extracted for calculating HR when the study did not describe the information directly.
Results:
This meta-analysis pooled 23 eligible studies including 10,732 patients with NPC. The pooled HR (95% CI) of pretreatment plasma EBV DNA level (pre-DNA) for OS was 2.78 (2.19, 3.55), and the HR (95% CI) of posttreatment plasma EBV DNA level (post-DNA) for OS was 5.43 (2.72, 10.82), suggesting that EBV DNA level was significantly correlated to the outcomes of patients with NPC.
Conclusion:
High expression levels of EBV DNA predicts poor prognosis in NPC.
Keywords: Epstein–Barr virus DNA, meta-analysis, nasopharyngeal carcinoma, prognosis
1. Introduction
Nasopharyngeal carcinoma (NPC) is a highly ethnic and geographical cancer that is relatively prevalent in South East Asia and mainland China.[1] The leading cause of death in patients with NPC is distant metastasis; thus early detection is of great importance in the prevention of metastasis in clinical practice.[2] However, the occurrence of occult primary tumors increases the difficulty of diagnosing the disease early and accurately. Meanwhile, computed tomography (CT) and magnetic resonance imaging (MRI) are effective only when the diameter of the lesion is larger than 5 mm, which will delay the discovery of the tumor, and the use of imaging for diagnosis is prohibitive in some developing countries for its high cost. Furthermore, imageological examinations cannot accurately predict the prognosis and assess the effectiveness of the targeted drugs. Therefore, a noninvasive and cost-effective method for the early prediction of the outcome of NPC is urgently needed.
Nawroz et al[3] had developed a new method for detecting tumor-associated DNA levels in peripheral circulation. Also, the DNA level of the Epstein–Barr virus (EBV) was reported to be associated with NPC and could be used as an important tool to predict NPC progression.[1,4] Plasma EBV DNA level detected by real-time polymerase chain reaction (RT-PCR) has been widely used to determine tumor stage and monitoring NPC progression which has good sensitivity and specificity,[5,6] but controversy still exists in the clinical use of EBV DNA level. Previous study[7] also showed conflicting and heterogeneous results for the clinical use of EBV DNA level. Most of the previous studies focused on improving the efficiency of EBV DNA level in the prognosis of patients from high-incidence area of nasopharyngeal carcinoma, but few studies had investigated the prognostic value of EBV DNA level quantitatively. So there still lacks a standard that evaluates the effectiveness of using different cut-off values to predict the outcomes of patients. Our study aims to investigate the prognostic value of plasma EBV DNA level in NPC patients and to suggest an optimal cut-off value of the EBV DNA level to predict the survival outcome of NPC patients.
2. Materials and methods
2.1. Search strategy
Comprehensive search was conducted in PubMed (last update on January 2015), using a combination of the following keywords: “Epstein–Barr virus DNA,” “prognosis,” “prognostic,” and “nasopharyngeal carcinoma.” Because it is a meta-analysis, no ethics committee or institutional review board approval was necessary for this study.
2.2. Inclusion/exclusion criteria
Studies were considered eligible only when they met all of the following inclusion criteria: NPC patients were pooled; the EBV DNA level in the plasma was measured; the association between EBV DNA level and survival outcome (overall survival [OS], disease-free survival [DFS], distant metastasis-free survival [DMFS], progression-free survival [PFS], or recurrence-free survival [RFS]) was investigated; and the Kaplan–Meier survival curves of the survival outcomes and the log-rank P values were reported. Studies that did not directly report hazard ratios (HRs), 95% confidence intervals (CIs), or P values were also included when HR could be calculated by the methods developed by Tierney et al,[8] Williamson et al,[9] and Parmar et al.[10] Exclusion criteria were as follows: studies were published as review articles or letters; studies focused on analyzing other tumors and were not specific for NPC; and studies lacked vital information for analysis.
2.3. Data extraction
Two reviewers assessed the eligibility of each study independently. Disagreements were resolved through discussion within our research team. All the data of included studies were extracted by 2 independent reviewers and were carefully checked by a third author. Any disagreements were discussed until a final form was agreed upon. The data extracted from each study contained 3 parts:
Study characteristics: first author, country, year of publication, study design, and sample size.
Demographic characteristics of the studies: mean age, tumor grade, histological type, and other clinical characteristics.
Outcomes: HR, OS, DFS, DMFS, PFS, RFS, 95% CI, and P value. Each cut-off value mentioned in the studies was obtained.
Kaplan–Meier curves were used to extract data and graphical survival plots were extracted to calculate HR when the study did not directly describe the information.
2.4. Methodological assessment
To assess the quality of each study, 2 investigators independently scored the studies using the Newcastle–Ottawa Scale (NOS) criteria.[11] The score assessed 3 aspects of the study: subject selection: 0 to 4; comparability of subject: 0 to 2; and (3) clinical outcome: 0 to 3. The NOS scores ranged from 0 to 9, and the studies with 7 scores or more were graded as the high-quality ones in the scale.
2.5. Statistical analysis
To evaluate the prognostic value of the EBV DNA level, we used log HR and SE for aggregation of the survival results in the meta-analysis. However, a number of studies did not directly provide vital information, such as HRs, 95% CIs, and P values. Therefore, we referred to the methods developed by Tierney et al,[8] Williamson et al,[9] and Parmar et al,[10] and calculated the necessary statistics on the basis of available numerical data with the Excel Tools developed by Tierney et al to calculate the log HR and SE. Q test and I2 test were used to measure the heterogeneity among studies. A random-effect model (Der Simonian and Laird method) was applied if heterogeneity existed (P < 0.05, I2 > 50%), whereas the fixed-effect model was utilized in the absence of between-study heterogeneity (P ≥ 0.05, I2 ≤ 50%).[12] Sensitivity analysis was performed to examine the effect of variations in study quality excluding the studies with a NOS score of less than 6. Publication bias was assessed by Begg test (P < 0.05 indicates statistically significant). All calculations cited above were performed using Stata 11.0 (Stata Corporation, College Station, TX).[13,14]
3. Results
3.1. Eligible studies
The initial search in PubMed yielded 146 studies. After review of titles and abstracts, 27 studies were excluded because they were letters, review articles, or written in non-English languages, or irrelevant to the current study. A total of 119 articles were further reviewed. Eighty-four studies were then excluded because they were not related to the topic. A detailed evaluation was performed for the remaining 35 studies. Four of them were laboratory research and 8 of them lacked necessary data for calculations. Finally, 23 potentially relevant studies[4–7,15–33] including 10,732 patients were eligible for the final analysis. The selection process was shown in Fig. 1.
Figure 1.
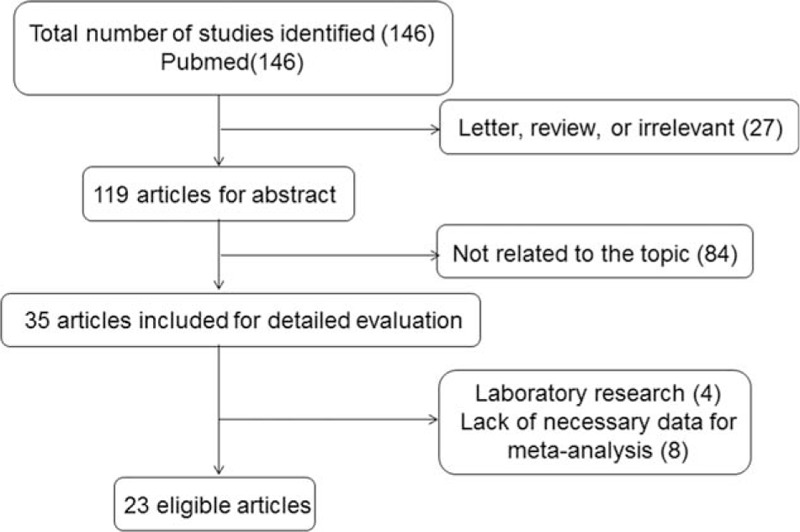
Selection of studies.
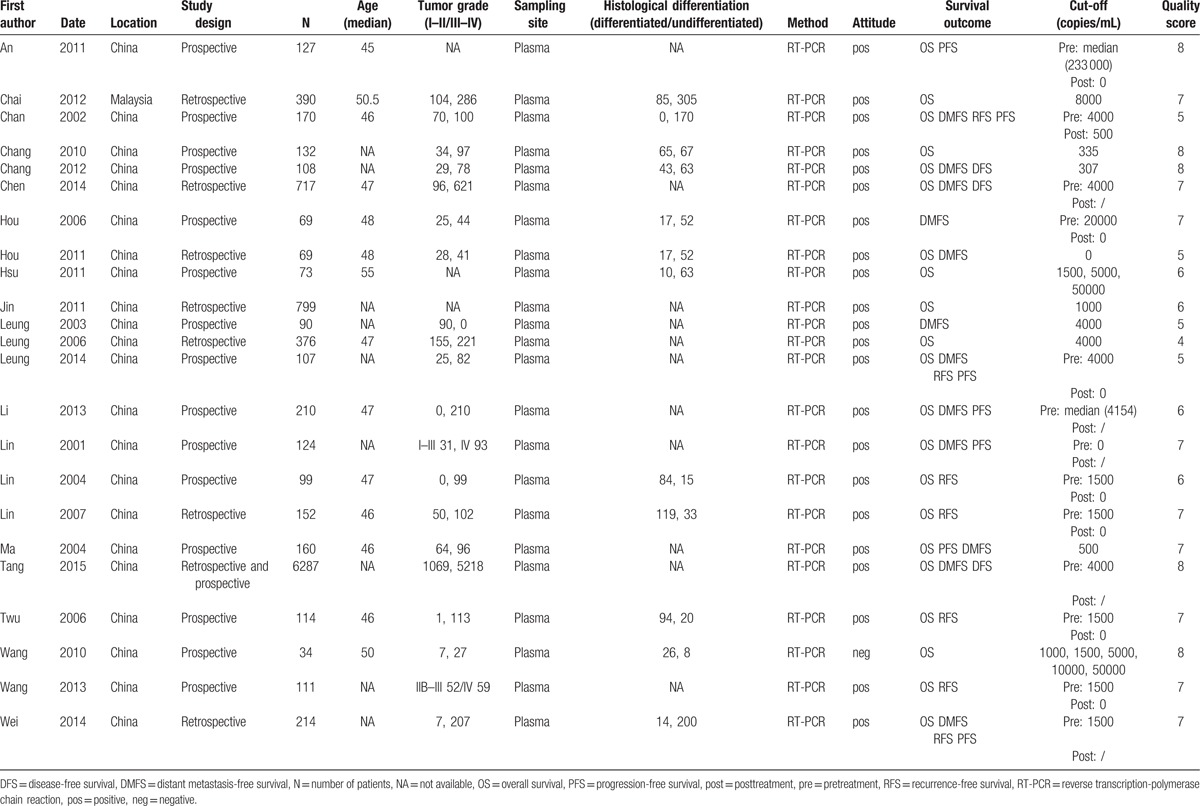
The number of patients in the studies ranged from 34 to 6287 (mean 466). These patients came from 2 countries (22 from China and 1 form Malaysia). The studies were published between 2001 and 2015. Nineteen studies directly provided HRs and CIs, and the remaining 4 studies required additional calculations to get HRs and CIs.[4,21,23,25] We listed the articles containing different cut-off values, tumor grades, and histological types, and discussed them separately. Eighteen of the 23 included studies got 6 scores or more in methodological assessment. The characteristics of the included studies were shown in Table 1.
Table 1.
Characteristics of all identified studies.
3.2. Overall analyses
The meta-analysis showed that the EBV DNA levels in the plasma collected before (pre-DNA) and after treatment (post-DNA) both exhibited significant prognostic value. The HR (95% CI) of pre-DNA was 2.78 (2.19, 3.55) for OS, 2.84 (2.39, 3.39) for DFS, 3.26 (2.67, 3.98) for DMFS, 2.42 (1.81, 3.24) for PFS, and 2.07 (1.51, 2.85) for RFS. Also, the HR (95% CI) of post-DNA was 5.43 (2.72, 10.82) for OS, 8.19 (1.96, 34.31) for DMFS, 3.55 (1.46, 8.61) for PFS, and 7.63 (4.06, 14.35) for RFS (Table 2, Figs. 2 and 3).
Table 2.
Summary of meta-analysis results.
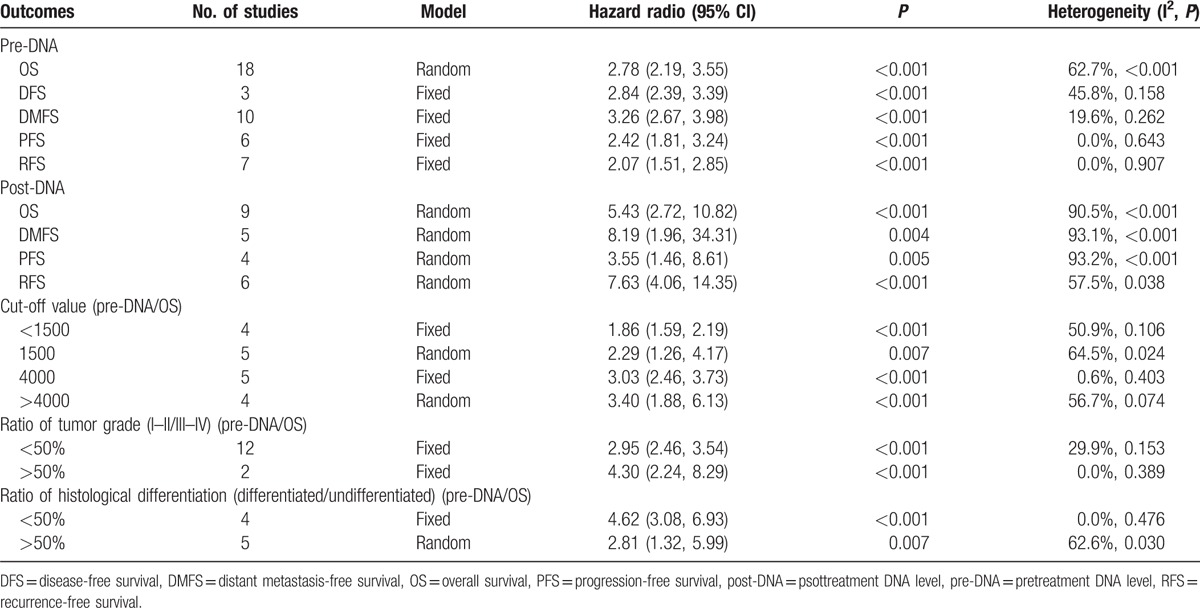
Figure 2.
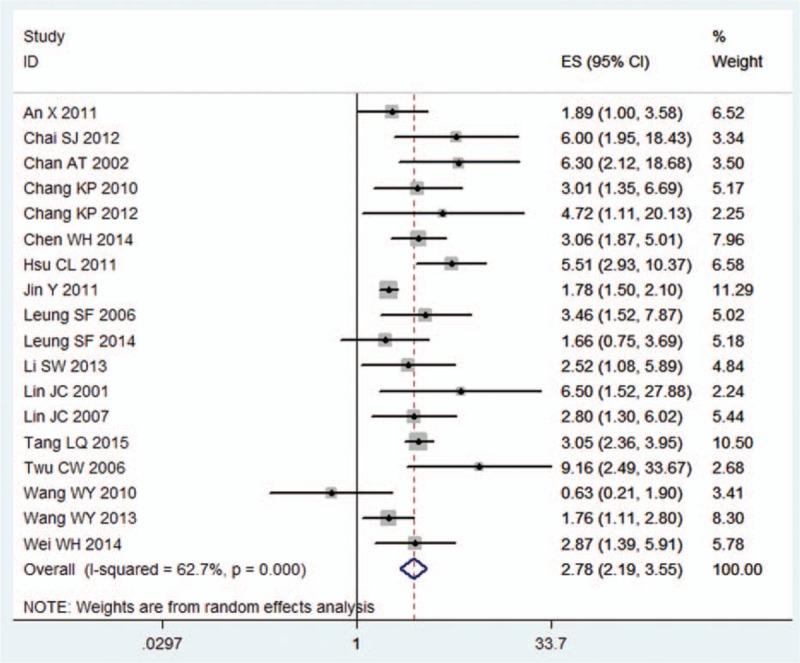
Hazard ratio (HR) of pretreatment EBV DNA level for overall survival. EBV = Epstein–Barr virus.
Figure 3.
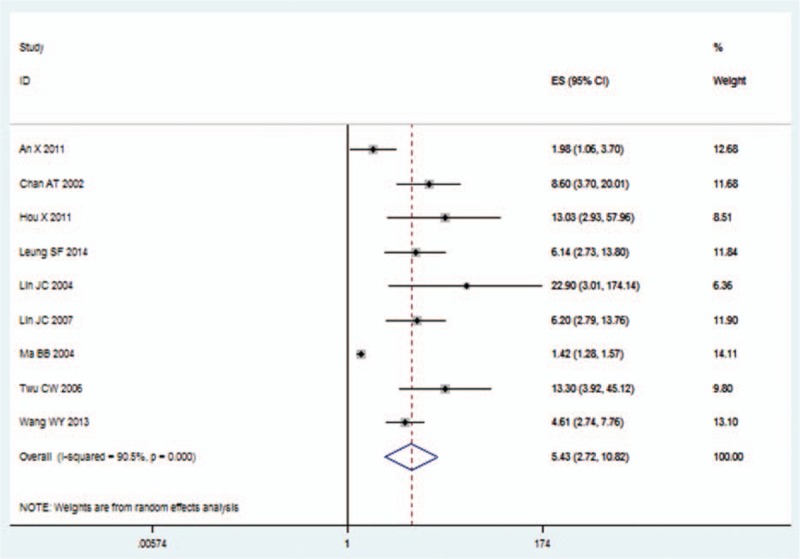
Hazard ratio (HR) of posttreatment EBV DNA level for overall survival. EBV = Epstein–Barr virus.
3.3. Subgroup analysis
We used the studies that examined the prognostic value of pretreatment plasma EBV DNA level for OS to do subgroup analysis. We summarized the results of the subgroup analyses in Table 2. The prognostic significance of the cut-off values (ie, <1500, 1500, 4000, and >4000 copies/mL) was first evaluated. EBV DNA level with a cut-off value <1500 copies/mL (including 0) was correlated with poor OS (HR 1.86, 95% CI 1.59–2.19, n = 4). EBV DNA level with the cut-off value of 1500 copies/mL was correlated with poorer OS (HR 2.29, 95% CI 1.26, 4.17, n = 5). The EBV DNA level with the cut-off value at 4000 copies/mL was associated with even poorer OS (HR 3.03, 95% CI 2.46, 3.73, n = 5). Also, the EBV DNA level with cut-off value >4000 copies/mL showed the worst OS (HR 3.40, 95% CI 1.88, 6.13), n = 4).
In the subgroup analysis of the tumor grade, tumor grade I to II/III to IV <50% or >50% was used to represent that the ratio of patient number in grade I to II to the number in grade III to IV is less than or larger than 50%. Likewise, as to the histological differentiation, differentiated/undifferentiated <50% or >50% was used to represent that the ratio of differentiated patient number to the undifferentiated number is less than or larger than 50%. For tumor grade and histological differentiation, the above numbers in grade I to II or III to IV, differentiated or undifferentiated refer to groups of individuals rather than values for a person. The HR (95% CI) in the tumor grade I to II/III to IV <50% group for OS was 2.95 (2.46, 3.54) (n = 12). The HR (95% CI) in the tumor grade I to II/III to IV >50% group for OS was 4.30 (2.24, 8.29) (n = 2). In the subgroup of histological differentiation, poor prognostic effects were observed in >50% group (OS: HR 2.81, 95% CI 1.32, 5.99, n = 5) and poorer in <50% group (OS: HR 4.62, 95% CI 3.08, 6.93, n = 4) (Table 2).
3.4. Sensitivity analysis
Eighteen studies which scored 6 or more on the NOS were included in the sensitivity analysis (Table 3). Except for the post-DNA meta-analysis for DMFS, there was no change in the significance of the other outcomes. The degree of between-study heterogeneity decreased slightly for DMFS data of pre-DNA, and DMFS, PFS, and RFS data of post-DNA.
Table 3.
Sensitivity analysis excluding studies with <6 score on the Newcastle–Ottawa Scale.

3.5. Assessment of publication bias
Begg test was performed to evaluate publication bias. No publication bias was observed in the overall analyses or subgroup analyses. The Begg publication bias plot of 18 studies that reported pre-DNA for OS was provided in Fig. 4.
Figure 4.
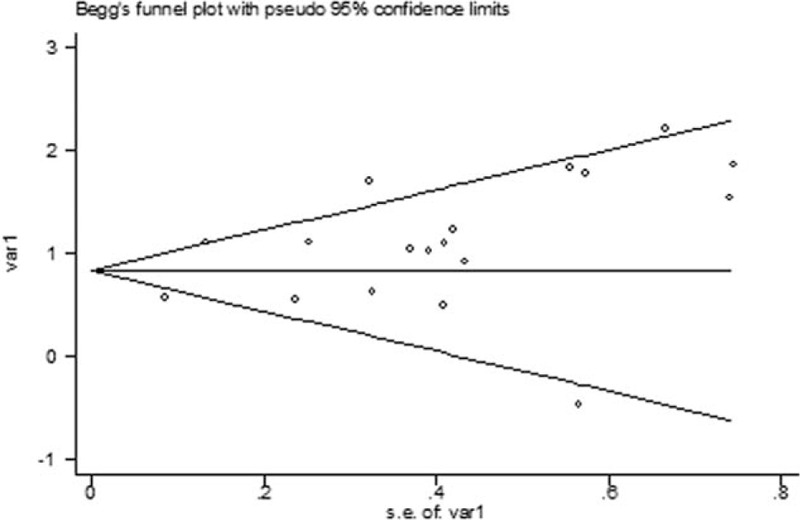
The Begg publication bias plot of 18 studies that reported pre-DNA for OS. OS = overall survival.
4. Discussion
Our study was based on a large pool of clinical studies and was conducted to evaluate the effectiveness and to identify the value of EBV DNA level as a tool to predict the survival outcomes of NPC. Twenty-three studies, including 10,732 patients, were combined to evaluate the prognostic value of EBV DNA level. According to Hayes criterion,[34] a prognostic factor with relative risk >2 was a useful value. In this study, the prognostic value of EBV DNA level in NPC was revealed (Table 2, Figs. 2 and 3). The prognostic ratio was obtained from multivariate analysis, and if not, we used univariate ratio instead. Our result provided evidence that both pretreatment and posttreatment plasma EBV DNA levels were significantly associated with poor survival of patients with NPC. This result was consistent with previous studies.[5,35] In summary, EBV DNA expression level can be used as a promising prognostic factor to predict the outcomes of patients with NPC.
Previous studies revealed that EBV DNA level had a good prognostic value of OS and PFS in patients with nonmetastatic NPC treated with radiotherapy and in those with locally advanced NPC treated with concurrent chemoradiotherapy.[4] From clinical perspective,[36] the application of EBV DNA level detection in serum exhibits many advantages such as time-saving and cost-effective. Previous studies[37,38] also showed that this technique yielded results with high accuracy and effectiveness.
In the past decades, EBV DNA level was considered as a prognostic factor of NPC. Considering that needle biopsy is rarely applied in NPC for its invasiveness, RT-PCR is a quite safe and convenient alternative because the sampling site is the serum. RT-PCR is applied as the main approach for the detection of EBV DNA level. Previous study[39] has found that RT-PCR is limited to polymorphisms that may occur at the 3’ end of miRNAs because these miRNAs display a single-stranded structure, and the significance of these variations remains unclear. Compared with miRNA, EBV DNA level exhibits a more stable expression and can be easily evaluated by RT-PCR with high analytical sensitivity and specificity. Although the use of EBV DNA level for prediction is very promising for patients with NPC and is applied in most relevant studies, a universal cut-off value of EBV DNA level is hard to define for lack of sufficient EBV DNA expression level data. For this reason, our study is trying to evaluate different cut-off values and to determine a universal cut-off value.
We compared the results from studies using different cut-off values. Some researchers[4,22] thought that 0 copy/mL (detectable vs undetectable) was the best cut-off value in predicting prognosis. Our results suggested that HR of OS was the higher with the increase of the cut-off value, and that the highest HR occurred in the cut-off value >4000 copies/mL group (Table 2). In most studies, the measurement of plasma EBV DNA level was conducted via RT-PCR. The result of RT-PCR could be affected by many factors. Compared with >1500 copies/mL, it was obvious that 0 copy/mL as a cut-off value might induce many false-positive errors. Our results suggested that it might be better to set the cut-off value between 1500 and 4000 copies/mL. We recommend 1500 copies/mL as the cut-off value, because the cut-off value of 4000 copies/mL would decrease the sensitivity of the analysis. However, the results still need to be further confirmed by multicenter prospective trials.
In the subgroup analysis, tumor types might affect the HR. The HR in the grade I to II/III to IV <50% group (4.30 [2.24, 8.29]) was higher than that in the I to II/III to IV >50% group (2.98 [1.43, 6.21]). Whereas in the subgroup analysis of histological type, the HR in the differentiated/undifferentiated <50% group (4.62 [3.08, 6.93]) was higher than that in the >50% group (2.81 [1.32, 5.99]). This result could be attributed to the poor outcomes of undifferentiated malignant tumor compared with differentiated tumor. These factors possibly affected the prognostic value of EBV DNA level to some extent, and further studies should be conducted to clarify the inner association.
As shown in Table 2, there was significant between-study heterogeneity in our meta-analysis. Heterogeneity was found in the overall analyses of post-DNA and OS analysis of pre-DNA. To minimize heterogeneity, we performed subgroup analysis and sensitivity analysis. In the subgroup of tumor grade, no heterogeneity was observed in both groups, suggesting that tumor grade might be the source of heterogeneity. In the cut-off value subgroup, significant heterogeneity was found when analysis was limited in 5 studies with an EBV DNA level cut-off value at 1500 copies/mL and in 4 studies with the cut-off value at >4000 copies/mL. In the histological differentiation group, the 5 studies in the >50% group showed heterogeneity. And as mentioned above, the degree of some between-study heterogeneity decreased slightly after we introduce sensitivity analysis. So, the heterogeneity in our study may be attributed to the tumor grade, the cut-off value, the histological differentiation, and the variations in study quality.
There are several limitations in our study. Firstly, this study was based on a small number of studies (23). Secondly, significant heterogeneity was observed in our study, which might come from the differences between studies, such as cut-off values, technical characteristics, histological differences, patient sources, tumor stages, and statistical analysis tools. But we addressed the issue of heterogeneity by using a random-effects model for more conservative estimates. Thirdly, we have included available data, but possibilities were that some studies with negative results were left out, thus influencing the prognostic value of EBV DNA level. Lastly, publication bias was a major concern for the results of all meta-analyses. In our meta-analysis, no publication bias was found, but it should be noted that any meta-analysis could not completely exclude biases.
In conclusion, our present results showed that EBV DNA level exhibits good accuracy as a prognostic factor of NPC. The detection of EBV DNA level at different cut-off values may be used as an effective method to guide the treatment of patients with NPC. We suggest >1500 copies/mL to be a considerable cut-off value in EBV DNA level. Clinical trials with a larger sample size may aid in defining the cut-off value and further evaluating the clinical application of EBV DNA level.
Footnotes
Abbreviations: CI = confidence interval, DFS = disease-free survival, DMFS = distant metastasis-free survival, EBV = Epstein–Barr virus, HR = hazard ratio, NOS = Newcastle–Ottawa Scale, NPC = nasopharyngeal carcinoma, OS = overall survival, PFS = progression-free survival, RFS = recurrence-free survival, RT-PCR = real-time quantitative polymerase chain reaction.
JZ, CS, YS, QL, and XM contributed equally.
The authors have no conflicts of interest to disclose.
References
- 1.Jemal A, Bray F, Center MM, et al. Global cancer statistics. CA Cancer J Clin 2011; 61:69–90. [DOI] [PubMed] [Google Scholar]
- 2.Vokes EE, Liebowitz DN, Weichselbaum RR. Nasopharyngeal carcinoma. Lancet 1997; 350:1087–1091. [DOI] [PubMed] [Google Scholar]
- 3.Nawroz H, Koch W, Anker P, et al. Microsatellite alterations in serum DNA of head and neck cancer patients. Nat Med 1996; 2:1035–1037. [DOI] [PubMed] [Google Scholar]
- 4.Chang KP, Chang YT, Wu CC, et al. Multiplexed immunobead-based profiling of cytokine markers for detection of nasopharyngeal carcinoma and prognosis of patient survival. Head Neck 2011; 33:886–897. [DOI] [PubMed] [Google Scholar]
- 5.Lin JC, Wang WY, Chen KY, et al. Quantification of plasma Epstein-Barr virus DNA in patients with advanced nasopharyngeal carcinoma. N Engl J Med 2004; 350:2461–2470. [DOI] [PubMed] [Google Scholar]
- 6.Hsu CL, Chang KP, Lin CY, et al. Plasma Epstein-Barr virus DNA concentration and clearance rate as novel prognostic factors for metastatic nasopharyngeal carcinoma. Head Neck 2012; 34:1064–1070. [DOI] [PubMed] [Google Scholar]
- 7.Wang WY, Twu CW, Chen HH, et al. Plasma EBV DNA clearance rate as a novel prognostic marker for metastatic/recurrent nasopharyngeal carcinoma. Clin Cancer Res 2010; 16:1016–1024. [DOI] [PubMed] [Google Scholar]
- 8.Tierney JF, Stewart LA, Ghersi D, et al. Practical methods for incorporating summary time-to-event data into meta-analysis. Trials 2007; 8:16. [DOI] [PMC free article] [PubMed] [Google Scholar]
- 9.Williamson PR, Smith CT, Hutton JL, et al. Aggregate data meta-analysis with time-to-event outcomes. Stat Med 2002; 21:3337–3351. [DOI] [PubMed] [Google Scholar]
- 10.Parmar MK, Torri V, Stewart L. Extracting summary statistics to perform meta-analyses of the published literature for survival endpoints. Stat Med 1998; 17:2815–2834. [DOI] [PubMed] [Google Scholar]
- 11.Stang A. Critical evaluation of the Newcastle-Ottawa scale for the assessment of the quality of nonrandomized studies in meta-analyses. Eur J Epidemiol 2010; 25:603–605. [DOI] [PubMed] [Google Scholar]
- 12.Higgins JP, Thompson SG, Deeks JJ, et al. Measuring inconsistency in meta-analyses. BMJ 2003; 327:557–560. [DOI] [PMC free article] [PubMed] [Google Scholar]
- 13.Begg CB. A comparison of methods to detect publication bias in meta-analysis by P. Macaskill, S. D. Walter and L. Irwig, Statistics in Medicine, 2001; 20:641-654. Stat Med 2002; 21:1803.[author reply 04]. [DOI] [PubMed] [Google Scholar]
- 14.Egger M, Davey Smith G, Schneider M, et al. Bias in meta-analysis detected by a simple, graphical test. BMJ 1997; 315:629–634. [DOI] [PMC free article] [PubMed] [Google Scholar]
- 15.An X, Wang FH, Ding PR, et al. Plasma Epstein-Barr virus DNA level strongly predicts survival in metastatic/recurrent nasopharyngeal carcinoma treated with palliative chemotherapy. Cancer 2011; 117:3750–3757. [DOI] [PubMed] [Google Scholar]
- 16.Chai SJ, Pua KC, Saleh A, et al. Clinical significance of plasma Epstein-Barr Virus DNA loads in a large cohort of Malaysian patients with nasopharyngeal carcinoma. J Clin Virol 2012; 55:34–39. [DOI] [PubMed] [Google Scholar]
- 17.Chan AT, Lo YM, Zee B, et al. Plasma Epstein-Barr virus DNA and residual disease after radiotherapy for undifferentiated nasopharyngeal carcinoma. J Natl Cancer Inst 2002; 94:1614–1619. [DOI] [PubMed] [Google Scholar]
- 18.Chang KP, Tsang NM, Liao CT, et al. Prognostic significance of 18F-FDG PET parameters and plasma Epstein-Barr virus DNA load in patients with nasopharyngeal carcinoma. J Nucl Med 2012; 53:21–28. [DOI] [PubMed] [Google Scholar]
- 19.Chen WH, Tang LQ, Wang FW, et al. Elevated levels of plasma D-dimer predict a worse outcome in patients with nasopharyngeal carcinoma. BMC Cancer 2014; 14:583. [DOI] [PMC free article] [PubMed] [Google Scholar]
- 20.Hou X, Zhang L, Zhao C, et al. [Prognostic impact of plasma Epstein-Barr virus DNA concentration on distant metastasis in nasopharyngeal carcinoma]. Ai Zheng 2006; 25:785–792. [PubMed] [Google Scholar]
- 21.Hou X, Zhao C, Guo Y, et al. Different clinical significance of pre- and post-treatment plasma Epstein-Barr virus DNA load in nasopharyngeal carcinoma treated with radiotherapy. Clin Oncol (R Coll Radiol) 2011; 23:128–133. [DOI] [PubMed] [Google Scholar]
- 22.Jin Y, Cai XY, Cai YC, et al. To build a prognostic score model containing indispensible tumour markers for metastatic nasopharyngeal carcinoma in an epidemic area. Eur J Cancer 2012; 48:882–888. [DOI] [PubMed] [Google Scholar]
- 23.Leung SF, Chan AT, Zee B, et al. Pretherapy quantitative measurement of circulating Epstein-Barr virus DNA is predictive of posttherapy distant failure in patients with early-stage nasopharyngeal carcinoma of undifferentiated type. Cancer 2003; 98:288–291. [DOI] [PubMed] [Google Scholar]
- 24.Leung SF, Chan KC, Ma BB, et al. Plasma Epstein-Barr viral DNA load at midpoint of radiotherapy course predicts outcome in advanced-stage nasopharyngeal carcinoma. Ann Oncol 2014; 25:1204–1208. [DOI] [PubMed] [Google Scholar]
- 25.Leung SF, Zee B, Ma BB, et al. Plasma Epstein-Barr viral deoxyribonucleic acid quantitation complements tumor-node-metastasis staging prognostication in nasopharyngeal carcinoma. J Clin Oncol 2006; 24:5414–5418. [DOI] [PubMed] [Google Scholar]
- 26.Li SW, Wang H, Xiang YQ, et al. Prospective study of prognostic value of Raf kinase inhibitory protein and pretreatment plasma Epstein-Barr virus DNA for distant metastasis in locoregionally advanced nasopharyngeal carcinoma. Head Neck 2013; 35:579–591. [DOI] [PubMed] [Google Scholar]
- 27.Lin JC, Chen KY, Wang WY, et al. Detection of Epstein-Barr virus DNA in the peripheral-blood cells of patients with nasopharyngeal carcinoma: relationship to distant metastasis and survival. J Clin Oncol 2001; 19:2607–2615. [DOI] [PubMed] [Google Scholar]
- 28.Lin JC, Wang WY, Liang WM, et al. Long-term prognostic effects of plasma epstein-barr virus DNA by minor groove binder-probe real-time quantitative PCR on nasopharyngeal carcinoma patients receiving concurrent chemoradiotherapy. Int J Radiat Oncol Biol Phys 2007; 68:1342–1348. [DOI] [PubMed] [Google Scholar]
- 29.Ma BB, Leungm SF, Hui EP, et al. Prospective validation of serum CYFRA 21-1, beta-2-microglobulin, and ferritin levels as prognostic markers in patients with nonmetastatic nasopharyngeal carcinoma undergoing radiotherapy. Cancer 2004; 101:776–781. [DOI] [PubMed] [Google Scholar]
- 30.Tang LQ, Li CF, Chen QY, et al. High-sensitivity C-reactive protein complements plasma Epstein-Barr virus deoxyribonucleic acid prognostication in nasopharyngeal carcinoma: a large-scale retrospective and prospective cohort study. Int J Radiat Oncol Biol Phys 2015; 91:325–336. [DOI] [PubMed] [Google Scholar]
- 31.Twu CW, Wang WY, Liang WM, et al. Comparison of the prognostic impact of serum anti-EBV antibody and plasma EBV DNA assays in nasopharyngeal carcinoma. Int J Radiat Oncol Biol Phys 2007; 67:130–137. [DOI] [PubMed] [Google Scholar]
- 32.Wang WY, Twu CW, Chen HH, et al. Long-term survival analysis of nasopharyngeal carcinoma by plasma Epstein-Barr virus DNA levels. Cancer 2013; 119:963–970. [DOI] [PubMed] [Google Scholar]
- 33.Wei W, Huang Z, Li S, et al. Pretreatment Epstein-Barr virus DNA load and cumulative cisplatin dose intensity affect long-term outcome of nasopharyngeal carcinoma treated with concurrent chemotherapy: experience of an institute in an endemic area. Oncol Res Treat 2014; 37:88–95. [DOI] [PubMed] [Google Scholar]
- 34.Hayes DF, Isaacs C, Stearns V. Prognostic factors in breast cancer: current and new predictors of metastasis. J Mammary Gland Biol Neoplasia 2001; 6:375–392. [DOI] [PubMed] [Google Scholar]
- 35.Kondo S, Horikawa T, Takeshita H, et al. Diagnostic value of serum EBV-DNA quantification and antibody to viral capsid antigen in nasopharyngeal carcinoma patients. Cancer Sci 2004; 95:508–513. [DOI] [PMC free article] [PubMed] [Google Scholar]
- 36.Lin JC. The Epstein-Barr virus DNA polymerase transactivates the human immunodeficiency virus type 1 5’ long terminal repeat. Biochem Biophys Res Commun 1993; 195:242–249. [DOI] [PubMed] [Google Scholar]
- 37.Lin JC. Strategies for evaluation of antiviral agents against epstein-barr virus in culture. Methods Mol Med 2000; 24:139–150. [DOI] [PubMed] [Google Scholar]
- 38.Lin JC, De BK, Mar EC. Functional characterization of partially purified Epstein-Barr virus DNA polymerase expressed in the baculovirus system. Virus Genes 1994; 8:231–241. [DOI] [PubMed] [Google Scholar]
- 39.Cosmopoulos K, Pegtel M, Hawkins J, et al. Comprehensive profiling of Epstein-Barr virus microRNAs in nasopharyngeal carcinoma. J Virol 2009; 83:2357–2367. [DOI] [PMC free article] [PubMed] [Google Scholar]


