Abstract
Dynamic light scattering (DLS) is widely used to characterize diffusive motion to obtain precise information on colloidal suspensions by calculating the autocorrelation function of the signal from a heterodyne optical system. DLS can also be used to determine the flow velocity field in systems that exhibit mass transport by incorporating the effects of the deterministic motion of scatterers on the autocorrelation function, a technique commonly known as laser Doppler flowmetry. DLS measurements can be localized with confocal and coherence gating techniques such as confocal microscopy and optical coherence tomography, thereby enabling the determination of the spatially-resolved velocity field in three dimensions. It has been thought that spatially-resolved DLS can determine the axial velocity as well as the lateral speed in a single measurement. We demonstrate, however, that gradients in the axial velocity of scatterers exert a fundamental influence on the autocorrelation function even in well-behaved, non-turbulent flow. By obtaining the explicit functional relation between axial-velocity gradients and the autocorrelation function, we show that the velocity field and its derivatives are intimately related and their contributions cannot be separated. Therefore, a single DLS measurement cannot univocally determine the velocity field. Our extended theoretical model was found to be in good agreement with experimental measurements.
I. INTRODUCTION
Dynamic light scattering (DLS) relies on the statistical fluctuations of intensity when coherent light interacts with a colloidal suspension to obtain information on the suspended particles, such as their diffusion dynamics, electrophoretic mobility and the progress of chemical reactions [1]. DLS makes use of the autocorrelation function of the signal intensity, and its theory relates the shape and time constants of this function to the parameters of interest. An important application of DLS theory is the non-contact study of mass transport in rheological systems, such as those presenting deterministic translational motion in addition to diffusion. When such mass transport is interpreted as flow and heterodyne detection is used, DLS techniques are typically described as laser Doppler flowmetry (LDF) [2]. In LDF, the Fourier conjugate of the autocorrelation function, the power spectrum of the signal, is usually the figure of interest. A different but related set of techniques make use of the speckle contrast and are sometimes included in the definition of LDF [3], but we do not consider them here as they make only indirect use of the DLS theory. There are many inceptions of LDF, some of which use the basic Doppler principle for detecting line-of-sight movement [4, 5], while some exploit the full potential of the autocorrelation analysis [2]. In any case, LDF has been broadly adopted for the study of blood flow in vascular networks in biological systems [6, 7]. In these systems, DLS measurements can be localized in three dimensions by making use of confocal microscopy, which allows the determination of high-resolution spatially-resolved blood flow speeds via confocal gating.
Another common method for localizing DLS is the recent development of DLS optical coherence tomography (DLS-OCT) [8]. In the case of OCT, coherence gating localizes the sampling volume in the axial direction, while the beam width constrains the lateral dimensions. Several applications of the DLS-OCT technique have been actively discussed recently [8–12], including a derivative technique that uses only the intensity of the OCT signal. Termed intensity-based DLS-OCT (iDLS-OCT) [13], this approach extends DLS methods to a broader range of wavelength-swept OCT systems that lack phase stability [14].
Regardless of the technique used, confocal- and coherence-gated DLS measurements have gained increased interest due to the potential for spatially-resolved measurements in colloidal science, microfluidics and biomedicine. In all applications, DLS has the potential for an accurate determination of the suspended particles’ diffusive motion as well as the deterministic motion given by the velocity field. This potential, however, cannot be fully realized until all decorrelation contributions are accounted for in the theoretical model for a given system. In this work, we focus on deterministic motion of point-like scatterers, and we show that not only the velocity field but its derivatives as well must be taken into account as sources of decorrelation. We provide a simplified expression for the calculation of the autocorrelation function in generalized optical systems and point-like particles with arbitrary velocity fields. We then use this expression to treat axial-velocity gradients inside the sampling volume and show that they have a significant effect on the decorrelation due to coherent effects. Even though there have been indications of this behavior before [2, 9], to the best of our knowledge there has been no complete description of axial-velocity gradient effects to date. We are able to obtain an explicit functional relationship between gradients of the axial velocity and the autocorrelation function: we show that all axial-velocity derivatives contribute to decorrelation through the gradient and a modified gradient operator, and that their contribution is quadratic in the time difference, the same order as the contribution from the velocity itself. For this reason, unique determination of the velocity field is not possible in a single DLS measurement. We propose strategies to overcome this problem using multiple measurements. Finally, we show a comparison between experimental data and our model for fully laminar parabolic flow that highlights that, even in well-behaved flow with no turbulence, velocity gradient contributions can be of the order of, or greater than, the translational motion contribution.
II. THEORETICAL MODEL
We will consider in this section both confocal- and coherence-gated spatially-resolved DLS. Coherence-gated techniques have either access to the complex backscattering profile of the sample in DLS-OCT or to the intensity of the backscattering in iDLS-OCT. Generally, confocal-gated techniques acquire only the intensity of the backscattering. The complex backscattering profile of the sample allows the direct calculation of the first-order autocorrelation g(1)(τ ) of the signal; when only the intensity is accessible the second-order autocorrelation of the backscattering signal g(2)(τ ) can be computed.
Assuming that the backscattering signal is a complex circular Gaussian process given by fully developed speckle, the first-order autocorrelation function is related to the second-order autocorrelation through the Siegert relation [15]
| (1) |
This allows us to derive a unique model for g(1)(τ ) which is enough to describe the behavior of complex-based DLS techniques that use g(1)(τ ) (such as coherence-gated DLS-OCT) and intensity-based techniques that use g(2)(τ ) (such as coherence-gated iDLS-OCT and confocalgated LDF). Arguably, when the resolution volume reaches a certain small size in relation to the scatterer size the Siegert relation may no longer hold as the number of scatterers in the resolution volume is not large. We will not consider this special case and instead assume hereafter that Eq. (1) holds.
Throughout this work (x̂, ŷ, ẑ) will denote the position of the resolution volume under study given by beam scanning and coherence or confocal gating, while (x, y, z) will denote the integration variables inside the resolution volume. The coordinate systems are identical.
In spatially-resolved DLS, the first-order autocorrelation function of the signal is calculated as
| (2) |
where, F represents the complex backscattering signal of the sample at depth ẑ when the interrogating beam is at lateral position (x̂, ŷ), 〈. . . 〉 represents an ensemble average and * the complex conjugate. In the case of coherence gating F is given by the Fourier transform of the OCT fringe signal [16]
| (3) |
where ξ is the photon-to-electron conversion efficiency, Sr(k) and Ss(k) the spectral power density for the reference and sample arms, respectively, R(r⃗) is the sample reflectance at position r⃗ = (x, y, z), CSFxy(x, y) the complex point spread function of the probe beam, n the refractive index of the sample, k the wave number and (xs(t), ys(t), zs(t)) the time-dependent position of the sample. We define the axial beam direction as z, and the transverse plane xy. In our case we neglect variations of the intensity of the probe beam in the axial direction, that is, the beam has a large Rayleigh range compared to the coherence gating.
Equation (3) describes the calculation of the OCT tomogram from complex fringes that have been acquired through quadrature detection or through the avoidance of depth degeneracy, either using half of the coherence range or the full range with a frequency shifter [17]. The square in the CSF term incorporates the effect of the weak confocal gating in OCT due to coupling back into a single-mode fiber [9]. We consider here a normalized spectral power density described by a Gaussian distribution centered at kc with bandwidth Δk for both arms
| (4) |
It is possible to reorganize Eq. (3) to perform first the integration on 2nk
| (5) |
where the axial complex point spread function is given by
| (6) |
where [16]. Note that we define the resolution so that wz is the e−2 half-width of the resolution voxel in the tomogram intensity, not amplitude. Equations (5) and (6) show that the amplitude of the tomogram at ẑ is generated by the coherent superposition of the signals coming from the volume in the sample centered at (x̂, ŷ, ẑ) = (x, y, z). It is important to consider that wz has been defined assuming a Gaussian spectral power density. In general this is an approximation, and during tomogram reconstruction Eq. (3) is implemented as a discrete Fourier transform using a window function to reduce side lobes. For these reasons, the experimental value of wz is expected to differ from the axial resolution of the particular light source used.
In the case of confocal gating the backscattering signal can be described by the same Eq. (5) in which the axial complex point spread function is given by
| (7) |
where w̃z is the e−2 axial radius of the confocal-defined resolution volume in the intensity signal [18]. It is clear that Eqs. (6) and (7) are functionally the same, but the origin of the axial localization is different. For this reason, we will consider the axial resolution as given by wz irrespective of the technique.
We consider the sample as composed of multiple point scatterers, so that the backscattering is given by , which simplifies Eq. (5) to
| (8) |
and therefore the first-order autocorrelation function is given by
| (9) |
Considering scatterers with diffusive and translational motion we have , and a similar expression for y and z. Assuming that the motion of the scatters is independent of their initial position, it is possible to separate Eq. (9) into diffusional and translational averages [2, 9]. The diffusional average cancels out for ν ≠ χ and its value is , where D is the diffusion coefficient and we define now [9, 13]. It is important to note here that if the scattering is produced by non-spherical particles other sources of diffusive decorrelation need to be taken into account. Some of these effects include tumbling [19] as well as deformation in non-rigid particles, such as tanktreading and swinging in red blood cells [20]. We will limit the present model to point-like particles with only translational diffusive motion.
Computing the ensemble average as the average over all possible initial positions of the scatterers, Eq. (9) can be written as
| (10) |
This form of the autocorrelation function, although functionally equivalent to that in [9], allows for easy calculation of the first-order autocorrelation function for different optical configurations and velocity fields. It is important to note that the separation of the diffusional and translational motion is an approximation that relies on the optical system having a relatively low numerical aperture [21], which may not apply for certain confocal systems. However, for regimes in which translational motion dominates, the diffusional contribution to decorrelation is small and this remains is a good approximation. Additionally, there has been a discussion about the validity of the square for the lateral CSF in Eq. (5), and whether this factor actually comes from a more rigorous approach that includes the Green’s function of the particular optical system [21], that reveals a coupling between the diffusional and translational components. In all practical cases, the optical system can be assumed to be an imaging system with a given Gaussian beam waist at the image plane, where both interpretations agree.
As indicated in [9], a change in the axial velocity across the resolution volume gate will induce an additional decorrelation. This effect comes from the fact that the Doppler term ei2nkcvz will be different among the scatterers; when added coherently, these terms produce amplitude modulations that ultimately contribute to a stronger decorrelation. This important effect has only been explored numerically, and its functional relationship is currently unknown to the best of our knowledge.
We now proceed to use Eq. (10) to obtain this functional relationship. We define the velocity field inside each resolution volume as
| (11) |
where vzz characterizes the axial velocity change per axial resolution. We limit ourselves here to only a first-order gradient contribution for several reasons. First, as we will see later, the first-order contributions are on the order of, or greater than contributions from the zeroth-order vz0 term alone. Second, in laminar parabolic flow profiles the contribution from second-order gradients occur at the center of the profile, where the zeroth-order contribution is maximum. On the other hand, the maximum first-order contribution happens at the edges of the profile, where the zeroth-order contributions are minimal. This has an important effect when trying to assess the Brownian motion contribution in a parabolic profile. Third, the second-order contribution of a parabolic profile becomes important only when the size of the flow channel approaches the resolution volume of the system. Although this is an important case when measuring blood flow in capillaries, we consider it out of the scope of this work. Finally, higher-order contributions are expected to contribute in turbulent flow. However, the time scale of the turbulence also plays a role because a changing flow pattern during the DLS measurement will have significant and a qualitatively different effect on the autocorrelation function.
Because the role of (x̂, ŷ, ẑ) is to define the lateral and axial position of the sample being analyzed, we will drop this dependence as the autocorrelation function will in general be calculated independently for any given sample location. We will also consider only normalized autocorrelation functions, therefore dropping the ξ2 term and using normalized CSFs in all dimensions. Now the integration in Eq. (10) can be separated as
| (12) |
where we define the autocorrelation contributions as , and each velocity contribution gl as the integral along coordinate l. In the transverse directions we have
| (13) |
where we used a normalized . We apply an analogous equation for gy. For the axial direction we have
| (14) |
where we have defined gz1(τ) = 1+vzz/wzτ and . Note that these two quantities are unity-valued in absence of gradients. The Gaussian integral above can be readily solved yielding
| (15) |
It is clear that the gradient has a profound effect on the expression for the autocorrelation function. In particular, there is a new quadratic phase term, the quadratic velocity term is modified nonlinearly and there is a new, stand-alone term that depends exclusively on the gradient. Equation (15), although exact, does not reflect clearly the magnitude of the gradient effects on the autocorrelation. For this reason we now perform some approximations. We define the transit time through the resolution volume in the axial direction as τ̄ = wz/vz0, which represents the time scale of the decorrelation in the absence of gradients. Based on this, we define the differential transit time due to the gradient as τ1 = wz/vzz. We take this quantity as defining the time scale of the gradient effects, and create first-order approximations to all functions involving gz1 and gz2 as a first-order polynomial that passes through their values at τ0 = 0 and τ1. Additionally, we approximate the radical in gz as a first-order exponential to obtain an all-exponential expression
| (16) |
Substituting these approximations into Eq. (15) yields
| (17) |
As τ grows, the negative exponentials have values progressively closer to zero, so that when the third or higher orders dominate, the autocorrelation value is already virtually zero. At this point, it is clear that the contribution from these higher orders is negligible. For this reason, keeping all leading orders up to second order is an excellent approximation. Additionally, in most practical cases the first exponential term is significantly smaller than the other gradient terms, justifying only a first-order expansion for it. With these considerations we have
| (18) |
It is interesting to note the new phase factor in Eq. (18) in addition to the Doppler term exp [−i2nkcvz0τ ]. The Doppler term can be viewed as being proportional to the fraction of the wavelength that the scatterers move per unit time nkcvz0 = 2πvz0/λn. The new quadratic term can be viewed as the product two factors (nkcvz0)(vzz/wz), the first being equal to the Doppler term and the second proportional to the differential fraction of the axial resolution that the scatterers move per unit time in response to the gradient. Because of its differential nature, and its relation to the axial resolution instead of the wavelength, this phase term is expected to be significantly smaller than the leading Doppler term except for very larg τ.
A discussion on the values of wx and wy is in order. Prior work [22], numerical results [21, 23], recent experiments [11], and our own numerical integration of Eq. (12), indicate that Eq. (13) holds regardless of the position of the sample with respect to the beam waist wx. Moving away from the beam waist position not only increases the beam size, but also introduces a quadratic phase to the wavefront, and these two factors seem to interact to cancel each other. To further clarify this idea, consider the speckle signal produced by a scattering sample moving rigidly at a constant speed while being illuminated by the beam of any of the optical systems used for spatially-resolved DLS. The constant-speed motion is equivalent to scanning the sample, and the time coordinate is mapped linearly to the position coordinate: the intensity of the speckle signal is equivalent to a one-dimensional image of the sample reproduced by a coherent imaging optical system with the same numerical aperture of the spatially-resolved DLS optical system. It is well known that in coherent optical systems, the speckle size is given by the diffraction-limited spot size independently of any optical aberrations [24]. For this reason we can extend the results of [11, 21–23] and conclude that wx and wy correspond to the diffraction-limited beam waist regardless of the optical aberrations of the system, including but not limited to defocus.
As explained in Eq. (11), axial velocity gradients are an additional source of decorrelation because the different Doppler signals create amplitude modulations. It is natural to assume that this effect is not limited to axial gradients of the axial velocity, but should also arise from lateral gradients of the axial velocity. Therefore, we now introduce the lateral derivatives of the axial velocity defining the velocity field as
| (19) |
Here we introduce new beam sizes ŵx, ŵy and axial resolution ŵz. In the discussion above, the insensitivity to optical aberrations came from the parallel between a rigid displacement of the sample (and thus the absence of gradients) and the properties of coherent optical systems. When gradients are present the equivalence with a rigid displacement of the sample no longer holds, and in this case optical aberrations will effectively expand the scatterers that contribute dissimilar Doppler signals. The wavefront phase cannot in general counteract the effect of arbitrary gradients, and therefore aberrations are expected to reinforce the decorrelation effect of gradients. Because it is difficult to predict the interplay between gradients, beam size and wavefront phase, we consider ŵx and ŵy as effective beam sizes for decorrelation purposes, which may not match exactly the experimental size of the beam measured with, say, a beam profiler. For the axial dimension in coherence-grated DLS we can draw a parallel between optical aberrations and dispersion mismatch: while optical aberrations are caused by an inhomogeneous phase at the Fourier plane, axial aberrations are caused by an inhomogeneous phase in the spectral domain caused by dispersion mismatch. Dispersion compensation is done routinely in post processing in OCT [25], which should minimize axial aberrations. However other effects, such as polarization-mode dispersion, affect the actual axial resolution in fiber-based systems. For confocal DLS, optical aberrations affect the optical sectioning and degrade the axial resolution. For these reasons we consider an effective axial resolution ŵz for the axial gradient contribution.
Using Eq. (19) it is possible to carry out the integrals, which are no longer separable. Surprisingly the time scales of the effects of the lateral gradients are governed by τx1 = wz/vzx and τy1 = wz/vzy. With the same approximation approach used to reach to Eq. (18) we obtain
| (20) |
where ∇⃗ is the gradient operator, and are factors that arise during the approximation, and we have defined the mean voxel velocity and the magnitude of a modified gradient operator as
| (21) |
Gradient effects in intensity-based DLS are obtained by using Eqs. (1) and (20)
| (22) |
Although we keep all the first-order decreasing exponential terms for completeness, we note that these factors for the transverse coordinates are roughly 36 times smaller than the axial factor. For typical experimental parameters, the axial component itself is close to one order of magnitude smaller than the diffusion term. In the presence of a non-zero mean voxel velocity these terms are negligible, and only quadratic terms in τ contribute to the decorrelation. In general, the most important feature of Eqs. (20) and (22) is that the velocity gradient contribution to decorrelation and the velocity contribution to decorrelation have the same quadratic dependence on τ, and therefore cannot be decoupled in a single DLS measurement.
Another important feature of Eqs. (20) and (22) is that the quadratic gradient terms depend on both the velocity field derivatives and on the size of the resolution volume. This is because, when assuming a linear gradient, the velocity difference between the fastest and the slowest scatterers inside the resolution volume is the dominant metric for the additional decorrelation contribution. The dependence on the resolution volume is inversely proportional to the dependence of the mean voxel velocity term, and therefore taking DLS measurements with different optical resolutions will decouple the contributions. Other options to decouple the contributions are possible, such as multiple measurements while introducing a bias in the velocity [10]. In this case, the velocity contribution will change with the bias, while the gradient contribution will remain the same.
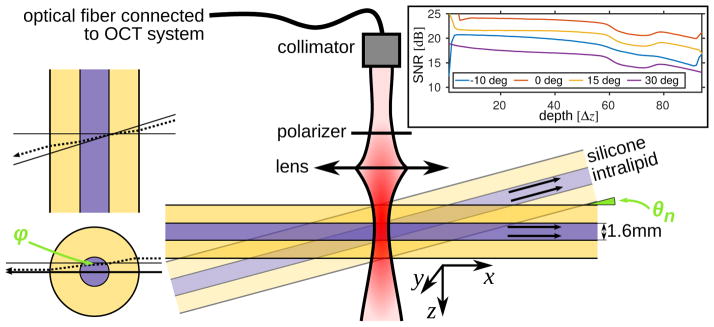
It is important to note that these spatially-resolved DLS techniques are not limited to measurements of fully laminar flow. In presence of turbulence, however, it is necessary that the turbulence time scale be larger than the DLS measurement time in order to accurately determine the dynamics of each voxel. As validation is more readily done under laminar conditions, it is helpful to analyze the influence of the gradients in a fully laminar parabolic flow profile. In the experimental section we use the set-up shown in Fig. 1, where we indicate that the nominal rotation angle θn is given by the rotation of the tube, but the actual rotation angle θ takes into account possible experimental errors. The nominal value of the incident angle ϕ was zero. The velocity field is given by the rotation of a simple parabolic profile by an angle θ
Figure 1.
Geometry of the experimental set-up, with fully developed parabolic flow of an intralipid solution inside silicone tubing. (Inset) the estimated signal-to-noise ratio of the tomograms for each θn angle.
| (23) |
with the condition ŷ2 + (x̂ sin θ + ẑ cos θ)2 ≤ R2, where Q is the flow rate, A the area of the tube, R the radius of the tube and êj the unitary vector along the j axis. Considering a measurement at x̂ = 0, the derivatives of the axial velocity are
| (24) |
where it should be noted that the maximum speed is vmax = 2Q/A. From this it is possible to calculate the quadratic gradient contribution to decorrelation as
| (25) |
It is easy to separate the axial and lateral gradient contributions in Eq. (25). Ignoring the ŷ dependence, Eq. (25) implies that, for a given x̂, the axial gradient contribution increases faster than the lateral gradient and is the dominant term at small angles, reaching a maximum at 35.3 deg before decreasing. Both contributions are equal at 45 deg when ŵz = ŵx; the lateral gradient reaches a maximum at 54.7 deg and dominates until 90 deg. Contributions from the lateral gradient in ŷ increase monotonically with angle and are independent of ẑ. Finally, the flow velocity contribution to decorrelation is
| (26) |
In the following sections we will explain the experimental approach and compare the results with those predicted by our model, Eqs. (20)–(26).
III. MATERIALS AND METHODS
We used an OCT system to perform spatially-resolved DLS measurements. The OCT system has a wavelength-swept laser with a 105 nm, unidirectional sweep centered at 1300 nm and a repetition rate of 54 kHz (Δt = 0.0185 ms). Signals were digitized at 85 MS/s with 1568 samples per sweep. The system utilized an acousto-optic frequency shifter to remove depth degeneracy [17] and with a polarization-diverse receiver to avoid polarization fading [26]. Because the first-order autocorrelation function requires the complex tomogram, the polarization channel with the largest signal was chosen for data analysis.
M-mode (time series with no spatial scanning) measurements were performed by imaging a 1.6 mm inner-diameter silicone tube containing a flowing 0.3% intralipid solution in water. The refractive index of the solution was determined by the ratio of optical path lengths of the empty and filled tube, resulting in n = 1.34 and thus a pixel size of 4.4 μm. Closed-loop flow was provided by a peristaltic pump. After the pump, a pulse dampener transformed its pulsatile action into steady, laminar flow in the area of interest in the flow circuit. The tube was mounted on a rotation stage to allow for a change of the angle θn, thus changing the ratio between axial and lateral flow components (Fig.1). The collimated beam had an approximate diameter of 1.5 mm, the focusing lens had 30 mm focal length, yielding a beam waist size at the focal plane of ~ 33 μm before accounting for the effect of the silicone tube geometry. It is expected that the tube will introduce significant aberrations in both lateral dimensions, as well as reduce wy due to the cylindrical lens effect of the interfaces. Because we do not consider flow in y we are insensitive to the values of ŵy and wy. Due to the system phase instabilities, the phase of the OCT signal was corrected by using each reflection at the two liquid-tube interfaces as fixed phase references. The phase compensation was carried out as explained in [13]. We placed a polarizer in the incident beam path before the tube because the silicone seemed to exhibit birefringence: rotation of the polarizer while acquiring data produced the alternation of two images of the tube, with a depth offset of the order of a few pixels and different maximum intensities. We fixed the polarizer at the angle in which the stronger of the two images had the maximum signal.
The discrete autocorrelation was calculated at pixel depth k as
| (27) |
where * denotes complex conjugate and 〈· · · 〉 denotes average. The second fraction compensates for the reduction in number of samples for increasing l, which is the time difference in units of Δt. The correlation window had N = 256 samples in the time dimension. After calculating we performed averaging over 4 pixels (px) in depth, which defined the sampling in depth to be Δz = 17.8 μm. The averaging was performed independently for the amplitude and the unwrapped phase. We therefore obtained a total of 256 autocorrelation functions in depth every 4.736 ms, for a total measurement time of 757.76 ms. To account for the main effect of noise [13], we removed the data point for τ = 0 and renormalized the resulting function to make .
Measurements were performed at flow rates ranging from 10 mL/min to 30 mL/min every 5 mL/min for each angle. The nominal values for the angles were θn = [−10, 0, 15, 30] deg, although the exact actual value is expected to be different to due to experimental uncertainties given by mechanical errors. Although the incident angle ϕ was nominally zero, we could not guarantee this value to high certainty due to experimental constraints. A value different from zero implies contribution from the y lateral gradient which we are not taking into account. Equation (20) shows that the phase of g(1) evolves as
| (28) |
where the discussion after Eq. (18) on the contribution from each term applies now to all derivatives. Because in our regime the quadratic term is negligible, the Doppler term can be used to determine [Eq. (23)] vz0(x, y, z) = −|v⃗(x, y, z)| sin θ, and therefore the true incident angle θ.
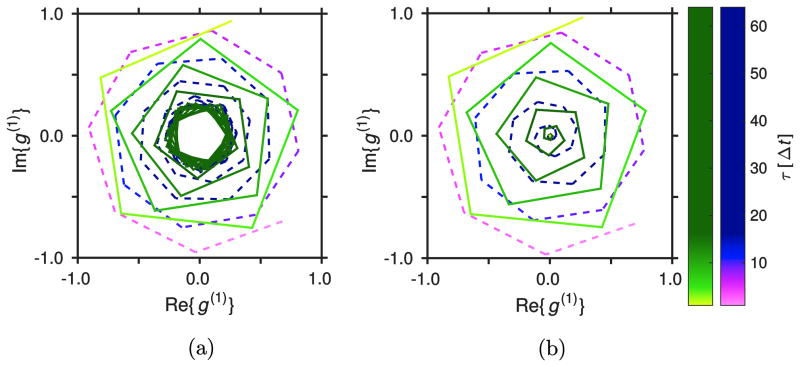
Upon calculation of g(1), we discovered that the phase compensation step had the effect of artificially increasing the decorrelation of the signal for long τ, because we forced a phase correlation even in the absence of amplitude correlations. Figure 2 (left) shows two typical examples, one with positive θ and another one with negative θ. It is clear that the autocorrelation function decays up to a given level and then stabilizes while the Doppler term continues to evolve in time. This is in contradiction to the findings reported in [8], where static scatterers produced an offset in the autocorrelation function for large τ with no further evolution of the Doppler term. In Ref. [8] a spectral domain OCT system was used, which is inherently phase stable. For this reason, we performed an additional normalization to the autocorrelation, by detecting the offset for large τ and subtracting it. The result from this normalization is shown in Fig. 2 (right). Although this normalization worked very well for most datapoints, we found that for diffusion-dominated decorrelation the offset was not well defined. For this reason we expect our measure of the diffusive constant to be not completely accurate. This is not a concern because of the regime of interest in this work. After normalization, the 160 autocorrelation functions for each depth were averaged in order to make a comparison with the model.
Figure 2.
(Color online) Left: Experimental g(1)(τ) for θn = −10 deg and 5 mL/min (green, solid); and θn = 15 deg and 5 mL/min (violet-blue, dashed). Right: The same autocorrelation functions after normalization. Note the non-linear color mapping to ease visualization of the beginning of each curve.
IV. EXPERIMENTAL RESULTS
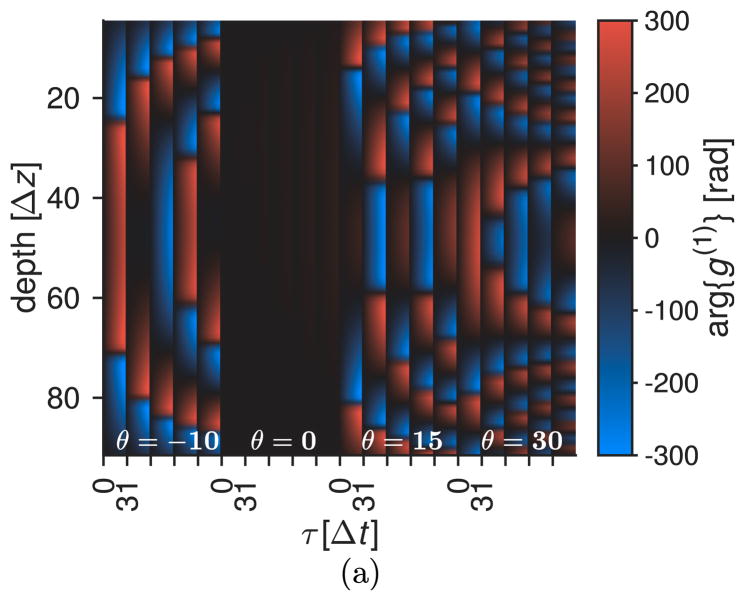
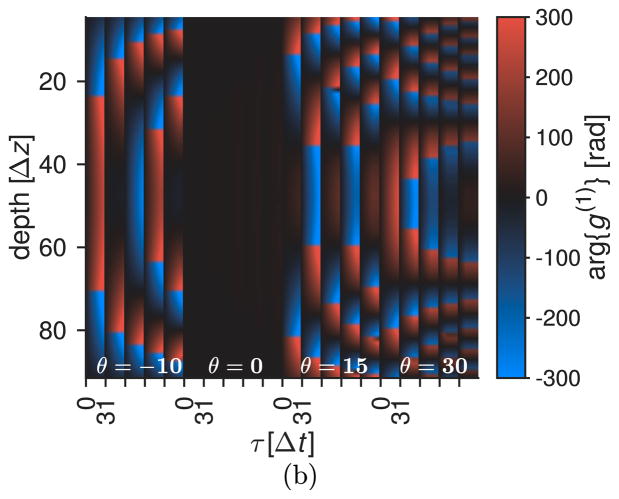
We performed the experiments explained in Sec. 3. As explained above, the actual values of the angles θn were determined from the Doppler signal alone, and were found to be θ = [−8.4, 0.1, 13.2, 30.4] deg. Figure 3 shows the experimental (left) and model (right) unwrapped phase of g(1) for all flow rates at all θ angles. Phase unwrapping consisted of one-dimensional unwrapping in time, no unwrapping in depth was performed. The excellent agreement is clear, indicating that the Doppler term given by the angle θ, which dominates the phase of g(1), has been correctly determined. The smooth phase jumps in the experimental data are due to the depth averaging of the correlation window, which does not exist in the model-generated data.
Figure 3.
(Color online) (left) Unwrapped phase of the experimental g(1)(τ ) for nominal angles θn = [−10, 0, 15, 30] deg and [10, 15, 20, 25, 30] mL/min. (right) unwrapped phase of g(1)(τ) used to determine the actual experimental angles θ = [−8.4, 0.1, 13.2, 30.4] deg. Only the first 32 values of τ are shown for each flow rate.
Before assessing the gradient effects we needed to determine kD, wx, ŵx, wz and ŵz. We used a dataset with no flow to determine the diffusion constant, kD = 0.73 ms−1. According to the Stokes-Einstein equation this corresponds to scatterers with a diameter of ~ 50 nm, around half the mean diameter of particles in 10% intralipid solution [27]. As mentioned above, the normalization is expected to impact our accuracy of the diffusion term and in our regime of interest translational motion dominates the decorrelation. Next, we determined the diffraction-limited lateral resolution experimentally making use of the dataset at normal incidence: we found the best value for wx that matched the data, which was found to be wx = 34.7 μm [see Fig. 4 (left)]. In a similar way the value for wz was determined from the data at the center of the tube including all angles now. Because gradient effects at the center of the tube are negligible, we used the accepted expression for g(1) in DLS-OCT [8]. The determined value was wz = 5.3 μm [see Fig. 4 (right)]. Surprisingly the value for wz estimated from the spectral bandwidth of the light source was 7.5 μm. It is not clear why the effective experimental value is smaller than this estimation. Given that there haven’t been other experimental validations of the decorrelation contribution of the axial flow for large θ angles, it is possible that this contribution is underestimated. The value for the actual axial resolution ŵz was determined from the width of the peak of a specular reflection and found to be ŵz = 8.3 μm. The effective lateral beam size ŵx was calculated using a generalized paraxial approximation of Gaussian optics using ray tracing. As expected, its value depended strongly on θ and weakly on the particular position inside the tube. We averaged its value for depth positions ẑ = 0–0.4 mm and ẑ = 1.2–1.6mm in order to use a single value for each angle, obtaining ŵx = [34, 34, 36, 68] μm.
Figure 4.
(Color online) (left) Scatter plot of versus for all flow rates at normal incidence used to determine wx. (right) Scatter plot of versus for the gradient-free region at all angles and flow rates used to determine wz.
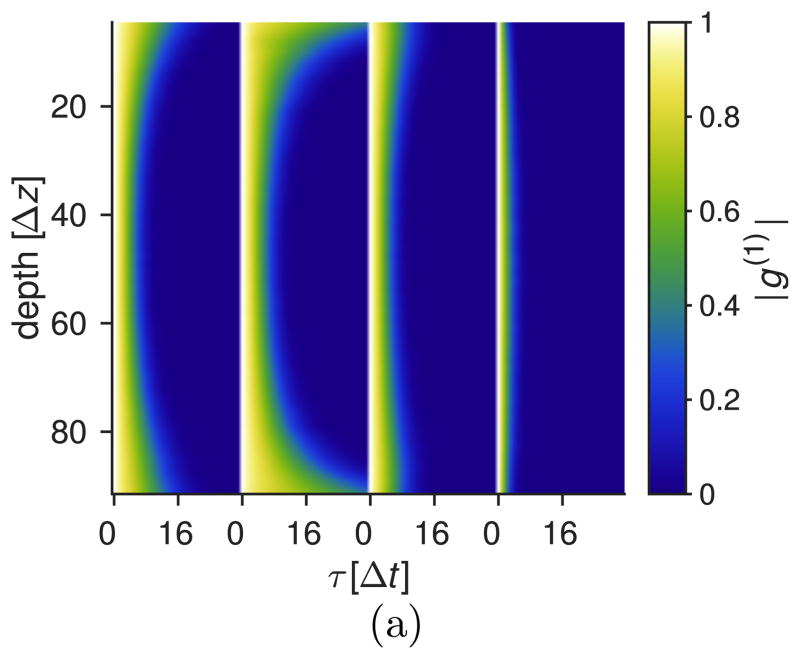
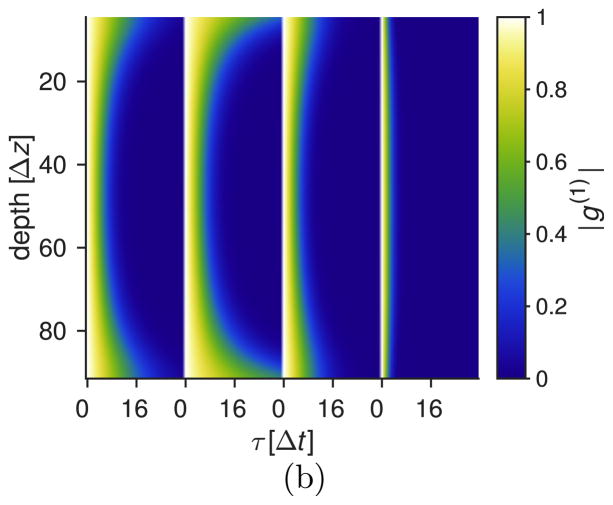
With these parameter values, we calculated the first-order autocorrelation function using Eq. (20) to include all gradient effects. Figure 5 shows the experimental (left) and model (right) amplitude of g(1) for the 15 mL/min flow rate at all θ angles. Due to the generally fast decay, we have limited the plotted region to τ < 16Δt. The excellent agreement is clear. It is interesting to note how the slow decay near the interfaces at small angles is replaced by a strong decay at large angles, which gives an indication of the importance of the gradient effects there.
Figure 5.
(Color online) (left) Absolute value of the experimental g(1)(τ) for nominal angles θn = [−10, 0, 15, 35] deg and 15 mL/min. (right) Absolute value of g(1)(τ ) according to our model that includes gradient effects.
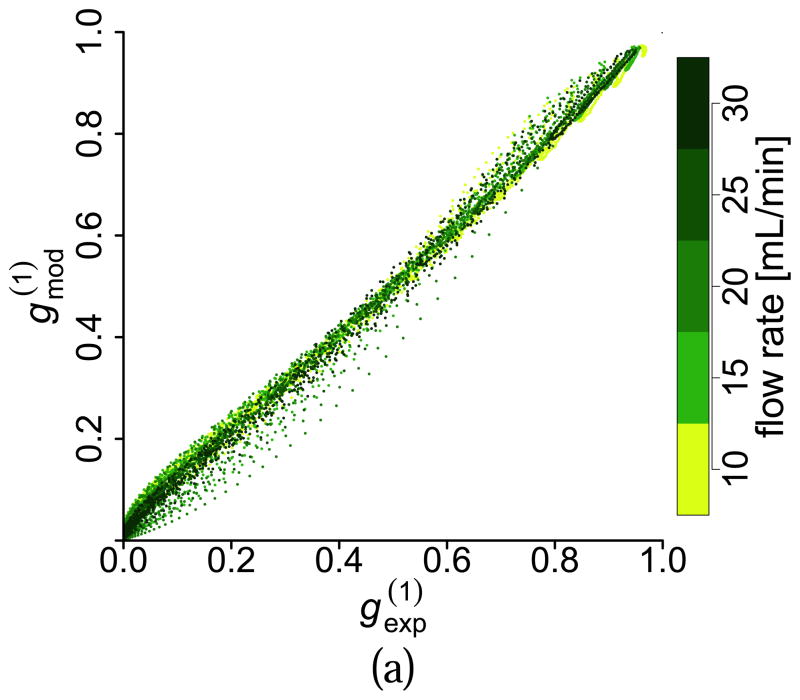
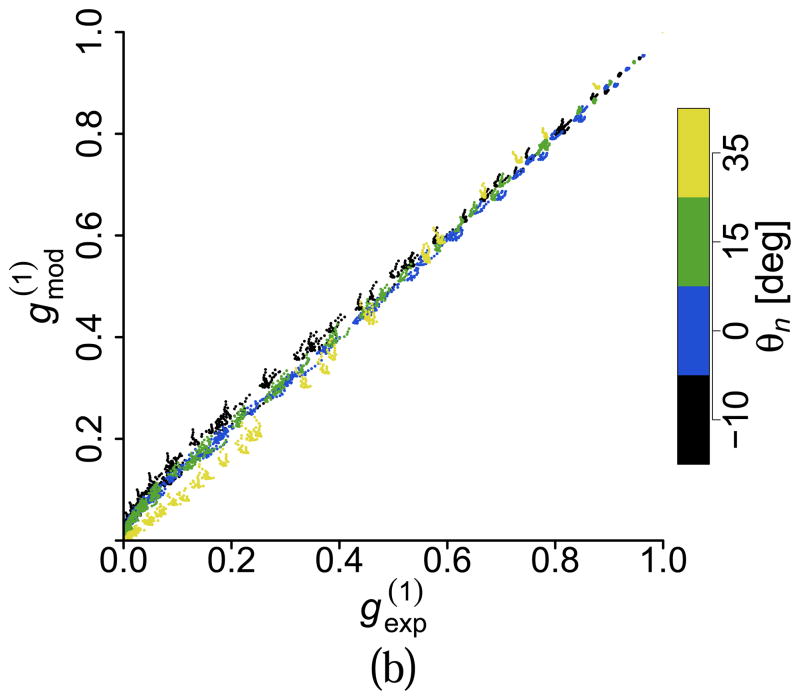
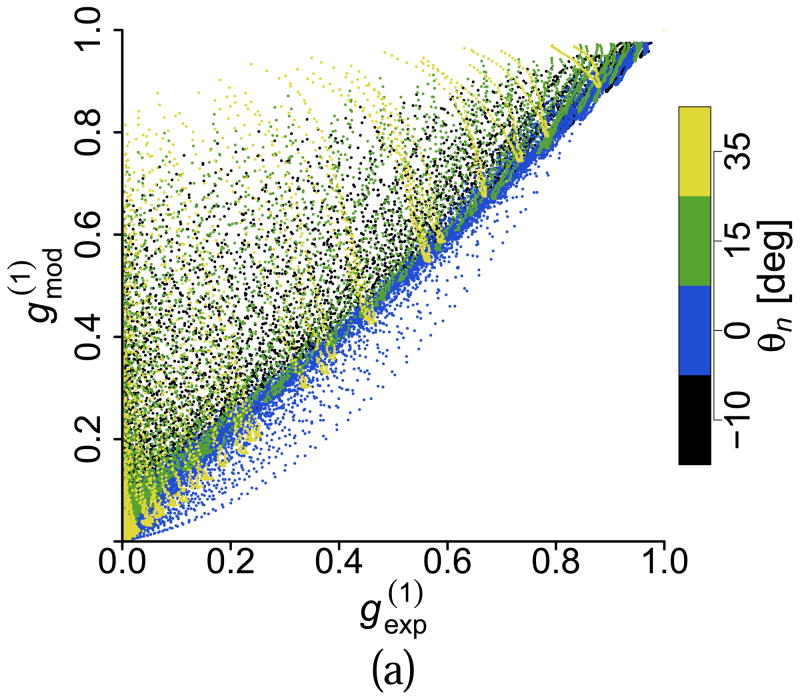
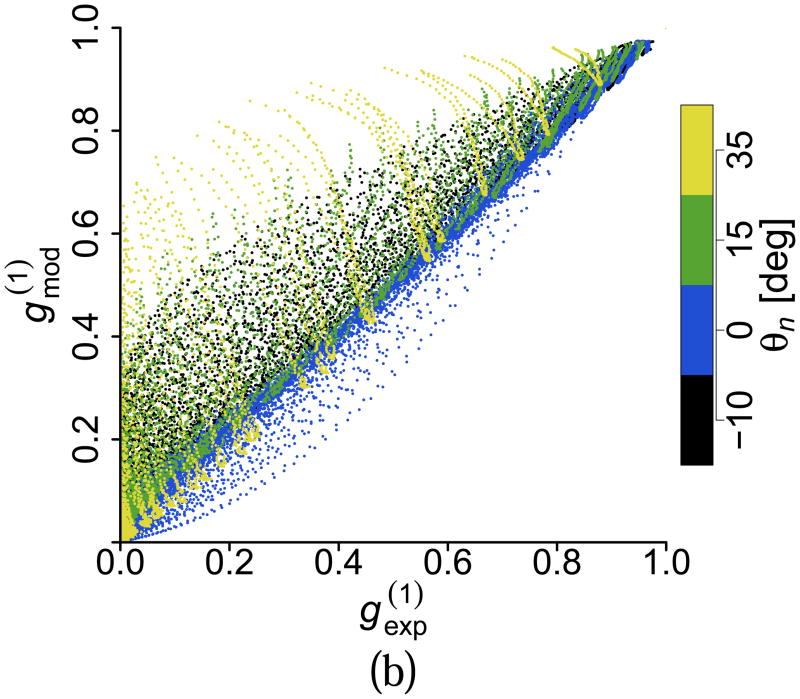
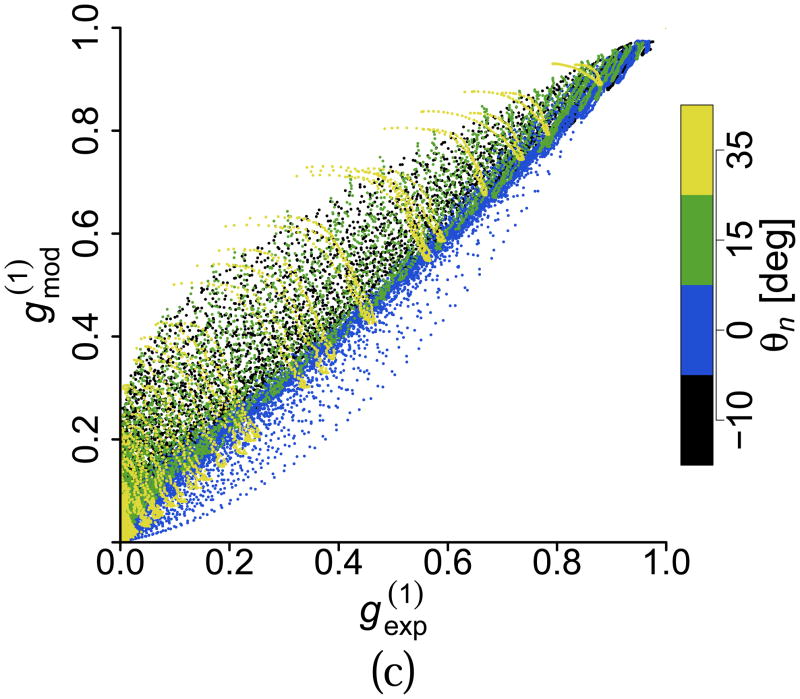
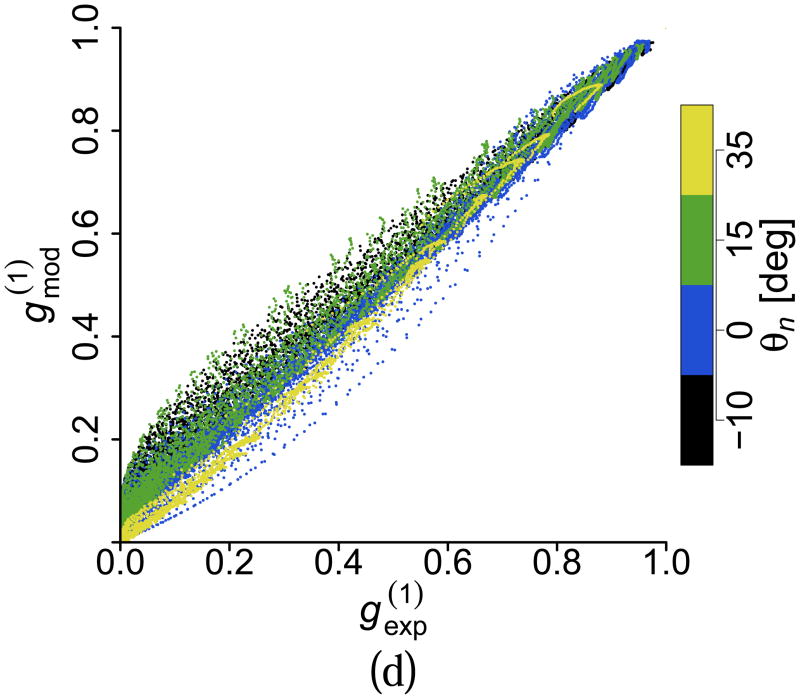
To have a better appreciation of the gradient effects and their relative importance, we show in Fig. 6 a series of scatter plots comparing the value of the amplitude of the experimental and the model-generated g(1) for all flow rates, all θn angles and all values of τ. Even though we omitted data points with an amplitude smaller than 10−3, each scatter plot contains approximately 30,000 data points. Figure 6 (top-left) shows this comparison when the model does not include any gradient effects. The disagreement is clear, as the scatter plot shows many data points with values of g(1) predicted by the model higher than the experimental value. Figure 6 (top-right) shows the case of adding only the contribution of the axial gradient of the axial velocity. There is a significant improvement; however, disagreement for many data points still remain. This case corresponds to the best model published known to the authors [9]. Figure 6 (bottom-left) shows the effect of adding both the axial and lateral gradient effects to the model, Eq. (20), but without considering optical and axial aberrations (ŵx = wx and ŵz = wz). The improvement is clear, although significant differences remain for large angles. Figure 6 (bottom-right) includes the effects of optical aberrations, which extend the agreement between model and experimental data to the majority of the data points.
Figure 6.
(Color online) Scatter plots of versus with (top-left) no gradient effects, (top-right) only axial gradient contribution, (bottom-left) lateral and axial gradient contributions, (bottom-right) lateral and axial gradient contributions considering optical aberrations according to our model.
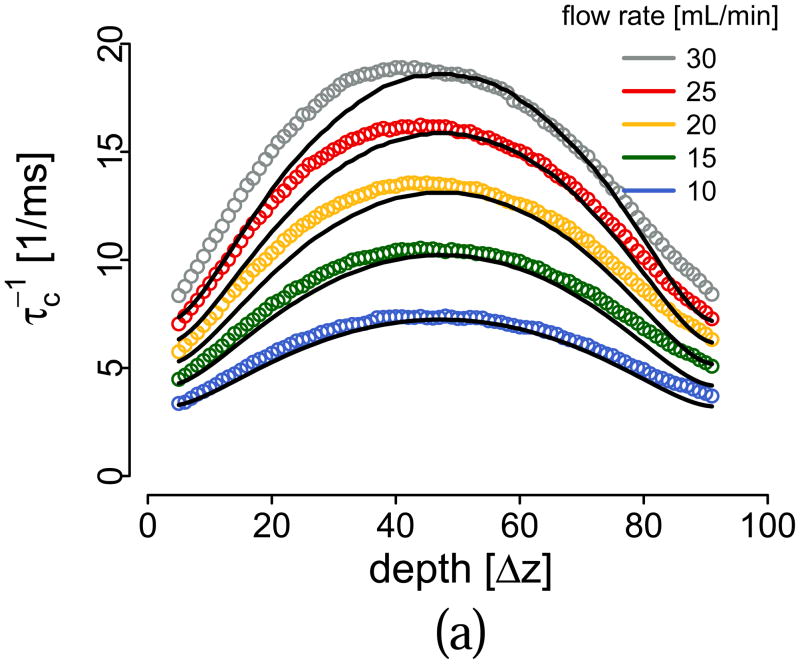
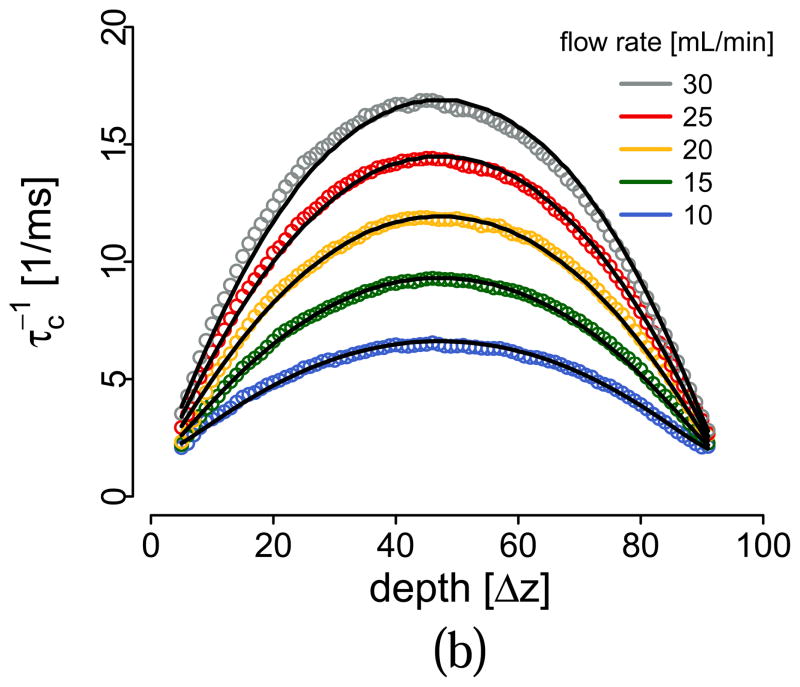
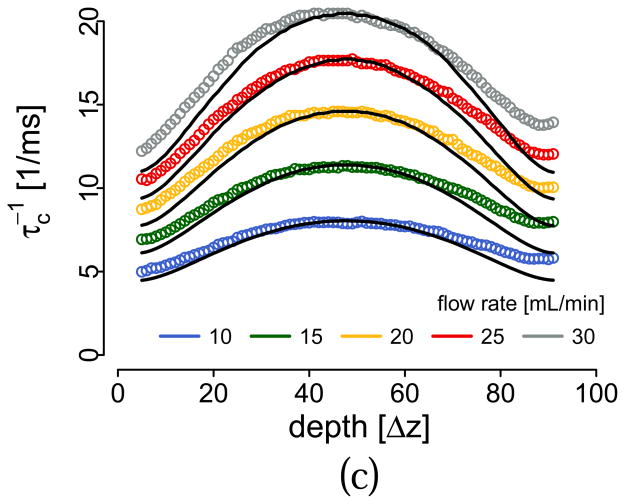
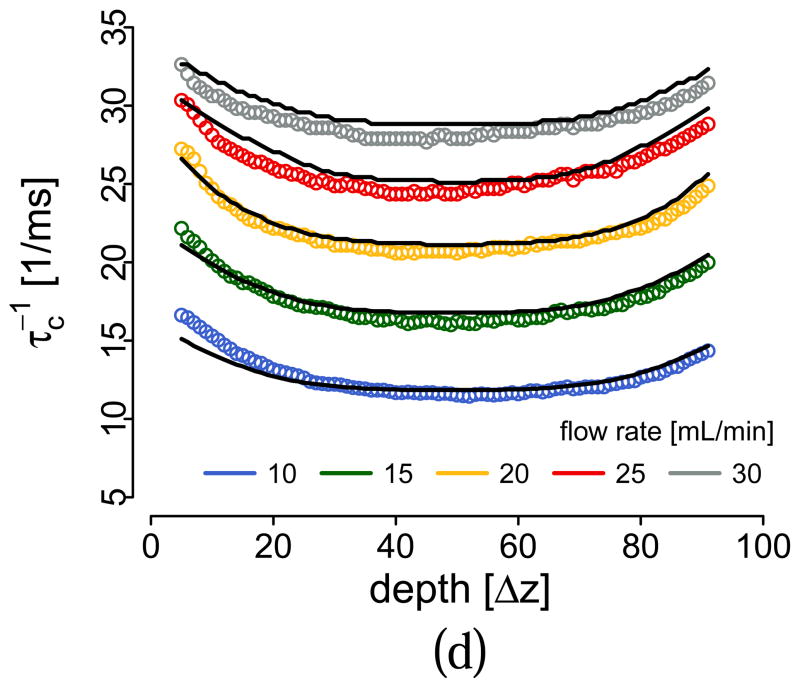
In some approaches to DLS, a decorrelation time is defined as the time difference τc when the amplitude of the autocorrelation function |g(1)| or |g(2)| crosses a given threshold gc [13, 28]. The reason for this is that absent any gradients, if wx = wz the inverse of τc is directly proportional to the flow speed ; however this simple relation that ignores gradients has been central to many works on speckle decorrelation published to date [13, 28–31]. We calculated τc and compared the experimental and model decorrelation times for all angles and flow rates using our model, shown in Fig. 7, obtaining a good match between the two at all depths and angles. Very importantly, the decorrelation time at the liquid-tube interface does not approach zero, except for θ= 0. Ignoring gradient effects implies that all decorrelation profiles should be identical in shape to the one for θ= 0: it is obvious that flow quantification using is not possible without considering gradient effects. There are some differences between our model and experiment, especially at greater depths and large angles. Noise is expected to affect the decorrelation time as the signal decreases [13] and Fresnel losses will make this effect impact larger angles more than smaller angles. The inset in Fig. 1 shows the signal as a function of depth for all angles, which reinforces this hypothesis. Multiple scattering could also be contributing to the faster decorrelation at large depths. A model that includes these effects could be made, in a similar way to the noise contribution developed in [13], however we consider this outside of the scope of this work.
Figure 7.
(Color online) Inverse g(1) decorrelation time for angles -10 deg (top left), 0 deg (top right), 15 deg (bottom left), 35 deg (bottom right) for experimental data (circles) and our model (lines) that includes gradient effects.
In a previous work, a change in the proportionality factor k between decorrelation time and flow speed as a function of depth was found [13]. As we have discussed above, there cannot be a dependence of k on the position with respect to the beam waist. The experiments in [13] where carried out with a θ= 7.5 deg, which implies the existence of lateral and axial gradients of the axial velocity. The origin of this disagreement is now clear: the change in the proportionality factors comes from the gradient effects discussed in the present work. Another important observation is that related techniques that make indirect use of the DLS theory [3], where the decrease in contrast in speckle as a function of integration time is used to determine flow speed, could also be affected by the additional unknowns given by the velocity field derivatives. In this case, the definition for the decrease in contrast should include the quadratic terms from the velocity field derivatives and a given contrast level will correspond to a given total contribution of speed and axial gradients. Similarly, when assessing Brownian motion under flow it is critical to have perfectly perpendicular flow, otherwise gradient contributions to decorrelation will affect and even mask the Brownian motion contribution. Finally, it is also interesting to see that, in all the literature on spatially-resolved DLS measurements, large θ angles are generally not present in the experimental validation. Apart from the obvious experimental difficulties in realizing non-turbulent flow with large θ, this omission suggests a long-standing problem in DLS that has not been fully addressed until now.
V. CONCLUSIONS
We have modified the DLS theory, assuming meaningful and realistic measurement conditions, to obtain a simple expression to calculate the first-order autocorrelation function for arbitrary velocity fields and arbitrary optical configurations of the measurement apparatus. This framework can be readily applied to spatially-resolved DLS measurements using confocal microscopy and optical coherence tomography. Making use of this simplified expression, we introduced gradients in the axial velocity field and we have arrived to an explicit relationship between these and the autocorrelation function. This relation demonstrates that all the derivatives of the axial speed have a large effect on the autocorrelation function and that they cannot be ignored when using DLS to determine a velocity field. Additionally, the quadratic nature of both the gradient and the velocity contributions make them non-separable: it is not possible to accurately measure the velocity of particles from a single DLS measurement when velocity gradients are present. It is possible to devise repeated measurements to decouple the contributions, like those with different optical resolutions or introducing a scanning bias. To confirm our findings, we have performed experiments and we have shown that our theoretical model describes the behavior of the autocorrelation functions accurately.
Acknowledgments
Research in this publication was supported in part by the National Institute of Biomedical Imaging and Bioengineering of the National Institutes of Health, award P41 EB015903, and by Terumo Corporation.
Contributor Information
Néstor Uribe-Patarroyo, Wellman Center for Photomedicine, Harvard Medical School and Massachusetts General Hospital, 40 Blossom Street, Boston, Massachusetts 02114, USA.
Brett E. Bouma, Wellman Center for Photomedicine, Harvard Medical School and Massachusetts General Hospital, 40 Blossom Street, Boston, Massachusetts 02114, USA and Harvard-MIT Program in Health Sciences and Technology, Cambridge, Massachusetts 02139, USA
References
- 1.Berne BJ, Pecora R. Dynamic Light Scattering: With Applications to Chemistry, Biology, and Physics. Courier Dover Publications; 2000. [Google Scholar]
- 2.Edwards RV, Angus JC, French MJ, Dunning JWD., Jr Journal of Applied Physics. 1971;42:837. [Google Scholar]
- 3.Duncan DD, Kirkpatrick SJ. J Opt Soc Am A. 2008;25:2088. doi: 10.1364/josaa.25.002088. [DOI] [PMC free article] [PubMed] [Google Scholar]
- 4.Riva CE. Int Ophthalmol. 2001;23:183. doi: 10.1023/a:1014433913240. [DOI] [PubMed] [Google Scholar]
- 5.Feke GT. Bull Soc Belge Ophtalmol. 2006:171. [PubMed] [Google Scholar]
- 6.Michelson G, Welzenbach J, Pal I, Harazny J. Int Ophthalmol. 2001;23:327. doi: 10.1023/a:1014402730503. [DOI] [PubMed] [Google Scholar]
- 7.Jonescu-Cuypers CP, Harris A, Wilson R, Kagemann L, Mavroudis LV, Topouzis F, Coleman AL. Br J Ophthalmol. 2004;88:1266. doi: 10.1136/bjo.2003.039099. [DOI] [PMC free article] [PubMed] [Google Scholar]
- 8.Lee J, Wu W, Jiang JY, Zhu B, Boas DA. Opt Express. 2012;20:22262. doi: 10.1364/OE.20.022262. [DOI] [PMC free article] [PubMed] [Google Scholar]
- 9.Weiss N, van Leeuwen TG, Kalkman J. Phys Rev E. 2013;88:042312. doi: 10.1103/PhysRevE.88.042312. [DOI] [PubMed] [Google Scholar]
- 10.Huang BK, Choma MA. Opt Lett. 2014;39:521. doi: 10.1364/OL.39.000521. [DOI] [PMC free article] [PubMed] [Google Scholar]
- 11.Weiss N, van Leeuwen TG, Kalkman J. Optics Express. 2015;23:3448. doi: 10.1364/OE.23.003448. [DOI] [PubMed] [Google Scholar]
- 12.Joo C, de Boer JF. Appl Opt. 2013;52:7618. doi: 10.1364/AO.52.007618. [DOI] [PubMed] [Google Scholar]
- 13.Uribe-Patarroyo N, Villiger M, Bouma BE. Opt Express. 2014;22:24411. doi: 10.1364/OE.22.024411. [DOI] [PMC free article] [PubMed] [Google Scholar]
- 14.Vakoc B, Yun S, de Boer J, Tearney G, Bouma B. Optics Express. 2005;13:5483. doi: 10.1364/opex.13.005483. [DOI] [PMC free article] [PubMed] [Google Scholar]
- 15.Chu B. Laser Light Scattering 2e: Basic Principles and Practice. Academic Press; 2012. [Google Scholar]
- 16.Yun SH, Tearney G, de Boer J, Bouma B. Optics Express. 2004;12:2977. doi: 10.1364/opex.12.002977. [DOI] [PMC free article] [PubMed] [Google Scholar]
- 17.Yun S, Tearney G, de Boer J, Bouma B. Optics Express. 2004;12:4822. doi: 10.1364/opex.12.004822. [DOI] [PMC free article] [PubMed] [Google Scholar]
- 18.De Grauw CJ, Sijtsema NM, Otto C, Greve J. Journal of Microscopy. 1997;188:273. [Google Scholar]
- 19.Chhetri RK, Kozek KA, Johnston-Peck AC, Tracy JB, Oldenburg AL. Phys Rev E. 2011;83:040903. doi: 10.1103/PhysRevE.83.040903. [DOI] [PMC free article] [PubMed] [Google Scholar]
- 20.Forsyth AM, Wan J, Owrutsky PD, Abkarian M, Stone HA. Proc Natl Acad Sci U S A. 2011;108:10986. doi: 10.1073/pnas.1101315108. [DOI] [PMC free article] [PubMed] [Google Scholar]
- 21.Popov I, Weatherbee AS, Vitkin IA. J Biomed Opt. 2014;19:127004. doi: 10.1117/1.JBO.19.12.127004. [DOI] [PubMed] [Google Scholar]
- 22.Taylor TW, Sorensen CM. Appl Opt, AO. 1986;25:2421. doi: 10.1364/ao.25.002421. [DOI] [PubMed] [Google Scholar]
- 23.Popov I, Vitkin A. J Biomed Opt. 2016;21:017002. [Google Scholar]
- 24.Dainty JC. In: Progress in Optics. Wolf E, editor. Vol. 14. Elsevier; 1977. pp. 1–6. [Google Scholar]
- 25.Wojtkowski M, Srinivasan VJ, Ko TH, Fujimoto JG, Kowalczyk A, Duker JS. Optics Express. 2004;12:2404. doi: 10.1364/opex.12.002404. [DOI] [PubMed] [Google Scholar]
- 26.Yun SH, Tearney GJ, Vakoc BJ, Shishkov M, Oh WY, Desjardins AE, Suter MJ, Chan RC, Evans JA, Jang IK, Nishioka NS, de Boer JF, Bouma BE. Nature Medicine. 2006;12:1429. doi: 10.1038/nm1450. [DOI] [PMC free article] [PubMed] [Google Scholar]
- 27.van Staveren HJ, Moes CJM, van Marie J, Prahl SA, van Gemert MJC. Appl Opt, AO. 1991;30:4507. doi: 10.1364/AO.30.004507. [DOI] [PubMed] [Google Scholar]
- 28.Wang Y, Wang R. Opt Lett. 2010;35:3538. doi: 10.1364/OL.35.003538. [DOI] [PMC free article] [PubMed] [Google Scholar]
- 29.Mohan N, Vakoc B. Opt Lett. 2011;36:2068. doi: 10.1364/OL.36.002068. [DOI] [PMC free article] [PubMed] [Google Scholar]
- 30.Liu X, Huang Y, Ramella-Roman JC, Mathews SA, Kang JU. Opt Lett. 2013;38:805. doi: 10.1364/OL.38.000805. [DOI] [PMC free article] [PubMed] [Google Scholar]
- 31.Tokayer J, Jia Y, Dhalla AH, Huang D. Biomedical Optics Express. 2013;4:1909. doi: 10.1364/BOE.4.001909. [DOI] [PMC free article] [PubMed] [Google Scholar]


