

Abstract
The majority of lipids in the brain are located in the bilayer membranes. These lipids are not visible by magnetic resonance spectroscopy since they have restricted mobility. Only mobile lipids, such as cholesterol esters or triglycerides in neutral lipid droplets, have enough rotational freedom to generate a signal on spectroscopy. These signals are detected as peaks at 1.3 ppm, originating from the methylene groups in the fatty acid chain, and 0.9 ppm, originating from the distal methyl group. We review the literature on the different genetic conditions that have been found to show lipid peaks on brain spectroscopy and report the first patient with carnitine palmitoyltransferase 2 deficiency shown to have such lipid peaks, thus indicating brain fat accumulation.
Introduction
Lipids that are visible by magnetic resonance imaging are known as mobile lipids, since they are able to freely rotate and be detected on magnetic resonance spectroscopy (MRS). Thus, MRS does not detect lipids in the cellular membrane, as these have restricted mobility, but rather lipid droplets inside the cells, such as cholesterol esters or triglycerides. The main spectroscopy peaks originate from the resonance of protons in the fatty acyl chains, predominantly arising from the methylene (CH2-CH2-CH2) and methyl (CH3-CH2) groups at 1.3 and 0.9 ppm, respectively. These peaks are more readily noticeable at short echo times (TE) of 35 ms and decrease in amplitude at longer echo times (135–144 ms and 270–288 ms). The peak originating from the protons in the methylene group peaks at the same location as that of lactate, and both peaks have a positive deflection at short TE. However, the lactate peak appears like a doublet – due to J-coupling – and it inverts at a long TE (135–144 ms), while lipid peaks do not invert.
In this report, we describe for the first time a patient with the hepatocardiomuscular form of CPT2 deficiency (OMIM 600649) exhibiting a lipid peak on cerebral MRS and provide a review of the literature on the various etiologies of lipid peaks.
Methods
Magnetic Resonance Spectroscopy (MRS)
The voxel of interest was placed over the left basal ganglia and measured 2 × 2 × 2 cm. Spectra were obtained using PRESS technique on a 3 Tesla system (GE Healthcare, Waukesha, WI) at short and long echo times (TE = 35 and 144 ms, TR = 1,500 ms).
Sanger Sequencing
Exons 1–5 of the CPT2 gene and their flanking splice sites were PCR amplified from genomic DNA. Bidirectional sequence was performed in a commercial laboratory, and DNA sequenced was analyzed and compared to the published sequence (NM_000098.2). Given the finding of a homozygous variant (see below), the presence of the mutation was confirmed in a new DNA preparation by repeat sequence analysis using an alternate primer pair to significantly reduce the possibility of allele dropout secondary to mispriming.
Results
Case Presentation
Our patient was born by spontaneous vaginal delivery at 39 weeks gestation to a 30-year-old Hispanic mother. Pregnancy was complicated by preeclampsia and placenta previa. Her birth size was appropriate for gestational age, and her Apgar scores were 9 and 9 at 1 and 5 min, respectively. She started breastfeeding soon after birth, and her first day of life was uneventful. On day of life 2, she began grunting and became hypoglycemic (blood glucose ranging from 1.7 to 2.5 mmol/L). She also had an episode of tonic–clonic jerking of the left upper and lower extremities that lasted approximately five minutes. A subsequent video EEG showed excessive sharp waves and one 20-second event arising from the right occipital lobe that represented an electrographic seizure, with no clinical correlate on video. Given the presence of a focal EEG finding, a brain MRI/MRS was obtained on day of life 3 (vide infra).
Her newborn screening returned on day of life 5 showing elevation of C16 at 24.34 μmol/L (reference: <8.0 μmol/L) and C14 of 2.59 μmol/L (ref: <0.73 μmol/L), consistent with carnitine palmitoyltransferase 2 (CPT2) deficiency. A confirmatory plasma acylcarnitine profile showed marked elevations of C16 of 19.61 μmol/L (ref: < 0.35 μmol/L), C16:1 5.15 μmol/L (ref: <0.14 μmol/L), C14 1.63 μmol/L (ref: <0.10 μmol/L), C18:2 2.09 μmol/L (ref: <0.11 μmol/L), C18:1 10.96 μmol/L (ref: <0.24 μmol/L), and C18 4.13 μmol/L (ref: < 0.09 μmol/L). She was then started on a low-fat formula, with 25–35% of calories coming from medium-chain triglycerides and 5–15% from long-chain triglycerides.
Her serum creatine kinase level was 506 U/L on day of life six and gradually improved to 126 U/L on day of life nine. Her AST peaked at 176 U/L and ALT at 212 U/L on day of life 6. A chest X-ray revealed enlargement of the cardiomediastinal silhouette and prominence of the pulmonary vascularity, while an echocardiogram showed mild-to-moderate concentric left ventricular hypertrophy, a thickened right ventricle free wall, and mild hyperdynamic left ventricular function.
The patient was eventually discharged home at week of life 2 in stable condition.
Sanger sequencing of the CPT2 gene revealed a homozygous c.1511C>T (p.Pro504Leu) mutation.
Brain Imaging
Brain MRS revealed a large abnormal peak in the left basal ganglia at 1.3 ppm (see Fig. 1), which was not a doublet and did not invert at 144 ms as one would expect of lactate. For comparison, Fig. 2 shows the spectrum of a different patient with a lactate doublet upright at 35 ms and inverted at 144 ms. Our patient’s spectrum also had a smaller peak at 0.9 ppm at 35 ms. Choline, creatine, and N-acetylaspartate peaks were normal for age (see Xu and Vigneron 2010 for normal reference).
Fig. 1.
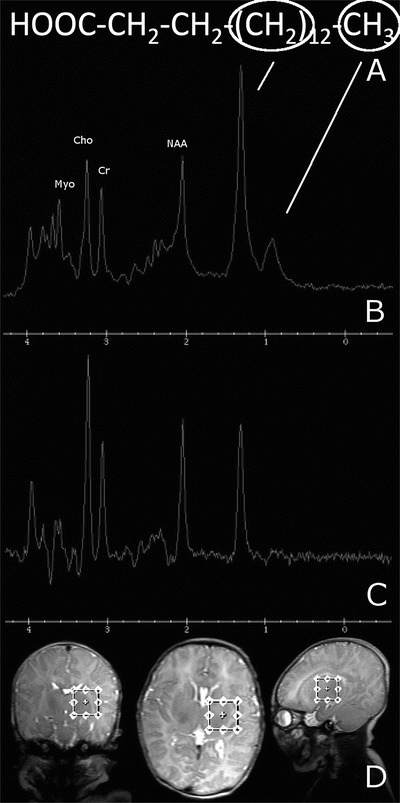
(a) A representative fatty acid of 16-carbon length (palmitic acid) is used as an example of the different functional groups of a lipid molecule that produce peaks in the spectrum. The methylene group causes a peak at 1.3 ppm, while the methyl group causes a peak at 0.9 ppm. Given the presence of more numerous methylene groups than methyl groups per fatty acid molecule, the peak at 1.3 ppm will be larger than the one at 0.9 ppm. (b) MRS at short TE showing a prominent peak at 1.3 ppm and a lesser peak at 0.9 ppm. (c) Long TE showing that the 1.3 ppm peak, though diminished in height, still remains positive, thus ruling out the possibility of a lactate peak. (d) Images showing the volume of interest over the left basal ganglia
Fig. 2.
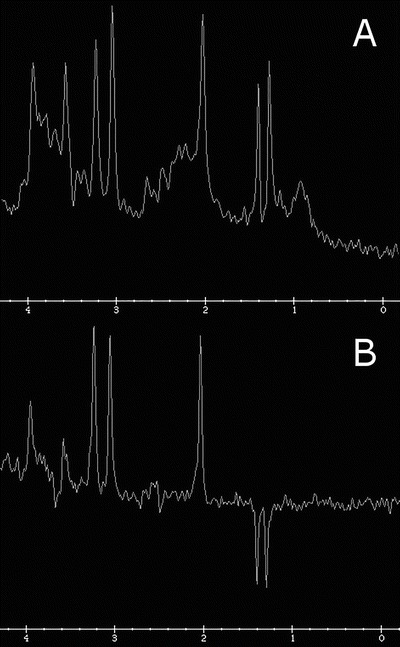
MRS at short (a) and long (b) echo times in a different patient showing a lactate doublet at 1.3 ppm, upright at 35 ms and inverted at 144 ms
Conventional MRI sequences (T1, T2, DWI) demonstrated a structurally normal brain. There was mild T1 hyperintensity in the bilateral occipital cortex, which was attributed to hypoglycemic injury. There were also a few punctate T1 hyperintense foci in the right parietal white matter, which were nonspecific. The remainder of the brain, including the bilateral basal ganglia, appeared normal on conventional sequences. No diffusion abnormality was seen in any location.
Discussion
Mobile lipids, visible on MRS, can be seen in various acquired disorders, such as areas of necrosis within high-grade brain tumors (Kimura et al. 2004; Delorme and Weber 2006), active lesions from demyelinating diseases such as multiple sclerosis (Wolinsky et al. 1990; Near 2013), and infectious etiologies as in tuberculomas and toxoplasmosis (Kingsley et al. 2006). Care should also be taken not to place the voxel too close to the skull, as this will capture the resonance from fat molecules in the diploe and scalp (Caruso et al. 2004; Near 2013). In this case, we placed the voxel far from the scalp and cranium (Fig. 1), so there was no possibility of contamination from these structures.
Several genetic causes of lipid peaks on MRS have been so far described (see Table 1), indicating the presence of intercellular or intracellular lipid vacuoles, either inside neurons or glial cells. In addition, even though the authors are not aware of a case report of Refsum disease causing an abnormal lipid peak on MRS, it is likely that some patients with this condition will exhibit lipid peaks, as fat deposits are found in the globus pallidus during autopsy (Allen et al. 1978). Lipid droplets and elevated long-chain acylcarnitine concentrations have been found in various tissues in patients with neonatal-onset CPT2 deficiency, including liver, kidney, skeletal muscle, heart, lung, and adrenal (North et al. 1995; Pierce et al. 1999). It is likely that our patient had cerebral accumulation of long-chain acylcarnitines, giving rise to the lipid peak detected on MRS. It would have been of academic interest to assess for MRS changes after treatment initiation, but this was not performed, as it would not have changed clinical management.
Table 1.
Genetic causes of lipid peaks on cerebral MRS
| Disease | Presumably accumulated lipid | Location | References |
|---|---|---|---|
| X-ALD | VLCFA vs. short-chain fatty acids from increased turnover of myelin lipids | Occipital or frontal WM lesions | Confort-Gouny et al. (1995), Oz et al. (2005) |
| PBD-ZSS | VLCFA | WM > thalamus. Basal ganglia | Bruhn et al. (1992), Groenendaal et al. (2001) |
| RCDP | Fatty alcohols vs. long-chain acyl-CoAs (increased given decreased incorporation into plasmalogens) | Normal-appearing white matter | Viola et al. (2002), Alkan et al. (2003) |
| Sjögren–Larsson syndrome | Long-chain fatty alcohols and/or fatty aldehydes | Cerebral WM and basal ganglia; taller peaks in PV regions, mainly trigones (posterior > anterior). Not present in cerebral cortex | Miyanomae et al. (1995), Mano et al. (1999), van Domburg et al. (1999), Willemsen et al. (2004), Nakayama et al. (2006) |
| Chanarin–Dorfman syndrome | Triacylglycerol | Cerebral WM and cortex, basal ganglia | Huigen et al. (2015) |
| CTX | Cholestanol | Cerebellar dentate nucleus | Embiruçu et al. (2010) |
| Smith–Lemli–Opitz syndrome | 7-DHC and/or 8-DHC | WM | Caruso et al. (2004) |
| CPT 1 deficiency | Long-chain acyl-CoAs | Thalamus and cortex > WM | Roomets et al. (2006) |
| CACT deficiency | Long-chain acylcarnitines | Deep cerebral WM | Fearing et al. (2011) |
| LCHAD deficiency | Long-chain hydroxy-acyl-CoAs | Unknown (multivoxel technique) | Deltetto et al. (2012) |
| Niemann–Pick type C disease | Unesterified cholesterol and/or gangliosides | Central WM and gray matter | Sylvain et al. (1994) |
| Neuronopathic Gaucher disease | Glucosylceramide and/or glucosylsphingosine | WM. Peak present in all patients with type 2 and 9/15 with type 3 | Razek et al. (2013) |
| SPG54 | Triacylglycerol | Basal ganglia and thalamus | Schuurs-Hoeijmakers et al. (2012) |
| HCC | Fatty acids from myelin breakdown | PV WM | Rossi et al. (2008) |
7-DHC 7-dehydrocholesterol, 8-DHC 8-dehydrocholesterol, CACT carnitine-acylcarnitine translocase, CPT carnitine palmitoyltransferase, CTX cerebrotendinous xanthomatosis, HCC hypomyelination and congenital cataract, LCHAD long-chain 3-hydroxyacyl-coA dehydrogenase, PBD-ZSS peroxisome biogenesis disorder–Zellweger syndrome spectrum, PV periventricular, RCDP rhizomelic chondrodysplasia punctata, SPG54 autosomal recessive spastic paraplegia 54, VLCFA very long-chain fatty acids, WM white matter, X-ALD adrenoleukodystrophy
A lipid peak on cerebral MRS has previously been described in a case of CPT1 deficiency (Roomets et al. 2006), although this likely represented an accumulation of long-chain acyl-CoAs as opposed to long-chain acylcarnitines. This assumption is based on the fact that in the process of transporting fatty acids into the mitochondria so that they can undergo β-oxidation, CPT1 normally converts long-chain acyl-CoAs into long-chain acylcarnitines in the outer mitochondrial membrane, while CPT2 converts long-chain acylcarnitines back to long-chain acyl-CoAs in the inner mitochondrial membrane. A carnitine-acylcarnitine translocase (CACT) carries the long-chain acyl-CoAs across the inner mitochondrial membrane, and a patient with CACT deficiency with lipid peaks on brain MRS was previously described (Fearing et al 2011). This patient had a follow-up MRS 8 months after the acute crisis, showing resolution of the lipid peaks after initiation of treatment.
MRI with MRS is routinely performed at our institution for neonates presenting with seizures. The MRI can detect brain structural abnormalities, while the MRS is sensitive for metabolic abnormalities that may present with seizures. This patient illustrates the value of routine performance of MRS in this patient population, as the MRI alone could not have detected the inborn error of metabolism. We typically place the voxel of interest in the basal ganglia when screening for metabolic abnormalities, as the deep gray structures are among the most metabolically active areas in the neonatal brain. Presumably we would have also detected lipid abnormalities had we placed the voxel elsewhere, for example in the white matter, but we cannot be certain.
Severe forms of CPT2 deficiency can present with encephalopathy, intractable seizures with multifocal spike discharges, hemorrhages, periventricular cysts, ventriculomegaly, partial absence of the corpus callosum, Dandy–Walker malformation with severe hydrocephalus, polymicrogyria, gray matter and neuroglial heterotopias, and periventricular white matter calcifications (North et al. 1995; Pierce et al. 1999; Elpeleg et al. 2001; Isackson et al. 2008; Meir et al. 2009). To our knowledge, brain MRS has never before been reported in a patient with CPT2 deficiency.
Here, we present the first case report of lipid peaks in a patient with the infantile form of CPT2 deficiency during her initial presentation. The finding of a lipid peak was seen even before the newborn screening results became available. Taking into account the multiple etiologies that can potentially lead to a lipid peak on MRS, its finding should elicit the appropriate diagnostic workup based on the patient’s clinical presentation. Early detection of an abnormality in lipid metabolism on MRS may also direct therapy. For example, a formula low in long-chain triglycerides could be initiated to help protect the brain from further injury while waiting for a definitive biochemical diagnosis.
Conclusion
We describe the first report of brain MRS findings in CPT2 deficiency. We performed a literature review that should help narrow the differential diagnosis upon finding a lipid peak on MRS.
Synopsis
Patients with long-chain fatty acid β-oxidation disorders in acute crisis can present with cerebral fat accumulation that is detectable by MR spectroscopy.
Compliance with Ethics Guidelines
Conflicts of Interest
Carlos R. Ferreira, Molly H. Silber, Taeun Chang, Jonathan G. Murnick, and Brian Kirmse declare that they have no conflict of interest.
Details of the Contributions of Individual Authors
Writing and preparation of the manuscript: CRF, MHS, and JGM
Clinical management and investigation of the patient: TC and BK
Detailed review of the patient’s brain imaging: JGM
Critical review of the manuscript: All authors
Footnotes
Competing interests: None declared
References
- Alkan A, Kutlu R, Yakinci C, et al. Delayed myelination in a rhizomelic chondrodysplasia punctata case: MR spectroscopy findings. Magn Reson Imaging. 2003;21:77–80. doi: 10.1016/S0730-725X(02)00625-2. [DOI] [PubMed] [Google Scholar]
- Allen IV, Swallow M, Nevin NC, McCormick D. Clinicopathological study of Refsum’s disease with particular reference to fatal complications. J Neurol Neurosurg Psychiatry. 1978;41:323–332. doi: 10.1136/jnnp.41.4.323. [DOI] [PMC free article] [PubMed] [Google Scholar]
- Bruhn H, Kruse B, Korenke GC, et al. Proton NMR spectroscopy of cerebral metabolic alterations in infantile peroxisomal disorders. J Comput Assist Tomogr. 1992;16:335–344. doi: 10.1097/00004728-199205000-00001. [DOI] [PubMed] [Google Scholar]
- Caruso PA, Poussaint TY, Tzika AA, et al. MRI and 1H MRS findings in Smith–Lemli–Opitz syndrome. Neuroradiology. 2004;46:3–14. doi: 10.1007/s00234-003-1110-1. [DOI] [PubMed] [Google Scholar]
- Confort-Gouny S, Vion-Dury J, Chabrol B, et al. Localised proton magnetic resonance spectroscopy in X-linked adrenoleukodystrophy. Neuroradiology. 1995;37:568–575. doi: 10.1007/BF00593724. [DOI] [PubMed] [Google Scholar]
- Delorme S, Weber M-A. Applications of MRS in the evaluation of focal malignant brain lesions. Cancer Imaging. 2006;6:95–99. doi: 10.1102/1470-7330.2006.0015. [DOI] [PMC free article] [PubMed] [Google Scholar]
- Deltetto N, Maxit C, Marchione D, et al. Long chain 3-hydroxyacyl-coA dehydrogenase deficiency, association with HELLP and magnetic resonance spectroscopy findings. Arch Argent Pediatr. 2012;110:e63–e66. doi: 10.5546/aap.2012.e63. [DOI] [PubMed] [Google Scholar]
- Elpeleg ON, Hammerman C, Saada A, et al. Antenatal presentation of carnitine palmitoyltransferase II deficiency. Am J Med Genet. 2001;102:183–187. doi: 10.1002/ajmg.1457. [DOI] [PubMed] [Google Scholar]
- Embiruçu EK, Otaduy MCG, Taneja AK, et al. MR spectroscopy detects lipid peaks in cerebrotendinous xanthomatosis. AJNR Am J Neuroradiol. 2010;31:1347–1349. doi: 10.3174/ajnr.A1885. [DOI] [PMC free article] [PubMed] [Google Scholar]
- Fearing MK, Israel EJ, Sahai I, et al. Case records of the Massachusetts General Hospital. Case 12-2011. A 9-month-old boy with acute liver failure. N Engl J Med. 2011;364:1545–1556. doi: 10.1056/NEJMcpc1013928. [DOI] [PubMed] [Google Scholar]
- Groenendaal F, Bianchi MC, Battini R, et al. Proton magnetic resonance spectroscopy (1H-MRS) of the cerebrum in two young infants with Zellweger syndrome. Neuropediatrics. 2001;32:23–27. doi: 10.1055/s-2001-12218. [DOI] [PubMed] [Google Scholar]
- Huigen MCDG, van der Graaf M, Morava E, et al. Cerebral lipid accumulation in Chanarin–Dorfman syndrome. Mol Genet Metab. 2015;114:51–54. doi: 10.1016/j.ymgme.2014.10.016. [DOI] [PubMed] [Google Scholar]
- Isackson PJ, Bennett MJ, Lichter-Konecki U, et al. CPT2 gene mutations resulting in lethal neonatal or severe infantile carnitine palmitoyltransferase II deficiency. Mol Genet Metab. 2008;94:422–427. doi: 10.1016/j.ymgme.2008.05.002. [DOI] [PubMed] [Google Scholar]
- Kimura T, Sako K, Tanaka K, et al. Evaluation of the response of metastatic brain tumors to stereotactic radiosurgery by proton magnetic resonance spectroscopy, 201TlCl single-photon emission computerized tomography, and gadolinium-enhanced magnetic resonance imaging. J Neurosurg. 2004;100:835–841. doi: 10.3171/jns.2004.100.5.0835. [DOI] [PubMed] [Google Scholar]
- Kingsley PB, Shah TC, Woldenberg R. Identification of diffuse and focal brain lesions by clinical magnetic resonance spectroscopy. NMR Biomed. 2006;19:435–462. doi: 10.1002/nbm.1039. [DOI] [PubMed] [Google Scholar]
- Mano T, Ono J, Kaminaga T, et al. Proton MR spectroscopy of Sjögren–Larsson’s syndrome. AJNR Am J Neuroradiol. 1999;20:1671–1673. [PMC free article] [PubMed] [Google Scholar]
- Meir K, Fellig Y, Meiner V, et al. Severe infantile carnitine palmitoyltransferase II deficiency in 19-week fetal sibs. Pediatr Dev Pathol. 2009;12:481–486. doi: 10.2350/08-10-0548.1. [DOI] [PubMed] [Google Scholar]
- Miyanomae Y, Ochi M, Yoshioka H, et al. Cerebral MRI and spectroscopy in Sjögren–Larsson syndrome: case report. Neuroradiology. 1995;37:225–228. doi: 10.1007/BF01578262. [DOI] [PubMed] [Google Scholar]
- Nakayama M, Távora DGF, Alvim TCL, et al. MRI and 1H-MRS findings of three patients with Sjögren–Larsson syndrome. Arq Neuropsiquiatr. 2006;64:398–401. doi: 10.1590/S0004-282X2006000300009. [DOI] [PubMed] [Google Scholar]
- Near J (2013) Spectral quantification and pitfalls in interpreting magnetic resonance spectroscopic data: what to look out for. In: Stagg C, Rothman DL (eds) Magnetic resonance spectroscopy: tools for neuroscience research and emerging clinical applications. San Diego: Academic Press, 49–67
- North KN, Hoppel CL, De Girolami U, et al. Lethal neonatal deficiency of carnitine palmitoyltransferase II associated with dysgenesis of the brain and kidneys. J Pediatr. 1995;127:414–420. doi: 10.1016/S0022-3476(95)70073-0. [DOI] [PubMed] [Google Scholar]
- Oz G, Tkác I, Charnas LR, et al. Assessment of adrenoleukodystrophy lesions by high field MRS in non-sedated pediatric patients. Neurology. 2005;64:434–441. doi: 10.1212/01.WNL.0000150906.52208.E7. [DOI] [PubMed] [Google Scholar]
- Pierce MR, Pridjian G, Morrison S, Pickoff AS. Fatal carnitine palmitoyltransferase II deficiency in a newborn: new phenotypic features. Clin Pediatr (Phila) 1999;38:13–20. doi: 10.1177/000992289903800102. [DOI] [PubMed] [Google Scholar]
- Razek AAKA, Abdalla A, Gaber NA, et al. Proton MR Spectroscopy of the brain in children with neuronopathic Gaucher’s disease. Eur Radiol. 2013;23:3005–3011. doi: 10.1007/s00330-013-2924-9. [DOI] [PubMed] [Google Scholar]
- Roomets E, Lundbom N, Pihko H, et al. Lipids detected by brain MRS during coma caused by carnitine palmitoyltransferase 1 deficiency. Neurology. 2006;67:1516–1517. doi: 10.1212/01.wnl.0000240118.82937.ed. [DOI] [PubMed] [Google Scholar]
- Rossi A, Biancheri R, Zara F, et al. Hypomyelination and congenital cataract: neuroimaging features of a novel inherited white matter disorder. AJNR Am J Neuroradiol. 2008;29:301–305. doi: 10.3174/ajnr.A0792. [DOI] [PMC free article] [PubMed] [Google Scholar]
- Schuurs-Hoeijmakers JHM, Geraghty MT, Kamsteeg E-J, et al. Mutations in DDHD2, encoding an intracellular phospholipase A(1), cause a recessive form of complex hereditary spastic paraplegia. Am J Hum Genet. 2012;91:1073–1081. doi: 10.1016/j.ajhg.2012.10.017. [DOI] [PMC free article] [PubMed] [Google Scholar]
- Sylvain M, Arnold DL, Scriver CR, et al. Magnetic resonance spectroscopy in Niemann–Pick disease type C: correlation with diagnosis and clinical response to cholestyramine and lovastatin. Pediatr Neurol. 1994;10:228–232. doi: 10.1016/0887-8994(94)90028-0. [DOI] [PubMed] [Google Scholar]
- van Domburg PH, Willemsen MA, Rotteveel JJ, et al. Sjögren–Larsson syndrome: clinical and MRI/MRS findings in FALDH-deficient patients. Neurology. 1999;52:1345–1352. doi: 10.1212/WNL.52.7.1345. [DOI] [PubMed] [Google Scholar]
- Viola A, Confort-Gouny S, Ranjeva J-P, et al. MR imaging and MR spectroscopy in rhizomelic chondrodysplasia punctata. AJNR Am J Neuroradiol. 2002;23:480–483. [PMC free article] [PubMed] [Google Scholar]
- Willemsen MAAP, Van Der Graaf M, Van Der Knaap MS, et al. MR imaging and proton MR spectroscopic studies in Sjögren-Larsson syndrome: characterization of the leukoencephalopathy. AJNR Am J Neuroradiol. 2004;25:649–657. [PMC free article] [PubMed] [Google Scholar]
- Wolinsky JS, Narayana PA, Fenstermacher MJ. Proton magnetic resonance spectroscopy in multiple sclerosis. Neurology. 1990;40:1764–1769. doi: 10.1212/WNL.40.11.1764. [DOI] [PubMed] [Google Scholar]
- Xu D, Vigneron D. Magnetic resonance spectroscopy imaging of the newborn brain–a technical review. Semin Perinatol. 2010;34:20–27. doi: 10.1053/j.semperi.2009.10.003. [DOI] [PMC free article] [PubMed] [Google Scholar]