

Abstract
The population of Salmonella enterica serovar Typhi (S. Typhi), the causative agent of typhoid fever, exhibits limited DNA sequence variation, which complicates efforts to rationally discriminate individual isolates. Here we utilize data from whole-genome sequences (WGS) of nearly 2,000 isolates sourced from over 60 countries to generate a robust genotyping scheme that is phylogenetically informative and compatible with a range of assays. These data show that, with the exception of the rapidly disseminating H58 subclade (now designated genotype 4.3.1), the global S. Typhi population is highly structured and includes dozens of subclades that display geographical restriction. The genotyping approach presented here can be used to interrogate local S. Typhi populations and help identify recent introductions of S. Typhi into new or previously endemic locations, providing information on their likely geographical source. This approach can be used to classify clinical isolates and provides a universal framework for further experimental investigations.
 Typhoid fever is caused by Salmonella enterica serovar Typhi (S. Typhi). This study examines ∼2,000 clinical isolates of S. Typhi to show highly structured/geographically restricted genomes except rapidly disseminating H58 subclade, and design a genotyping framework for tracking the disease.
Typhoid fever (typhoid), caused by Salmonella enterica serovar Typhi (S. Typhi) bacteria, is a systemic human infection that affects an estimated 20.6 million people globally each year, causing an estimated 223,000 deaths1,2,3. Typhoid remains endemic in populations with limited access to sanitation and safe water, and is a notifiable or reportable infection in many industrialized countries, where it is generally associated with travel to endemic areas. Public health laboratories have relied on techniques such as phage typing4,5 or pulsed-field gel electrophoresis6, which are phylogenetically naive and have limited discriminatory power to support epidemiological investigations and surveillance.
A genotyping scheme based on 88 single-nucleotide polymorphisms (SNPs) identified within a limited set of genes was previously developed for S. Typhi7. This enabled the classification of the S. Typhi population into 85 haplotypes (haploid genotypes) based on biallelic profiles and provided the first phylogenetic framework for epidemiological studies8. Subsequently, whole-genome sequencing (WGS) has been used to identify many more SNPs and other phylogenetically informative markers for discriminating within S. Typhi, which has limited genetic variation9,10,11,12,13,14,15,16. Similar progress has been made in other monophyletic clades of bacterial pathogens, such as Mycobacterium tuberculosis17 and Yersinia pestis18.
We have recently reported the WGS of almost 2,000 S. Typhi isolates sourced from 63 countries14. This study identified >22,000 chromosomal SNPs in the core genome, which were used to build a comprehensive phylogenetic tree. Notably, the analysis confirmed the emerging dominance of the multidrug resistance-associated H58 clade, including the recent spread of H58 S. Typhi into Africa, confirming the value of SNP-based WGS analysis of S. Typhi to understand contemporary typhoid epidemiology. Here we utilize these WGS data to define a global population framework for S. Typhi and to define a new genotyping scheme comprising 68 SNPs that provides extensive coverage of typhoid-causing bacteria circulating globally. Given the increasingly widespread adoption of WGS by public health laboratories for the tracking of bacterial pathogens19,20, we further aimed to explore the utility of S. Typhi WGS data, analysed via genotyping, to predict the geographical source of travel-associated S. Typhi isolated in the United Kingdom. This approach gives greater discriminatory power and improved phylogenetic information than the earlier scheme7, and forms a robust framework for public health surveillance, epidemiological investigations and laboratory experiments of typhoid.
Results
Defining phylogenetically informative genotypes for S. Typhi
In order to develop a comprehensive genotyping system, we used WGS data from >1,800 globally representative S. Typhi14 to identify phylogenetically informative clades and subclades based on SNP architecture21. A summary of the isolates is shown in Table 1 and full details are provided in Supplementary Data 1 and Supplementary Table 1. Using a combination of phylogenetic tree topology and population genetic methods (using BAPS; Bayesian Analysis of Population Structure21), we defined 16 S. Typhi clades that could be further divided into 49 subclades (Fig. 1, see Methods). Most of the clades could be grouped into four nested clusters (1–4, which we refer to as ‘primary clusters'), each with 100% bootstrap support and defined by >20 SNPs (coloured branches in Fig. 1a). The median pairwise distances between isolates were as follows: 25 SNPs within subclades, 109 SNPs within clades and 243 SNPs between clades. We labelled these primary clusters, clades and subclades using a structured hierarchical nomenclature system similar to that used for M. tuberculosis17, whereby cluster 1 is subdivided into clades 1.1 and 1.2; clade 1.1 is further subdivided into subclades 1.1.1, 1.1.2, 1.1.3 and so on (see Fig. 1b, Methods). An interactive version of the global phylogeny, with strains labelled by genotype, country of origin and year of isolation, is available at http://microreact.org/project/styphi22.
Table 1. Summary of 1,831 S. Typhi.
| Continent (region) | Country of origin (n⩾5) | Range of isolation dates (years) | Number of isolates |
|---|---|---|---|
| Asia | 1972–2012 | 1068 (58.3%) | |
| Southeast Asia | 1976–2012 | 719 | |
| Cambodia | 2007–2012 | 210 | |
| Indonesia | 1976–2012 | 129 | |
| Laos | 2000–2010 | 138 | |
| Vietnam | 1972–2011 | 221 | |
| Malaysia | 2005–2011 | 6 | |
| Other (Philippines, Thailand, East Timor, Myanmar) | 2002–2012 | 15 | |
| South Asia | 1977–2012 | 321 | |
| Bangladesh | 1998–2012 | 51 | |
| India | 1977–2012 | 174 | |
| Nepal | 1999–2012 | 47 | |
| Pakistan | 2003–2012 | 45 | |
| Other (Sri Lanka, Afghanistan) | 2001–2012 | 4 | |
| Western Asia | 1997–2011 | 25 | |
| Iraq | 2006–2011 | 11 | |
| Lebanon | 2001–2011 | 7 | |
| Other (Armenia, Palestine, Turkey, Western Asia) | 1997–2011 | 7 | |
| Eastern Asia | 2002–2011 | 3 | |
| Other (China) | 2002–2011 | 3 | |
| Africa | 1958–2013 | 374 (20.4%) | |
| North Africa | 1961–2009 | 24 | |
| Algeria | 1999–2009 | 7 | |
| Morocco | 1999–2000 | 9 | |
| Other (Sudan, Egypt, Tunisia) | 1961–2008 | 8 | |
| East Africa | 1980–2010 | 115 | |
| Kenya | 1998–2009 | 56 | |
| Tanzania | 2006–2010 | 52 | |
| Other (Comoros, Madagascar) | 1980–2002 | 7 | |
| Central Africa | 1958–2011 | 49 | |
| Cameroon | 1958–2009 | 27 | |
| DRC | 1976–2011 | 17 | |
| Other (Angola, Central African Republic) | 2001–2009 | 5 | |
| West Africa | 1998–2009 | 30 | |
| Other (Burkina Faso, Cape Verde, Benin, Guinea, Ivory Coast, Gabon, Liberia, Mali, Niger, Nigeria, Mauritania, Senegal, Togo) | 1998–2009 | 30 | |
| Southern Africa | 2004–2013 | 153 | |
| Malawi | 2004–2013 | 112 | |
| South Africa | 2004–2012 | 41 | |
| Africa | 2009–2012 | 3 | |
| Unknown | 2009–2012 | 3 | |
| Europe | 1916–2009 | 7 (0.4%) | |
| Eastern Europe | 1916–1996 | 2 | |
| Other (Russia) | 1916–1996 | 2 | |
| Western Europe | 2009 | 4 | |
| Other (France (suspected African origin of infection)) | 2009 | 4 | |
| Southern Europe | 2009 | 1 | |
| Other (Malta) | 2009 | 1 | |
| Australia and Oceania | 1980–2012 | 342 (18.7%) | |
| Australia | 2010–2012 | 3 | |
| Australia | 2010–2012 | 3 | |
| Oceania | 1980–2012 | 339 | |
| Fiji | 1981–2012 | 170 | |
| Samoa | 1992–2012 | 117 | |
| Papua New Guinea | 1980–2012 | 47 | |
| Other (Tonga, Vanuatu) | 1980–2003 | 5 | |
| North America | 1958–2011 | 5 (0.3%) | |
| Other (USA, Mexico) | 1958–2011 | 5 | |
| Central America | 2012 | 1 (0.05%) | |
| Other (El Salvador) | 2012 | 1 | |
| South America | 1905–2012 | 17 (0.9%) | |
| Argentina | 1905–2006 | 10 | |
| Other (French Guiana, Peru, South America ) | 2002–2012 | 6 | |
| Unknown origin | 1939–2012 | 19 (1.0%) |
S. Typhi, Salmonella enterica serovar Typhi.
Typhi isolates from the global collection, which were used to define genotypes. Countries with fewer than five isolates were grouped into the category ‘Other'; n indicates the number of such countries in each region.
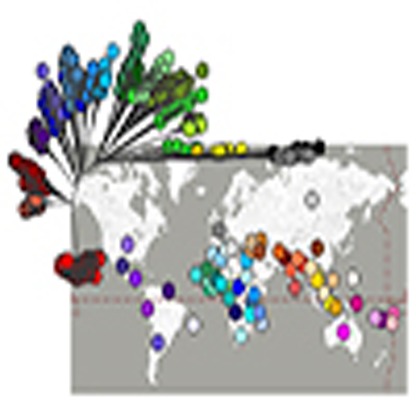
Figure 1. Population structure of S. Typhi based on genome-wide SNPs.

(a) Whole-genome tree of 1,831 global S. Typhi isolates. Primary clusters 1–4 are indicated in the outer coloured ring; branches defining these groups are coloured in the tree. These groups are further divided into clades, which are shaded and labelled. The location of S. Typhi reference genomes CT18 (accession number AL513382) and Ty2 (accession number AE014613) are indicated on the tree. Subclade 4.3.1 (H58, marked in red), which comprises half of the global collection, is represented by just 50 (6%) randomly selected isolates out of the total 852 belonging to this subclade, so that the relationships between other clades can be visualized. (b) Tree backbone showing further division of 16 S. Typhi clades (shaded) into 49 subclades (labelled; note 12 undifferentiated clade groups shown in brackets). Branches are coloured by primary cluster. (c) Map of the world showing subclade diversity of S. Typhi isolates in the global collection, by region22. Where groups of isolates from the same country and year belonged to the same subclade, this was classified as an ‘outbreak' and the group is only represented once in the pie graphs. Pies are sized to indicate number of isolates; slices are coloured by clade; multiple slices of the same colour indicate multiple subclades belonging to the same clade.
Under the new genotype nomenclature, the globally disseminated multidrug resistant clone commonly referred to as H58 (which actually includes haplotype H58 and eight other H58-derived haplotypes under the original Roumagnac et al. scheme7), constitutes a single subclade (4.3.1). No other subclades were identified within clade 4.3. The CT18 reference genome (H1 in Roumagnac et al. scheme) belonged to subclade 3.2.1, while the laboratory strain Ty2 and its attenuated mutant BRD948 (H10 under the Roumagnac scheme) belonged to clade 4.1 (with no further differentiation to subclade level by BAPS). The backbone of the minimum spanning tree of Roumagnac et al. haplotypes was broadly consistent with the backbone structure of the whole-genome phylogeny (Supplementary Fig. 1a). However, mapping the Roumagnac haplotypes to the whole-genome phylogeny showed that the older scheme provides highly uneven resolution across the S. Typhi phylogeny (Supplementary Fig. 1b), with a lack of resolution in some cases (11 Roumagnac haplotypes span two or more distinct subclades each; for example, H52 comprises clades 3.4, 3.5, 4.1 and 4.2) and excessive resolution in others (24 subclades are further divided into two or more haplotypes in the Roumagnac scheme).
A new SNP-based genotyping framework for S. Typhi
We identified a minimum set of 68 SNPs that can be used to genotype S. Typhi into the four primary clusters, 16 clades and 49 subclades. For each of these groups, we identified all SNPs that were unique to members of the group, and selected one such SNP to be used for genotyping. We prioritized the inclusion of synonymous intragenic SNPs (that is, located within a protein-coding sequence, but with no change to the encoded amino acid), within genes that showed evidence of genetic stability within the S. Typhi population (that is, nucleotide diversity <1% and dN/dS <0.7 across the global data set, with no inactivating mutations identified). Details of the genotyping SNPs are given in Supplementary Table 2. This genotyping scheme has greater discriminatory power than the original Roumagnac haplotyping scheme (D=0.96 versus 0.78), is phylogenetically informative by design and the hierarchical nomenclature of genotypes is intrinsically informative with respect to phylogenetic relationships between clades and subclades.
Geographical distribution of S. Typhi clades and subclades
Next, we examined the geographical distribution of S. Typhi genotypes. For these analyses, isolates of the same subclade, country and year were collapsed to a single representative to reduce the impact of localized outbreaks on our collection; this resulted in 541 unique isolates for analysis. Primary clusters 2, 3 and 4 were broadly distributed across continents (greens, blues and reds, respectively, in Fig. 1c), likely reflecting the relatively ancient spread of S. Typhi across the globe. Isolates outside these clusters, which result from deep branching closer to the root of the S. Typhi whole-genome tree, were rare in our collection (n=24 unique isolates) and mostly found in Africa (n=16). While the three common clusters (2–4) were present in most regions we analysed, cluster 2 predominated among American isolates (n=18/23 unique isolates, 78%). Most clades were detected on multiple continents (n=11/16) and included isolates from Asia (n=13/16) and/or Africa (n=10/16), which together made up 78% of our isolate collection (Table 1). However, there were differences in the geographic distributions of clades, with most clades being dominated by unique isolates from a single continent (Asia, Africa or Oceania; see Supplementary Fig. 2).
In contrast, at the subclade level, only 22% of subclades (n=11) were found on more than one continent, and most were dominated by unique isolates from a single country or region: 40 subclades (82%) had ⩾50% of non-outbreak isolates from a single country (Fig. 2) and 44 subclades (90%) had ⩾50% of non-outbreak isolates from a single region (Fig. 2). A total of 28 subclades comprised five or more non-outbreak isolates each, and of these common subclades, 12 (43%) were detected in a single region only (six in Oceania, five in Southeast Asia and one in South Asia; Fig. 2). In total, 16 common subclades (57%) were highly restricted to a region (>90% of isolates drawn from a single region) and 20 (71%) were generally associated with one region (>70% of isolates drawn from a single region; Fig. 2). These data suggest that most S. Typhi subclades represent localized bacterial subpopulations with barriers to geographical dispersion, and that transfers to new locations rarely result in long-term establishment of local populations. In contrast with this general pattern, subclade 4.3.1 (previously H58) was found in nine different regions across Africa, Asia and Oceania. Only 10 other subclades (20%) were found on more than one continent, and the majority of these were dominated either by Asian, African or Oceanian isolates (Fig. 2). Thus, the recent global dissemination of subclade 4.3.1, which spread out of South Asia ∼30 years ago and has established successful local clonal expansions in dozens of countries14, likely represents a comparatively rare event in the evolutionary history of S. Typhi.
Figure 2. Geographical clustering of S. Typhi subclades.

Heatmap shows, for each subclade, the percentage of unique isolates originating from each of the geographical regions. Where groups of isolates from the same country and year belonged to the same subclade, this was classified as an ‘outbreak' and the group is only represented once. The same data are represented as a scaled bar graph to the right. The full list of isolates by country and subclade is provided in Supplementary Data 1.
Genomic prediction of the geographical origins of S. Typhi by comparison with the global framework
Since most S. Typhi subclades were associated with a narrow geographical source, we hypothesized that genotyping of S. Typhi isolates could be used to predict the likely geographical origins of typhoid cases. As this is clearly challenging for the more widely distributed subclades, we also sought to examine whether specific SNPs could be used to predict origins down to the country level. For 1,501 out of 1,831 (82%) isolates in our global collection, the genetically closest isolate was from the same country. Where the closest isolate was 0–1 SNPs away, this frequency was 95% and for <10 SNPs, 90% (Supplementary Fig. 3).
Since our current global genome collection includes groups of isolates that were frequently collected from the same time and place, this should not be taken as a reliable measure of the general predictive power of SNP distance for S. Typhi. In order to further explore the power of our global genomic framework to predict geographic origins of travel-associated typhoid, we sequenced and genotyped 99 novel S. Typhi that were isolated from patients attending a hospital in East London, United Kingdom between 2005 and 2010 (Table 2). A total of 13 genotypes were identified. Epidemiological interviews were able to link 81 of these cases with travel to a specific country; the remaining 18 cases were not associated with travel. The median SNP distance between these novel isolates and genomes in our global collection was 21 SNPs (interquartile range, 18–25 SNPs), posing a challenge for prediction of their geographical origin. Among the 81 travel-associated UK isolates, 53 were genotyped as 4.3.1; these were all linked to travel to countries within South Asia (Table 3), and clustered along with South Asian isolates from the global collection (Fig. 3 and Supplementary Fig. 4n). For the 28 non-4.3.1 travel-associated UK isolates, the location of travel generally matched the geographical origin of the closest isolate (in terms of number of SNPs) in the global collection: travel location and closest global isolate source matched at the region level in all cases, and at the country level in most cases (n=20, 71%). That is, prediction of geographical origin based on the closest strain of known location in the current global framework would have yielded the correct region of origin in all cases, and the correct country of origin in 71% of cases (95% confidence interval (CI), 66–76%). Furthermore, for non-4.3.1 subclades, genotyping alone was predictive of geographical origin at the regional level for the same proportion of isolates (71%).
Table 2. Summary of 99 East London travel-associated S. Typhi isolates used in the study.
| Country of origin | Range of isolation dates (year) | Number of isolates |
|---|---|---|
| Bangladesh | 2006–2012 | 38 |
| India | 2006–2012 | 22 |
| Pakistan | 2006–2012 | 13 |
| Nepal | 2007 | 1 |
| India/Pakistan* | 2008 | 1 |
| India/Kuwait* | 2008 | 2 |
| Bangladesh/India* | 2010 | 2 |
| Nigeria | 2009 | 1 |
| Ghana | 2007 | 1 |
| No known travel | 2005–2011 | 18 |
| Total | 2005–2012 | 99 |
S. Typhi, Salmonella enterica serovar Typhi.
The country of origin and range of isolation dates (years) for the isolates are described.
*For five patients, multiple countries of travel were recorded, and it was not possible to confirm in which country the S. Typhi infection originated.
Table 3. Summary of genotyping and SNP results for travel-associated S. Typhi isolates with known country of travel.
| Subclade | Country of travel | N (travel) | Closest genome country match | N (global) | Region frequencies (excluding outbreaks) |
|---|---|---|---|---|---|
| 2.0.1 | Bangladesh | 1 | 1 | 9 | *South Asia (100%) |
| 2.1.7 | India | 2 | 2 | 49 | Oceania (92%) |
| 2.2.0 | Pakistan | 1 | 1 | 17 | Southern Africa (24%)East Africa (24%)South Asia (18%) |
| 2.2.2 | India | 1 | 1 | 9 | South Asia (33%)Western Asia (33%) |
| 2.3.3 | Bangladesh | 2 | 2 | 9 | South America (56%)South Asia (33%) |
| 3.1.1 | Nigeria, Ghana | 2 | 0 | 25 | *West Africa (68%) |
| 3.2.2 | Bangladesh, Pakistan | 3 | 2 | 12 | *South Asia (83%) |
| 3.3.0 | Bangladesh, Pakistan, India | 14 | 13 | 30 | *South Asia (83%) |
| 3.3.1 | Pakistan | 1 | 1 | 32 | East Africa (44%)South Asia (19%) |
| 4.1.0 | India | 1 | 1 | 78 | Southeast Asia (71%) |
| 4.3.1 | Bangladesh, India, Pakistan, Nepal, Kuwait | 53 | — | 853 | Southeast Asia (50%)South Asia (26%) |
Closest genome country match, number of travel-associated isolates whose country of travel matched that of the closest genome in the global collection (based on lowest number of SNPs); N (global), number of isolates in the global collection that were assigned to this subclade; N (travel), number of travel-associated isolates that were assigned to the subclade; Region frequencies, frequency of each geographic region among isolates of this subclade from the global collection (note groups of isolates from the same subclade, country and year were classified as outbreaks and represented only once per group in the frequency calculations); SNP, single-nucleotide polymorphism; S. Typhi, Salmonella enterica serovar Typhi.
*Highlights the most frequent region for this subclade among the global collection, where this matches the region of travel.
Figure 3. Phylogeny of 99 travel-associated S. Typhi in comparison with the global genomic framework containing 1,831 isolates.

Whole-genome SNP tree is shown in the centre and branches are coloured by clade. Rings indicate region of origin: inner ring, global collection; outer ring, travel-associated isolates. Subclades that contain travel-associated isolates are highlighted within the tree (shaded in alternating colours) and labelled around the outside; intrasubclade phylogenies are provided in Supplementary Fig. 4.
It is likely that power to predict the geographical sources of UK isolates would be improved by wider geographical coverage in the reference genome collection. Two of these isolates were genotyped as subclade 3.1.1 and linked with travel to Ghana and Nigeria; the closest isolates in our global collection were 16–17 SNPs away and were not from these precise locations, but likely originated from bordering countries in West Africa (Supplementary Fig. 4e). It is likely that a deeper coverage of West African isolates in our global framework would provide greater power to resolve geographic associations within this region, which comprised less than 2% of our current global collection (n=30 isolates). Similarly, for the other travel-associated isolates for which the recorded country of travel did not match the closest genome in the global tree, the closest genome was also from a neighbouring country (for example, Pakistan, India, Bangladesh; see Supplementary Fig. 4).
Genomic predictions of the geographical origins of 18 non-travel-associated UK isolates are shown in Table 4 and Supplementary Fig. 4. Thirteen isolates were 4.3.1 and clustered together with travel-associated isolates from South Asia, within a broader group of South Asian 4.3.1 isolates (Fig. 3). This suggests that S. Typhi imported into the United Kingdom from these regions have likely been transmitted onwards within the United Kingdom to individuals with no recent travel history (Supplementary Fig. 4n). Two additional isolates were from subclades that were dominated by a single region in our global collection—3.1.1 (68% West Africa) and 3.3.0 (83% South Asia). Notably, while the 4.3.1 isolates were closely related to travel-associated isolates recently obtained in London, they were ⩾17 SNPs away from any isolates in the global collection. Thus, the diversity captured by the global collection does not provide the resolution to precisely identify the origin of these isolates23.
Table 4. Summary of genotyping and SNP results for travel-associated S. Typhi isolates of unknown origin.
| Isolate | Country of closest SNP match | Distance (#SNPs) | Subclade | Subclade distribution |
|---|---|---|---|---|
| H06434426 | Mexico | 146 | 2.0.2 | North America (50%)North Africa (50%) |
| H06156550 | Pakistan | 92 | 3.0.1 | South Asia (50%)North Africa (50%) |
| H05272442 | Ghana | 17 | 3.1.1 | *West Africa (68%) |
| H09176223 | Bangladesh | 11 | 3.3.0 | *South Asia (83%) |
| H10182335 | India | 18 | 3.3.1 | East Africa (44%)South Asia (19%) |
| H10046338 | Bangladesh† | 13 | 4.3.1 | Southeast Asia (50%)South Asia (26%) |
| H05406403 | Bangladesh† | 4 | ||
| H06136379 | Bangladesh† | 19 | ||
| H06136380 | Bangladesh† | 17 | ||
| H05118260 | Bangladesh/India† | 19 | ||
| H10382491 | India† | 9 | ||
| H10394694 | India† | 9 | ||
| H06016481 | India† | 9 | ||
| H05196407 | India† | 14 | ||
| H05196408 | India† | 12 | ||
| H05212226 | India† | 17 | ||
| H11372598 | Pakistan† | 10 | ||
| H09266336 | Pakistan† | 9 |
SNP, single-nucleotide polymorphism; S. Typhi, Salmonella enterica serovar Typhi.
For each London isolate, the closest isolate in the global collection was determined (closest=smallest SNP distance, that is, smallest number of core genome SNPs); the country and SNP distance are recorded.
*Highlights the most frequent region for this subclade among the global collection, where this matches the region of the closest isolate in the global collection.
†Location of closest travel-associated isolates from London (unresolvable beyond ‘South Asia' based on the global collection alone).
Discussion
Our data show that the global S. Typhi population consists of 49 distinct subclades that are strongly geographically clustered, with many locations harbouring subpopulations of S. Typhi established over long periods of time. We show how these subclades can be identified through a simple genotyping scheme consisting of 68 SNPs. Importantly, while we show that this scheme is highly phylogenetically informative, it can be readily inferred from raw sequence data without the need for multiple genome comparisons, phylogenetic analysis or any other complex or computationally intensive steps. Such properties make this universal SNP-based system a valuable tool upon which researchers can develop future studies. The S. Typhi genome is highly stable and exhibits minimal genetic variation and virtually no recombination9,14, and we recently estimated the substitution rate to be slower than one SNP per genome per year14; therefore, the genotyping framework is expected to be robust to future evolution.
Owing to the strong geographical clustering of the various subclades, whole-genome comparison of novel S. Typhi isolates to the existing global population framework is strongly predictive of geographic origin at the regional level and has the potential to accurately predict origins to the country level. This has important public health implications for typhoid surveillance and control in endemic and non-endemic areas; however, ongoing updates to the global genomic framework will be important to ensure the utility of genomic surveillance for typhoid. For example, we found that the origin of travel-associated 4.3.1 isolates could not be resolved using the prior global framework alone, but benefitted from updated information provided by other recent travel-associated isolates of known geographical origin. This illustrates the importance of expanding and updating the global genomic framework through sequencing of novel isolates and suggests that, while ongoing surveillance in endemic areas is undoubtedly important, the use of clinically well-characterized travel-associated organisms isolated in non-endemic countries may also provide a valuable source for improving the granularity of data in the framework for genome-based surveillance of S. Typhi23. In addition, it will be important to expand the current global framework to include more recent isolates (the most recent in our current collection was from 2013) as well as isolates from regions that are currently under-represented (including Africa, the Americas and northeast Asia).
WGS-equipped reference laboratories provide a highly accessible source to expand the global genomic framework for typhoid, with potential benefits to local but also global typhoid control. For example, in England, Wales and Northern Ireland ∼520 typhoid cases are reported annually to the national reference laboratory (Public Health England). These cases are investigated in order to determine whether they are associated with travel to typhoid endemic regions23. However, approximately one-fifth of typhoid cases in the United Kingdom cannot be traced to a country of origin. At present, Public Health England provides molecular typing, which since April 2015 includes WGS as well as antimicrobial susceptibility profiling, for S. Typhi isolated from such cases. The resulting data are considered important for local epidemiology. However, we propose that this could also serve as a proxy for informal surveillance of typhoid molecular epidemiology in endemic regions. This may prove particularly valuable when supported by our genotyping framework for simplified attribution.
Methods
Bacterial isolates and WGS
A total of 1,930 S. Typhi isolates were analysed in this study (Supplementary Data 1), including a collection of 1,831 globally distributed isolates contributed by members of the International Typhoid Consortium14 and 99 novel S. Typhi isolated in East London, UK. S. Typhi comprising the global collection were isolated between 1905 and 2013 and originate from 65 countries spanning six continents (Asia, Africa, North and South America, Europe, and Australia and Oceania) as previously described14.
An additional 99 novel S. Typhi isolates were obtained from returning travellers with a febrile illness who presented at The Royal London Hospital, Barts Health NHS Trust in East London, UK, between 2005 and 2012. Travel history, available for 81 of the travellers, included visits to seven countries within the continents of Asia and Africa. DNA was extracted using the Wizard Genomic DNA Kit (Promega, Madison, WI, USA) as per the manufacturer's instructions. Index-tagged paired end Illumina sequencing libraries were prepared as previously described24. These were combined into pools, each containing 96 uniquely tagged libraries, and were sequenced on the Illumina Hiseq2500 platform (Illumina, San Diego, CA, USA) according to the manufacturer's protocols to generate tagged 100 base pair (bp) paired-end reads.
SNP analysis
For analysis of SNPs, the paired-end reads were mapped to the reference genome of S. Typhi CT18 (ref. 25), using SMALT (version 0.7.4; http://www.sanger.ac.uk/resources/software/smalt/). SNPs were identified as previously described14, using samtools mpileup26 and filtering with a minimum mapping quality of 30 and a quality ratio cutoff of 0.75 (ref. 24). SNPs located within phage regions, repetitive sequences or recombinant regions were excluded as previously described14, resulting in a final set of 22,143 chromosomal SNPs in an alignment length of 4,275,037 bp for the global collection of 1,831 S. Typhi isolates. An expanded alignment comprising 22,673 SNPs from S. Typhi isolates from the global collection (1,831) plus 99 traveller-associated UK isolates was generated using the same procedures as above. Pairwise SNP distances between isolates (that is, the number of core genome SNP loci at which pairs of isolates had discordant alleles) were extracted from each alignment i using the ape package27 for R (v3.2; function call: dist.dna(i,model="N",pairwise.deletion=T)).
Phylogenetic analyses
The maximum likelihood (ML) phylogenetic tree shown in Fig. 1 was built from the 22,143-SNP alignment of all 1,831 isolates using RAxML (version 7.8.6)28 with the generalized time-reversible model and a Gamma distribution to model site-specific rate variation (the GTR+γ substitution model; GTRGAMMA in RAxML). The tree was outgroup-rooted by including a pseudo-sequence comprising S. Paratyphi A alleles in the alignment. Support for the ML phylogeny was assessed via 100 bootstrap pseudo-analyses of the alignment data.
The backbone topology of the global ML tree, showing relationships between subclades (Fig. 1b), was recovered by randomly selecting one isolate from each subclade to retain, and removing all other tips from the tree (using drop.tips() in the ape package27 for R (v3.2)). A ML phylogenetic tree was also generated separately from 22,673 SNPs of S. Typhi isolates from the global collection (1,831) plus the 99 East London traveller-associated isolates, using the same procedures as above. All ML trees were visualized and annotated using Python (https://github.com/katholt/plotTree/#python-code).
Identification of phylogenetically informative clades and subclades
In addition to the whole-genome phylogenetic analysis outlined above, we investigated the population structure of the global S. Typhi collection using a phylogeny-free population genetics approach, implemented in BAPS v.6.0 (ref. 21). Hierarchal clustering analyses were conducted on identified clusters until single-member clusters were obtained, thus allowing the discovery of nested genetic population structures21. Ten nested levels of molecular variation were fitted to the data using 10 independent runs of the stochastic optimization algorithm with the a priori upper bound of the number of clusters varying over the interval 50–300 across the runs30.
As our goal was to identify genotypes that were both phylogenetically and epidemiologically informative, we explored the homogeneity (1-Simpson's diversity) of geographical source within BAPS clusters (as an indicator of the potential power of genotyping to identify geographical origin of travel-associated isolates) at different levels of clustering (Supplementary Fig. 5). This showed that within-cluster homogeneity increased up to the sixth level of clustering and then reached a plateau, with deeper clustering providing no greater resolution of geographical origin (Supplementary Fig. 5). The third level of clustering resulted in most clusters being dominated by a single continent (14/17 clusters with >80% of isolates from one continent), while sixth-level clustering resulted in most clusters containing isolates from a single country (60/89 clusters with >80% of isolates from one country; Supplementary Fig. 6). We therefore used the BAPS clusters to guide the definition of clades (BAPS level 3) and subclades (BAPS level 6).
In order to maintain compatibility with the phylogeny, some minor modifications of the raw BAPS clusters were required (this consisted of subdividing some BAPS clusters and merging others, but not reassigning members between clusters; see Supplementary Fig. 7). The modified level-3 BAPS clusters were designated ‘clades' and were assigned labels of the form [x].[y], where [x] indicates to which major cluster each clade belongs and [y] designates sister clades within each major cluster. The modified level-6 BAPS clusters were designated ‘subclades' and assigned labels of the form [x].[y].[z], where [x].[y] indicate to which clade each subclade belongs and [z] designates sister subclades within each clade. Thus, genotype names indicate relationships between genotypes; for example, 2.1.1 and 2.1.2 are sister subclades within clade 2.1, while 2.2.1 is a member of the distinct clade 2.2.
Some BAPS clusters were polyphyletic and consisted of isolates belonging to rare phylogenetic lineages whose common ancestor in the phylogenetic tree coincided with the common ancestor of an entire clade (n=9) or primary cluster (n=2). These groups contain isolates that, given increased numbers, may emerge as distinct BAPS clusters that form sister taxa within the parent clade (or primary cluster), and were thus designated [z]=0 (or [y]=0) to indicate non-equivalence with the properly differentiated sister clades (n=16) or subclades (n=49). For example, while the genotypes 2.1 and 2.2 represent distinct sister clades that are each monophyletic, isolates assigned to 2.0 are paraphyletic and include multiple lineages that could not be further subdivided by BAPS analysis (Supplementary Fig. 7).
Subclade 4.3.1, which is the only subclade of Clade 4.3, corresponds to the group referred to as H58, based on the haplotyping scheme of Roumagnac et al. in which it is defined by the presence of a single SNP glpA-C1047T (position 2,348,902 in S. Typhi CT18, BiP33 (ref. 7)). BAPS clustering at any level could not further subdivide subclade 4.3.1 (H58).
SNP-based genotyping
We identified a minimum set of 68 SNPs with which to rapidly genotype S. Typhi into the 16 clades and 49 subclades, as described above (Supplementary Table 2). Short read alignment (BAM) files, generated by mapping Illumina reads to the CT18 reference genome (accession AL513382), were used to assign genotypes for each novel read set using a custom Python script (available at https://github.com/katholt/genotyphi). Briefly, the script uses samtools mpileup to extract from each BAM file the consensus base calls at the SNP loci. The resulting variant call format file is then processed to identify the presence of cluster-, clade- and/or subclade-defining SNP alleles (defined in Supplementary Table 2) that pass a minimum quality threshold (default consensus base Phred score ⩾20) and uses these to assign the read set to a cluster, clade and subclade. Discriminatory power was calculated using the method outlined in ref. 31.
Data availability
Raw sequence data are available in the European Nucleotide Archive under accession ERP001718. Supplementary Data 1 lists accession numbers for each isolate. The software for Microreact interactive tree viewer is available at: http://microreact.org/project/styphi22. SMALT is available at: http://www.sanger.ac.uk/resources/software/smalt/. Python script to visualize and annotate trees is available at https://github.com/katholt/plotTree/#python-code. Python script to call SNPs is downloadable at https://github.com/katholt/genotyphi.
Disclaimer
The findings and conclusions contained within this publication are those of the authors and do not necessarily reflect positions or policies of the Bill and Melinda Gates Foundation, and the content do not necessarily represent the official views of the National Institutes of Health. The funders had no role in study design, data collection and analysis, decision to publish or preparation of the manuscript.
Additional information
How to cite this article: Wong, V.K. et al. An extended genotyping framework for Salmonella enterica serovar Typhi, the cause of human typhoid. Nat. Commun. 7:12827 doi: 10.1038/ncomms12827 (2016).
Supplementary Material
Supplementary Figures 1-7, Supplementary Tables 1-2 and Supplementary References.
Acknowledgments
We thank the members of the Pathogen Informatics Team and the core sequencing teams at the Wellcome Trust Sanger Institute (Cambridge, UK). We are grateful to David Harris for his work in managing the sequence data. We also thank David Aanensen and Silvia Argimon for use of the data visualization tool Microreact.
This work was supported by a number of organizations. The Wellcome Trust Sanger Institute authors were funded by Wellcome Trust Award #098051. V.K.W. was supported by the Wellcome Trust (#098051) and the National Institute of Health Research (NIHR) Cambridge Biomedical Research Centre (BRC). N.F. was supported by the Wellcome Trust Research Fellowship #WT092152MA. N.F., R.S.H. and this work were supported by a strategic award from the Wellcome Trust for the MLW Clinical Research Programme (#101113/Z/13/Z). C.P. was funded by The Wellcome Trust Mahidol University Oxford Tropical Medicine Research Programme, supported by the Wellcome Trust of Great Britain (Major Overseas Programmes—Thailand Unit Core Grant), the European Society for Paediatric Infectious Diseases and University of Oxford-Li Ka Shing Global Health Foundation. D.D., P.N. and V.D. were supported by the Wellcome Trust (core grant #089275/H/09/Z). Z.A.D. was supported by the Wellcome Trust (Strategic award #106158). K.E.H. was supported by the NHMRC of Australia (fellowship #1061409) and the Victorian Life Sciences Computation Initiative (VLSCI; grant #VR0082). C.A.M. was supported by a Clinical Research Fellowship from GlaxoSmithKline and PJH by a UK Medical Research Council PhD studentship. This work forms part of an EU FP7 Marie Curie Actions Industry Academia Partnerships and Pathways (IAPP) Consortium Programme, entitled GENDRIVAX (Genome-driven vaccine development for bacterial infections), involving the Wellcome Trust Sanger Institute, KEMRI Nairobi and Novartis Vaccines Institute for Global Health. The Institut Pasteur (IP) authors were funded by the IP, the Institut de Veille Sanitaire and by the French Government ‘Investissement d'Avenir' programme (Integrative Biology of Emerging Infectious Diseases Laboratory of Excellence, grant #ANR-10-LABX-62-IBEID). C.H.W. was supported by the UK Medical Research Council (MRC; #MR/J003999/1). C.O. was supported by Society in Science, The Branco Weiss Fellowship, administered by the ETH Zurich. A.K.C. was supported by the MRC (#G1100100/1). J.J. was supported by the antibiotic resistance surveillance project in DR Congo, funded by Project 2.01 of the Third Framework Agreement between the Belgian Directorate General of Development Cooperation and the Institute of Tropical Medicine, Antwerp, Belgium. F.M. was supported by a research grant from the Bill and Melinda Gates Foundation. J.A.C. was supported by the joint US National Institutes of Health-National Science Foundation Ecology and Evolution of Infectious Disease program (#R01 TW009237) and the UK Biotechnology and Biological Sciences Research Council (BBSRC; #BB/J010367/1), and by UK BBSRC Zoonoses in Emerging Livestock Systems awards #BB/L017679, #BB/L018926 and #BB/L018845. S.K. was supported by the NIH Grant Number R01 AI099525-02. S.B. is a Sir Henry Dale Fellow, jointly funded by the Wellcome Trust and the Royal Society (#100087/Z/12/Z). S.O. was supported by the National Institute Of Allergy And Infectious Diseases of the National Institutes of Health (#R01AI097493). C.D. was supported by the University of Oxford-Li Ka Shing Global Health Programme. A.E.M. was supported by a Biotechnology and Biological Sciences Research Council award (#BB/M014088/1). P.T. was supported by the Wellcome Trust of Great Britain (Major Overseas Programmes—Thailand Unit Core Grant) and University of Oxford-Li Ka Shing Global Health Foundation.
Footnotes
Author contributions Study design: V.K.W., S.B., K.E.H. and G.D. Sequencing data generation: A.J.P. and J.A.K. Data analysis: V.K.W., K.E.H., T.R.C., Z.A.D. and A.J.P. Isolate acquisition and processing and clinical data collection: D.J.P., S.B., N.F., N.R.T., F-X.W., P.J.H., N.T.V.T., R.F.B., C.H.W., S.K., M.G., R.S.H., J.J., O.L., W.J.E., C.M., J.A.C., M.K., K.J., S.D., F.M., J.C., C.T., S.O., C.A.M., C.D., K.H.K., A.M.S., C.M.P., A.K., E.K.M., J.I.C., S.D., B.B., M.D., D.B., T.N.T., S.P.S., M.H., P.N., R.S.O., L.I., D.D., V.D., G.T., L.W., J.A.C., E.D.P., S.N., E.J.N., D.P.T., P.T., S.S., M.V., J.P., K.D., G.H., J.F., J.D., R.H., N.M., A.S., M.M. and K.E.H. Manuscript writing: V.K.W., K.E.H. and G.D. All authors contributed to manuscript editing. Project oversight: K.E.H. and G.D.
Contributor Information
International Typhoid Consortium:
Julian Parkhill, Nicholas A. Feasey, Robert A. Kingsley, Nicholas R. Thomson, Jacqueline A. Keane, François- Xavier Weill, Simon Le Hello, Jane Hawkey, David J. Edwards, Simon R. Harris, Amy K. Cain, James Hadfield, Peter J. Hart, Nga Tran Vu Thieu, Elizabeth J. Klemm, Robert F. Breiman, Conall H. Watson, W. John Edmunds, Samuel Kariuki, Melita A. Gordon, Robert S. Heyderman, Chinyere Okoro, Jan Jacobs, Octavie Lunguya, Chisomo Msefula, Jose A. Chabalgoity, Mike Kama, Kylie Jenkins, Shanta Dutta, Florian Marks, Josefina Campos, Corinne Thompson, Stephen Obaro, Calman A. MacLennan, Christiane Dolecek, Karen H. Keddy, Anthony M. Smith, Christopher M. Parry, Abhilasha Karkey, Sabina Dongol, Buddha Basnyat, Amit Arjyal, E. Kim Mulholland, James I. Campbell, Muriel Dufour, Don Bandaranayake, Take N. Toleafoa, Shalini Pravin Singh, Mochammad Hatta, Paul N. Newton, David Dance, Viengmon Davong, Robert S. Onsare, Lupeoletalalelei Isaia, Guy Thwaites, Lalith Wijedoru, John A. Crump, Elizabeth De Pinna, Satheesh Nair, Eric J. Nilles, Duy Pham Thanh, Paul Turner, Sona Soeng, Mary Valcanis, Joan Powling, Karolina Dimovski, Geoff Hogg, Jeremy Farrar, Alison E. Mather, and Ben Amos
References
- Parry C. M., Hien T. T., Dougan G., White N. J. & Farrar J. J. Typhoid fever. N. Engl. J. Med. 347, 1770–1782 (2002). [DOI] [PubMed] [Google Scholar]
- Crump J. A. & Mintz E. D. Global trends in typhoid and paratyphoid Fever. Clin. Infect. Dis. 50, 241–246 (2010). [DOI] [PMC free article] [PubMed] [Google Scholar]
- Mogasale V. et al. Burden of typhoid fever in low-income and middle-income countries: a systematic, literature-based update with risk-factor adjustment. Lancet Global Health 2, e570–e580 (2014). [DOI] [PubMed] [Google Scholar]
- Sen B. et al. Phage typing, biotyping & antimicrobial resistance profile of Salmonella enterica serotype Typhi from Kolkata. Indian J. Med. Res. 125, 685–688 (2007). [PubMed] [Google Scholar]
- Kim S. et al. Clustering analysis of Salmonella enterica serovar Typhi isolates in Korea by PFGE, ribotying, and phage typing. Foodborne Pathog. Dis. 6, 733–738 (2009). [DOI] [PubMed] [Google Scholar]
- Dutta S. et al. Antimicrobial resistance, virulence profiles and molecular subtypes of Salmonella enterica serovars Typhi and Paratyphi A blood isolates from Kolkata, India during 2009-2013. PLoS ONE 9, e101347 (2014). [DOI] [PMC free article] [PubMed] [Google Scholar]
- Roumagnac P. et al. Evolutionary history of Salmonella Typhi. Science 314, 1301–1304 (2006). [DOI] [PMC free article] [PubMed] [Google Scholar]
- Baker S. et al. High-throughput genotyping of Salmonella enterica serovar Typhi allowing geographical assignment of haplotypes and pathotypes within an urban District of Jakarta, Indonesia. J. Clin. Microbiol. 46, 1741–1746 (2008). [DOI] [PMC free article] [PubMed] [Google Scholar]
- Holt K. E. et al. High-throughput sequencing provides insights into genome variation and evolution in Salmonella Typhi. Nat. Genet. 40, 987–993 (2008). [DOI] [PMC free article] [PubMed] [Google Scholar]
- Holt K. E. et al. Temporal fluctuation of multidrug resistant Salmonella Typhi haplotypes in the Mekong river delta region of Vietnam. PLoS Negl. Trop. Dis. 5, e929 (2011). [DOI] [PMC free article] [PubMed] [Google Scholar]
- Holt K. E. et al. High-throughput bacterial SNP typing identifies distinct clusters of Salmonella Typhi causing typhoid in Nepalese children. BMC Infect. Dis. 10, 144 (2010). [DOI] [PMC free article] [PubMed] [Google Scholar]
- Baker S. et al. Combined high-resolution genotyping and geospatial analysis reveals modes of endemic urban typhoid fever transmission. Open Biol. 1, 110008 (2011). [DOI] [PMC free article] [PubMed] [Google Scholar]
- Holt K. E. et al. Emergence of a globally dominant IncHI1 plasmid type associated with multiple drug resistant typhoid. PLoS Negl. Trop. Dis. 5, e1245 (2011). [DOI] [PMC free article] [PubMed] [Google Scholar]
- Wong V. K. et al. Phylogeographical analysis of the dominant multidrug-resistant H58 clade of Salmonella Typhi identifies inter- and intracontinental transmission events. Nat. Genet. 47, 632–639 (2015). [DOI] [PMC free article] [PubMed] [Google Scholar]
- Pham Thanh D. et al. Identification of Salmonella enterica serovar Typhi genotypes by use of rapid multiplex ligation-dependent probe amplification. J. Clin. Microbiol. 51, 2950–2958 (2013). [DOI] [PMC free article] [PubMed] [Google Scholar]
- Baltazar M. et al. Multidrug-resistant Salmonella enterica serotype Typhi, Gulf of Guinea Region, Africa. Emerg, Infect, Dis. 21, 655–659 (2015). [DOI] [PMC free article] [PubMed] [Google Scholar]
- Coll F. et al. A robust SNP barcode for typing Mycobacterium tuberculosis complex strains. Nat. Commun. 5, 4812 (2014). [DOI] [PMC free article] [PubMed] [Google Scholar]
- Morelli G. et al. Yersinia pestis genome sequencing identifies patterns of global phylogenetic diversity. Nat. Genet. 42, 1140–1143 (2010). [DOI] [PMC free article] [PubMed] [Google Scholar]
- Holmes A. et al. The utility of whole genome sequencing of Escherichia coli O157 for outbreak detection and epidemiological surveillance. J. Clin. Microbiol. 53, 3565–3573 (2015). [DOI] [PMC free article] [PubMed] [Google Scholar]
- Gardy J. L. et al. Whole-genome sequencing and social-network analysis of a tuberculosis outbreak. N. Engl. J. Med. 364, 730–739 (2011). [DOI] [PubMed] [Google Scholar]
- Corander J., Marttinen P., Siren J. & Tang J. Enhanced Bayesian modelling in BAPS software for learning genetic structures of populations. BMC Bioinformatics 9, 539 (2008). [DOI] [PMC free article] [PubMed] [Google Scholar]
- Aanensen D. M. et al. Whole-genome sequencing for routine pathogen surveillance in public health: a population snapshot of invasive Staphylococcus aureus in Europe. MBio 7, (2016). [DOI] [PMC free article] [PubMed] [Google Scholar]
- Public Health England. Health Protection Report: Enteric fever surveillance quarterly report (England, Wales and Northern Ireland): first quarter 2015 Infection reports, Volume 9 Number 16, Published on 8 May 2015.
- Croucher N. J. et al. Rapid pneumococcal evolution in response to clinical interventions. Science 331, 430–434 (2011). [DOI] [PMC free article] [PubMed] [Google Scholar]
- Parkhill J. et al. Complete genome sequence of a multiple drug resistant Salmonella enterica serovar Typhi CT18. Nature 413, 848–852 (2001). [DOI] [PubMed] [Google Scholar]
- Li H. et al. The sequence alignment/map format and SAMtools. Bioinformatics 25, 2078–2079 (2009). [DOI] [PMC free article] [PubMed] [Google Scholar]
- Paradis E., Claude J. & Strimmer K. APE: analyses of phylogenetics and evolution in R language. Bioinformatics 20, 289–290 (2004). [DOI] [PubMed] [Google Scholar]
- Stamatakis A. RAxML-VI-HPC: maximum likelihood-based phylogenetic analyses with thousands of taxa and mixed models. Bioinformatics 22, 2688–2690 (2006). [DOI] [PubMed] [Google Scholar]
- Corander J. & Tang J. Bayesian analysis of population structure based on linked molecular information. Math Biosci. 205, 19–31 (2007). [DOI] [PubMed] [Google Scholar]
- Casali N. et al. Evolution and transmission of drug-resistant tuberculosis in a Russian population. Nat. Genet. 46, 279–286 (2014). [DOI] [PMC free article] [PubMed] [Google Scholar]
- Hunter P. R. Reproducibility and indices of discriminatory power of microbial typing methods. J. Clin. Microbiol. 28, 1903–1905 (1990). [DOI] [PMC free article] [PubMed] [Google Scholar]
Associated Data
This section collects any data citations, data availability statements, or supplementary materials included in this article.
Supplementary Materials
Supplementary Figures 1-7, Supplementary Tables 1-2 and Supplementary References.
Data Availability Statement
Raw sequence data are available in the European Nucleotide Archive under accession ERP001718. Supplementary Data 1 lists accession numbers for each isolate. The software for Microreact interactive tree viewer is available at: http://microreact.org/project/styphi22. SMALT is available at: http://www.sanger.ac.uk/resources/software/smalt/. Python script to visualize and annotate trees is available at https://github.com/katholt/plotTree/#python-code. Python script to call SNPs is downloadable at https://github.com/katholt/genotyphi.