Abstract
We successfully determine the ranges of dielectric permittivity, cytoplasm conductivity, and specific membrane capacitance of mouse hippocampal neuronal and glial cells using dielectrophoresis (DEP) crossover frequency (CF). This methodology is based on the simulation of CF directly from the governing equation of a dielectric model of mammalian cells, as well as the measurements of DEP CFs of mammalian cells in different suspension media with different conductivities, based on a simple experimental setup. Relationships between the properties of cells and DEP CF, as demonstrated by theoretical analysis, enable the simultaneous estimation of three properties by a straightforward fitting procedure based on experimentally measured CFs. We verify the effectiveness and accuracy of this approach for primary mouse hippocampal neurons and glial cells, whose dielectric properties, previously, have not been accurately determined. The estimated neuronal properties significantly narrow the value ranges available from the literature. Additionally, the estimated glial cell properties are a valuable addition to the scarce information currently available about this type of cell. This methodology is applicable to any type of cultured cell that can be subjected to both positive and negative dielectrophoresis.
Keywords: Electric properties, Hippocampal neurons and glial cells, Dielectrophoresis (DEP), Crossover frequency, Fitting procedure
Introduction
Neuronal physical properties, along with cell interior and membrane electronic structures, have been investigated by various research groups to address cell physiological issues such as membrane voltage response and neuronal synaptic potential integration [1–4]. Based on a general passive cable model [5], a detailed neuronal electronic structure study was performed with CA1 and CA3 pyramidal neurons, CA3 interneurons and neocortical pyramidal neurons [1–4, 6, 7], where whole-cell patch recording was typically performed for model and property verification. In addition to theory and modeling, various experimental approaches have been applied to measure cell interior and membrane properties. For instance, a voltage patch clamp was utilized to directly measure neuronal membrane capacitance [8] and intracellular conductivity was determined from cell membrane electric breakdown [9]. Despite all these efforts, the dielectric properties of many mammalian cells have yet to be determined accurately because of the vast variety of cell types; the values of those that have been reported in the literature vary widely [1, 2, 8, 10]. Specifically, the determination of the dielectric properties of neurons and glial cells, for instance, will vastly facilitate the characterization, separation and manipulation of these cells and potentially, their stem cells [11, 12]. The comparison between the dielectric properties of neuronal and glial stem cells and their progenies opens another door to study the neural stem cell differentiation process [11, 12]. Additionally, the cellular separation and purification processes enable cell-specific studies such as neuronal action potential detection [13] and the isolation of circulating tumor cells (CTC) from blood cells [14].
Dielectrophoresis (DEP), as a label-free and flexible tool, has been widely used to characterize the electrical properties of not only the cell membrane but also the cell interior [15–17]. The ability to determine cell dielectric properties with DEP has been demonstrated previously by several research groups, such as Mahaworasilpa et al. [18], where a dielectrophoretic (DEP) force on single cells in AC electric fields was measured to analyze cell movement. In addition, the measurement of DEP crossover frequency (CF), namely the frequency occurring on the transition between positive DEP (cells attracted to the maximum electric field area) and negative DEP (cells repelled to the minimum electric field area), has been extensively applied by Pethig et al. [12, 17], Gascoyne et al. [19, 20], Voldman et al. [21, 22] and Gagnon et al. [15, 23], to characterize and separate multiple cell types.
In previously published research, while characterizing cell dielectric properties by measuring DEP CFs, in order to ensure the validity of different approaches and the accuracy of the results, detailed mathematical derivations, based on a particular dielectric model of cell, were usually given to relate the CF and the electrical properties of cells. For instance, the work reported by Pethig et al. [12, 17] and Gascoyne et al. [20, 24] determined the effective cell membrane capacitance from the slope of the plots of CF versus the medium conductivity based on a low-frequency (DC) approximation of Schwan [25], to represent the effective permittivity and conductivity of a cell. However, this DC approximation can only be applied when the CF measurement is performed in a medium with lower conductivity (e.g., <10−3 Sm−1), where the measured CF is sufficiently lower than the dispersion frequency (∼1 MHz) [26, 27], which is usually associated with the internal polarization between the cell membrane and cytoplasm. Furthermore, extended exposure to a low-conductivity medium often causes an ionic flux out of the cell membrane, which could compromise the cytoplasmic integrity [27]. Due to the considerations above, this approximation approach is not appropriate in some cases where DEP CF was measured to determine the dielectric properties of cells, unless more complicated models and a lower level of approximations are used.
In this work, we present a new approach to easily determine not only the membrane properties but also the cytoplasmic physical (primarily dielectric) properties of mammalian cells from DEP CF. We measure DEP CFs for cells in different suspension media with higher conductivity (with the addition of cell media) to ensure cell viability, based on a simple quadrupole electrode experimental setup. Instead of applying the low-frequency approximation, theoretical DEP CFs are determined directly from the governing equation of the Clausius–Mossotti factor, according to the protoplast model of a mammalian cell [28], for a variety of different suspension media. The ranges of the property parameters of neurons and glial cells are obtained by a straightforward fitting between theoretical CFs (based on certain cellular physical properties) and measured data. The best fit determines the estimated physical properties in question.
Materials and methods
Theoretical analysis
In order to investigate the interaction of biological cells with an external electric field, mammalian cells are often modeled (protoplast model) as a homogeneous conductive sphere enclosed by a very thin capacitive layer of a cell membrane [28, 29]. The conductive cell interior (cytoplasm) is characterized by dielectric permittivity ɛ c and ohmic conductivity σ c. The cell membrane serves as a low-loss capacitor, which has its effective capacitance per unit area c m.
Dielectrophoresis is a phenomenon in which a force is exerted on a dielectric particle (e.g., a biological cell) when it is subjected to a non-uniform electric field [30]. Cells can migrate towards the maximum of the electric field under positive dielectrophoresis (pDEP) or to the minimum of the electric field under negative dielectrophoresis (nDEP), depending on the relative dielectric and conductive properties of the cells and of the suspension medium. The DEP force on cells is governed by [28, 30]:
| 1 |
where r is the radius of cell, ɛ m is the dielectric permittivity of the surrounding medium, E is the external AC electric field and K is the real part of Clausius–Mossotti (C–M) factor K, which is frequency-dependent. Based on the protoplast dielectric cell model described above, the analytical expression of the C–M factor for mammalian cells in suspension medium is determined to be [28, 29]:
| 2 |
where ɛ m and σ m are the dielectric permittivity and ohmic conductivity of the surrounding medium respectively and ω is the electric field angular frequency. From Eq. (2), if we define A, B, C, and D as follows:
where
the expression of C–M factor K can be simplified as:
| 3 |
The sign of the real part of C–M factor Re[K] determines the type of DEP effect; a positive Re[K] leads to pDEP and a negative value causes nDEP. Therefore, for cells in a suspension medium, the theoretical CF between pDEP and nDEP can be obtained by solving the equation:
| 4 |
which is further simplified as:
| 5 |
and
| 6 |
Finally, solving the quadratic equation of ω 2 will give the theoretical CF directly:
| 7 |
provided a ≠ b (ɛ c ≠ ɛ m), that is, the dielectric permittivities of the cell interior and suspension medium are not exactly the same. In the expressions of a, b, c and d, the dielectric permittivity of the suspension medium (ɛ m) is very close to the permittivity of water (80 ɛ o) [31, 32], where ɛ o is the permittivity of the vacuum and cell radius r and medium conductivity σ m can be experimentally measured. As a result, three cell dielectric properties, cytoplasm permittivity (ɛ c), cytoplasm conductivity (σ c) and membrane effective capacitance (c m), can be simultaneously determined. First, different cell dielectric property values are substituted into expression (7) to obtain CFs in different suspension media. We then apply a linear least squares regression in MATLAB (MathWorks, Inc., Natick, MA, USA) to fit theoretically calculated CFs (ω) and compare them with experimentally measured CFs. The theoretical CFs that are closest to the measurement data help determine optimal cell property values.
Cell and device preparation
Hippocampal cells were dissociated from embryonic (E18) mouse hippocampus tissue (BrainBits, LLC, Springfield, IL, USA) following a protocol described earlier, from which a neuron/glial cell mixture suspension is isolated. Briefly, the hippocampus tissue was treated with filtered papain (2 mg/ml) in a 30 °C water bath for 30 min, triturated using a P1000 micropipette in 2 ml Hibernate EB medium (BrainBits, LLC, Springfield, IL, USA) and harvested by centrifugation at 200 × g for 1 min. Hippocampal neurons and glial cells were enriched through the culture of the cell mixture, above, in neuron and glial specific growth media NbActiv1 and NbASTRO (BrainBits, LLC, Springfield, IL, USA), respectively, at 37 °C with 5% CO2. Purified neuronal and glial populations were harvested separately at 6 days in vitro (Div.), with 0.125% trypsin in Hibernate E-Ca (37 °C, 5 min) (BrainBits, LLC, Springfield, IL, USA), centrifuged at 200 × g for 5 min and resuspended in their own growth media, as described above. Cells were used immediately for DEP CF experimental measurement. Isolated cells were added into different mixed suspension media with a micropipette and DEP manipulation was performed after cells settled down on the device surface, as described in the following section. The osmolality values of different suspension media were measured using the Vapro®Vapor Pressure Osmometer 5600 (ELITech Group, Puteaux, France).
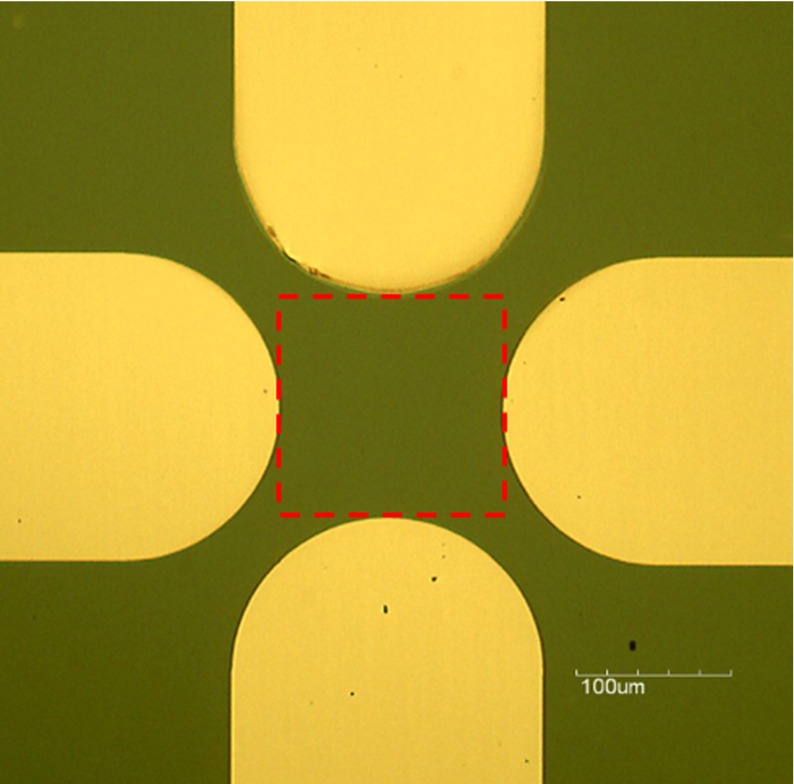
A quadrupole electrode array was fabricated by depositing 20 nm of titanium (Ti) followed by 80 nm of platinum (Pt) based on a silicon substrate (Fig. 1) and each electrode was connected to a metal pad (not shown in Fig. 1). During DEP experiments, AC sine-wave and ground signals were applied to every other metal pad, respectively, so that the local electric field maxima were created at the edge of the electrodes and the electric field minima were located at the central area. Initially, cells were positioned within the area indicated by the dashed square in Fig. 1. Cells will be attracted to the edge of the electrode under positive DEP and pushed to the center with negative DEP.
Fig. 1.
Quadrupole electrode array for cell crossover frequency measurement. Cells are initially positioned in the area indicated by the dashed square
DEP crossover experimental measurement
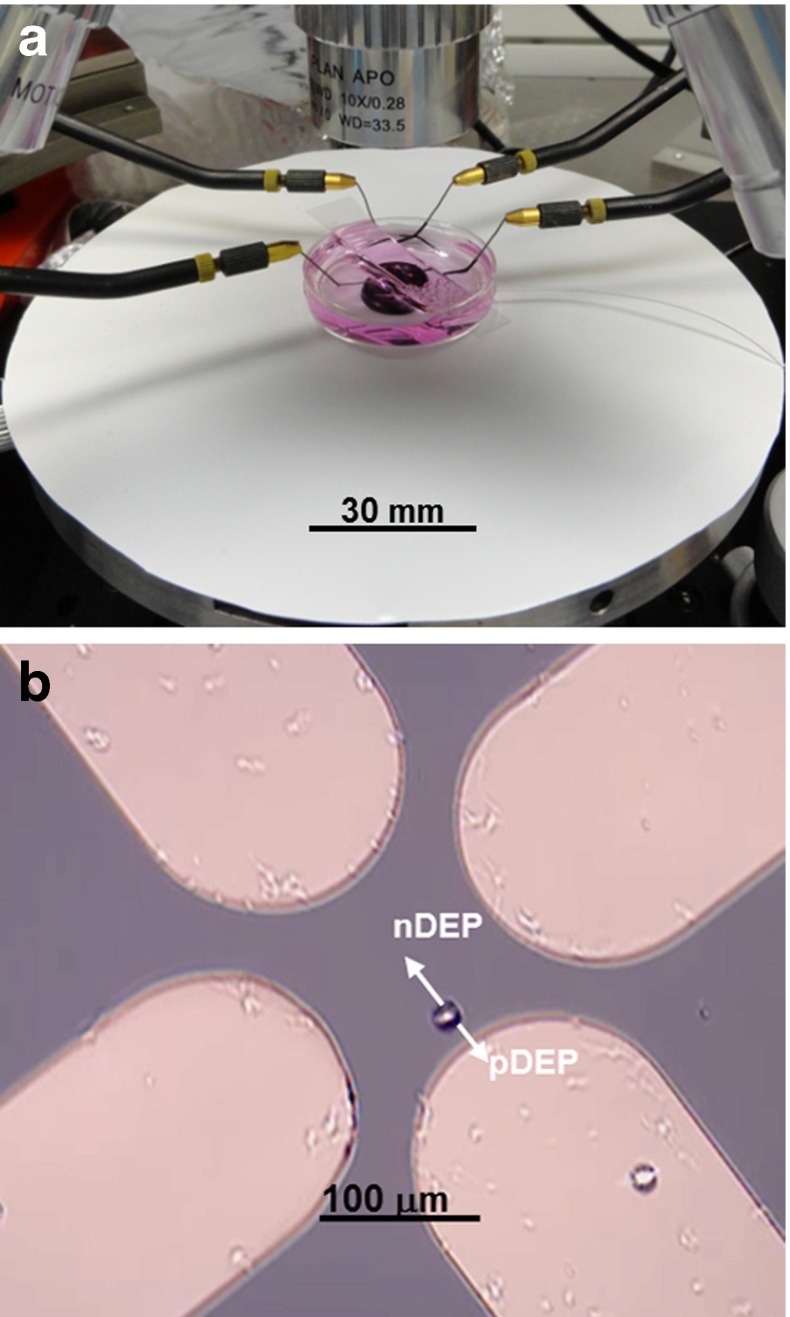
The quadrupole electrode array was attached on the bottom of a 35-mm Petri dish with polydimethylsiloxane (PDMS). The Petri dish was fixed on the stage of a probe station PM5 (SUSS Micro Tec. Garching bei München, Germany), with probe tips connected to the metal pads to deliver DEP electrical signals (5 Vpp), as can be seen in Fig. 2a. We implemented a cell suspension medium in the Petri dish for DEP manipulation, which was a mixture of 10% sucrose (w/v in deionized water) and primary neuron culture media NbActiv1 (BrainBits, LLC, Springfield, IL, USA) at different ratios. For instance, 30% cell media represents the cell suspension mixture consisting of seven parts of 10% sucrose (w/v in deionized water) and three parts of NbActiv1 culture media. Neuron culture media were added to improve the survival of cells in the medium, as the suspension mixture has higher conductivity and growth nutrients for cells. The conductivity of these suspension media, σ m, was measured by the EC410 Conductivity/TDS/Salinity Kit (EXTECH Instruments, Inc., Waltham, MA, USA). Average cell radius r was measured on 30 suspended cells settled on the bottom of a Petri dish in each suspension medium, by digital microscopy software, Motic Images Plus 2.0, on a PSM-1000 microscope (Motic Group CO., LTD., Xiameng, China). AC electric signals were provided by a function generator (Agilent 33521A, Agilent Technologies, Inc., Wilmington, DE, USA).
Fig. 2.
a Experimental setup for DEP crossover measurement on a probe station. A glass cover slide above the Petri dish is used to stabilize the fluidic surface for better visualization under a microscope. The scale bar is applied towards the surface of the microscope station. b Video frame showing a cell under DEP manipulation
DEP crossover measurement was performed in different mixed suspension media after isolated hippocampal neurons or glial cells settled down in the area indicated by the dashed square in Fig. 1. In each suspension medium, the frequencies at which cells were trapped at the edge of electrodes (pDEP in action) and repelled to the center (nDEP in action), were observed and measured (Fig. 2b). For each suspension medium, five cells were measured within a 10 min (total) time window. Fresh isolated cell samples were prepared for measurement in each suspension medium. During experiments, there was a frequency range close to the crossover where the DEP effect was too weak to observe because of the small Clausius–Mossotti (C–M) factor (Re[K] close to zero). The start and end of this frequency range (combining the extremes of the frequency ranges measured on five cells in each suspension medium) were recorded as ‘Experimental Low’ and ‘Experimental High’ in Table 1 and the average of these two values was considered the measured CF. Cell property value fitting according to measured CFs was performed with MATLAB (MathWorks, Inc., Natick, MA, USA), as described below.
Table 1.
Experimentally measured crossover frequencies for hippocampal neurons and glial cells
| Cell media ratio in cell suspension mixture (%) | |||||
|---|---|---|---|---|---|
| 0.1% | 1% | 10% | 20% | 30% | |
| Hippocampal neurons | |||||
| Experimental low (kHz) | 5 | 60 | 300 | 600 | 1500 |
| Experimental high (kHz) | 10 | 80 | 350 | 900 | 2000 |
| Averaged crossover (kHz) | 7.5 | 70 | 325 | 750 | 1750 |
| Glial cells | |||||
| Experimental low (kHz) | 2 | 20 | 150 | 400 | 2000 |
| Experimental high (kHz) | 5 | 40 | 250 | 600 | N/A |
| Averaged crossover (kHz) | 3.5 | 30 | 200 | 500 | N/A |
Results
DEP crossover measurement
The experimentally measured DEP CFs of hippocampal neurons and glial cells in different suspension media are listed in Table 1. Every measured data point was averaged from five cells, as described in the previous section. Notice for glial cells in the 30% cell media suspension mixture, negative DEP can be detected at frequencies up to 2 MHz (glial ‘Experimental Low’ in Table 1) but no DEP effect can be observed with higher frequencies. This measurement indicates that at higher frequency, the glial DEP effect is very weak because the real part of the C–M factor is very close to zero.
As can be seen in Table 1, with more cell media in the suspension mixture (higher conductivity), the accuracy resolution of the measured CF is lower; however, comparing the results published by Voldman et al. [21] and Gagnon et al. [33], we still have comparable accuracy resolution at the respected medium-conductivity level. In addition, in most of the suspension mixture, glial cells have lower CFs (from nDEP to pDEP) than neurons, suggesting that glial cells experience a positive DEP effect at lower frequencies than neurons. With different DEP devices to study neurons and astrocytes, Flanagan et al. [11] and Prasad et al. [34] found similar results in their work.
Hippocampal and glial properties from the literature
Before fitting theoretical CFs to experimental data, dielectric and physical properties of hippocampal neurons and glial cells were researched from previous studies, as shown in Table 2. For mouse hippocampal neurons, both cytoplasm conductivity σ c and membrane effective capacitance c m have a wide range of literature values, experimentally determined in closely related types of mouse neurons, such as mouse CA3 pyramidal neurons and interneurons [1, 2] and cortical rat neurons [10], as can be seen in Table 2. Neuronal cytoplasm permittivity ɛ c is set at 60 ɛ 0, based on literature values [35]. However, very limited information about glial cells is available in the literature. Here, we assume the cytoplasm permittivity of glial cells (60 ɛ 0) to be the same as that obtained for neurons. Glial cytoplasm conductivity was based on conductivity-related glial cell and tissue information [35–37] and the membrane effective capacitance was found in only one study [8].
Table 2.
Hippocampal neuron and glial properties from the literature
| Cytoplasm dielectric constant ɛ c/ɛ 0 | Cytoplasm conductivity σ c (Sm−1) | Membrane effective capacitance c m (Fm−2) | |
|---|---|---|---|
| Hippocampal neuron | 60 [35] | 0.3–1.0 [1, 2, 10, 35] | 0.006–0.013 [1, 2, 8, 10, 35] |
| Glial Cell | 60a | 0.27–0.62 [35, 36, 37] | 0.0106 [8] |
aAssumed value
Pre-fitting analysis
In our previous study, simulations of DEP spectra (Re[K]) based on averaged property values of hippocampal neurons and glial cells from Table 2 were performed and the discrepancies between simulated and experimentally measured CFs demonstrated the need for more accurate cell property values. Therefore, property values within the literature ranges in Table 2 were evaluated using our estimating technique, which takes experimental CFs into account. For each item in Table 2, values around (larger and smaller than) the particular reference value were evaluated. The goal was to determine property values that gave a better fit between the theoretical CF and that which was experimentally measured.
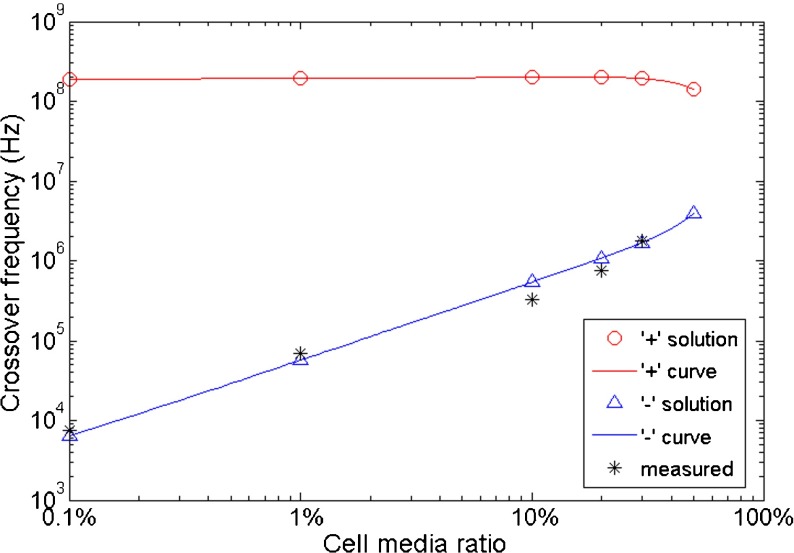
As can be seen in expression (7), there are two sets of solutions to the quadratic Eq. (6) of CF squared (ω 2), depending on the ‘+’ and ‘–’ signs. The DEP electric signals provided by the function generator have a maximum frequency of 30 MHz. To determine which CF solution of Eq. (6) is within our practically measurable frequency range, averaged property values from Table 2 for hippocampal neurons were fitted to select the reasonable theoretical CF (Fig. 3). Comparing the CFs calculated with the ‘+’ sign (red) and ‘–’ sign (blue) in Fig. 3, CFs solved with the ‘–’ sign represent the measured CFs (stars). As a result, theoretical CFs were calculated with the ‘–’ sign in expression (7) for the following discussions.
Fig. 3.
Comparison of theoretical CFs calculated with a ‘+’ sign (red) and a ‘–’ sign (blue) from expression (7). Black data points represent the measured CFs (stars). The property values of hippocampal neurons used in this calculation are: ɛ c/ɛ 0 = 60, σ c = 0.7 Sm−1, c m = 0.010 Fm−2, r = 4.3 μm
Property determination for hippocampal neurons
Mouse hippocampal neuronal cytoplasm dielectric constant ɛ c/ɛ 0, where ɛ o is the dielectric permittivity of a vacuum, cytoplasm conductivity σ c and membrane effective capacitance c m were evaluated respectively, according to experimentally measured CFs in different suspension media (see Fig. 4), using values obtained from the literature (values around a reference value, where available, or several different values, if a range has been reported). As described above, the dielectric permittivity of the suspension medium ɛ m is 80 ɛ o. In Table 3, we measured different suspension media conductivity values σ m, as well as the osmolality values of different suspension media. As can be seen, the osmolalities of all suspension media are very close and comparable to the physiological osmolality [38]. As a result, the measured cell sizes (radius) in different suspension media are very close to each other and we did not observe significant changes for the cell radius in various suspension media, as recorded in Table 3. We use an averaged cell radius from all these measurements (4.3 ± 0.42 μm) for both hippocampal neurons and glial cells, in the following discussions.
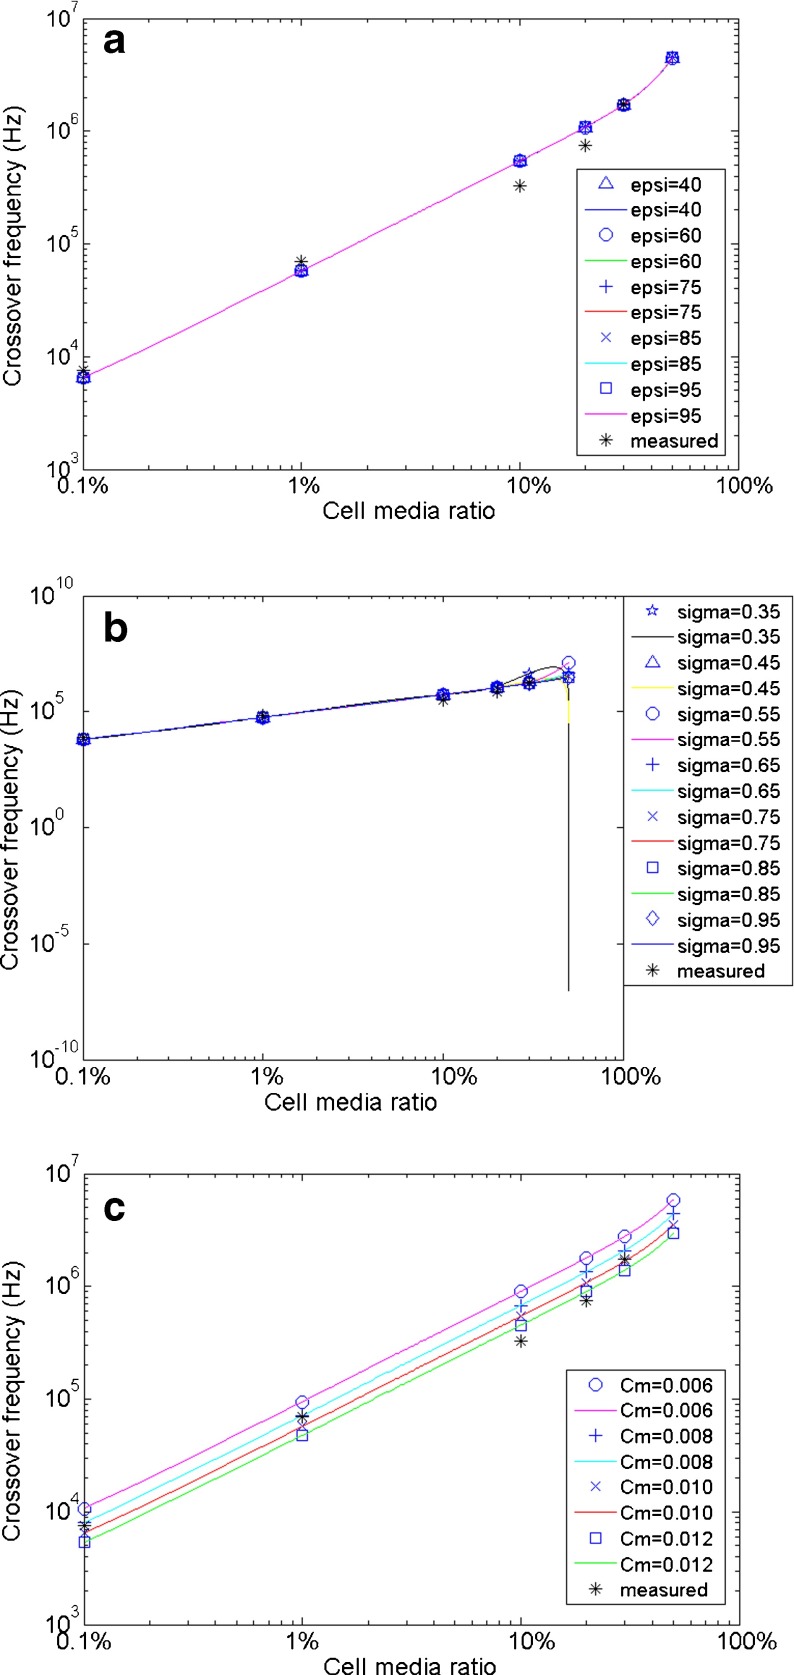
Fig. 4.
Dielectric property values for mouse hippocampal neurons based on values shown in Table 2 are evaluated, according to experimentally measured CFs. The theoretical CFs in 50% cell media are also calculated in each figure. One property is fit to the experimental values, whereas the other two values are fixed to the values described in each situation. a Cytoplasm dielectric constant values ɛ c/ɛ 0 = 40, 60, 75, 85, and 95 are fitted. Smaller values (40, 60) give a slightly better fit. (σ c = 0.65 Sm−1, c m = 0.010 Fm−2). b Cytoplasm conductivity values σ c = 0.35, 0.45, 0.55, 0.65, 0.75, 0.85 and 0.95 Sm−1 are fitted. Larger values (0.75–0.95) have a closer fit. (ɛ c/ɛ 0 = 60, c m = 0.010 Fm−2). c Membrane effective capacitance values c m = 0.006, 0.008, 0.01 and 0.012 Fm−2 are fitted. Larger values (0.01–0.012) provide a closer fit to measured CFs. (ɛ c/ɛ 0 = 60, σ c = 0.75 Sm−1)
Table 3.
Measured suspension medium conductivity
| Cell media ratio in mixture suspension (%) | |||||
|---|---|---|---|---|---|
| 0.1% | 1% | 10% | 20% | 30% | |
| Suspension medium conductivity σ m (Sm−1) | 1.254e-3 | 1.119e-2 | 0.111 | 0.221 | 0.331 |
| Osmolality (mmol/kg) | 352.6 ± 2.51 | 345.8 ± 3.42 | 329.8 ± 2.17 | 316.0 ± 3.00 | 300.8 ± 2.39 |
| Cell radius (μm) | 4.13 ± 0.395 | 4.29 ± 0.373 | 4.27 ± 0.376 | 4.44 ± 0.384 | 4.49 ± 0.483 |
When one property value is being evaluated, the other two are fixed during the procedure. The fixed property values are picked from optimal values already determined through the fitting procedure, if available, or from the average literature values in Table 2. Optimal property values were determined based on the fitted curves that are closest to the measured data. The theoretical CFs in 50% cell media are also calculated for each subfigure in Fig. 4; however, it is not possible to measure the definite crossover range in 50% cell media because both the pDEP and nDEP effects are very weak around the crossover and therefore the exact CF is very difficult to determine.
For evaluation of hippocampal neuronal cytoplasm dielectric constant (ɛ c/ɛ 0), different selected property values do not significantly affect the theoretical CFs; as shown in Fig. 4a, most of the fitted data and curves overlap each other. However, we did find that smaller values give a slightly closer fit to the experimentally measured data (calculated CF data not shown here). As a result, the literature value of approximately 60 is reasonable for hippocampal neurons.
Selected values within the literature range of cytoplasm conductivity σ c were fit to experimentally measured values in Fig. 4b. As can be seen, greater conductivity values (0.75–0.95 Sm−1) have a better theoretical CF fit in 20% and 30% cell media suspension mixture but the fitted points in the lower cell media suspension mixture do not change substantially. These changes in CFs, therefore, may not be well represented, if only studied in a medium with lower conductivity. Smaller cytoplasmic conductivity (0.45 Sm−1) makes the CF disappear (complex number) in 50% cell media, as indicated by the data point in the lower-right corner. Thus, the cytoplasm conductivity σ c of hippocampal neurons is closer to the higher end (0.75–1.0 Sm−1) of the literature-value range.
For membrane effective capacitance c m, greater property values provide a closer fit to the measured CFs (see Fig. 4c). Compared to literature-averaged 0.01 Fm−2, we believe the membrane effective capacitance c m of hippocampal neurons is located at the higher end (0.01–0.012 Fm−2) of the literature range.
Property determination for glial cells
With the same methodology applied for mouse hippocampal neurons above, the dielectric properties of glial cells derived from the literature were also evaluated by our method (Fig. 5).
Fig. 5.
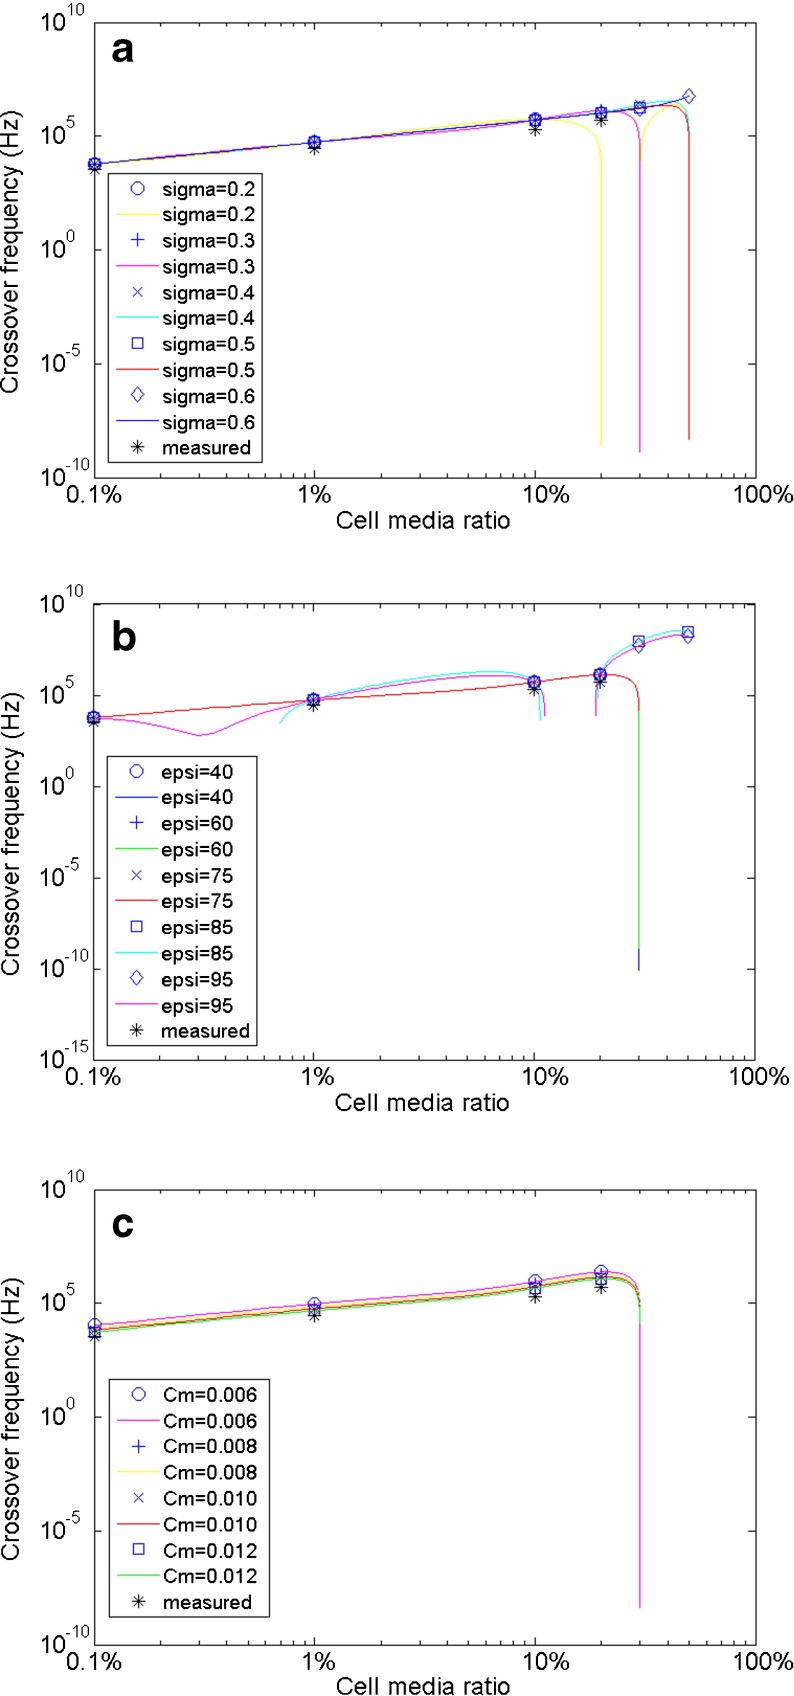
Dielectric property values for mouse hippocampal glial cells given in Table 2 are evaluated according to experimentally measured CFs. One property is fit to the experimental values, whereas the other two values are fixed to the values described in each situation. a Cytoplasm conductivity values σ c = 0.2, 0.3, 0.4, 0.5 and 0.6 Sm−1 are fitted. Only values σ c ≥ 0.3 will generate CFs in 20% cell media solution. (ɛ c/ɛ 0 = 60, c m = 0.0106 Fm−2). b Cytoplasm dielectric constant values ɛ c/ɛ 0 = 40, 60, 75, 85 and 95 are fitted. Smaller values have a slightly closer fit. (σ c = 0.3 Sm−1, c m = 0.0106 Fm−2). c Membrane effective capacitance values c m = 0.006, 0.008, 0.01, and 0.012 Fm−2 are fitted. Larger values (0.01–0.012) give a closer fit to measured data. (ɛ c/ɛ 0 = 60, σ c =0.3 Sm−1)
From the evaluation of cytoplasm conductivity σ c (see Fig. 5a), it is determined that smaller values (0.2 Sm−1) only give CFs in suspension medium with up to 10% cell media; in 20% and 30% cell media solution, no CFs are generated (complex numbers). These complex values are indicated by data points at the lower-right corner because only the real parts of complex numbers were plotted in MATLAB. A CF is generated in 20% cell media solution if σ c = 0.3 Sm−1, whereas greater values for σ c (0.4, 0.5 Sm−1) also have CFs in 30% cell media solution. Experimentally, CFs are successfully measured in suspension medium with up to 20% cell media. However, in 30% cell media solution, the DEP effect is very weak at higher frequencies. Based on this, we conclude that the cytoplasm conductivity σ c of glial cells should be between 0.3 and 0.4 Sm−1, as demonstrated further in the following DEP spectra (Re[K]) simulation (Fig. 7). Therefore, σ c = 0.3 Sm−1 was applied for the evaluations of the other two properties.
Fig. 7.
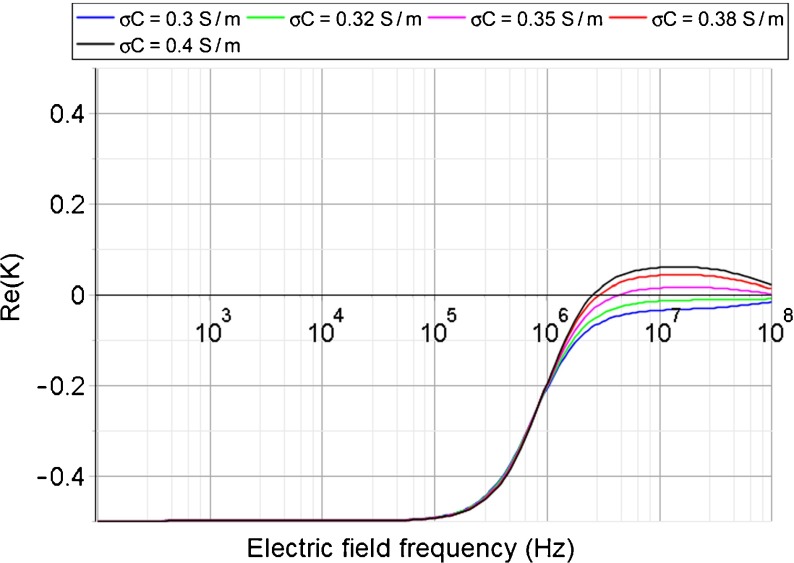
Maple simulation of DEP spectra for glial cells. Different cytoplasm conductivity σ c fit in 30% cell media solution
As the cytoplasm dielectric constant (ɛ c/ɛ 0) of glial cells is evaluated (Fig. 5b), we find that greater values (85: squares, 95: diamond) produce unreasonably high CFs in 30% and 50% cell media solution, which cannot be experimentally confirmed. Although no CF (complex number) is created in 30% and 50% cell media solution, smaller values (40: circles, 60: crosses and 75: diagonal crosses) give CFs that are very comparable to the four measured data points (see Fig. 5b). It is also noticed that the theoretical values are slightly closer to measured data if smaller property values are used (data not shown here). Therefore, the cytoplasm dielectric constant of glial cells is believed to be at the lower end (≤60).
For glial membrane effective capacitance c m, the estimation results are similar to those of hippocampal neurons. Greater c m values have a closer fit to the experimentally measured CFs and the complex numbers in 30% and 50% cell media solution are not considered. The literature data of 0.0106 Fm−2 is reasonable, as it is very close to our estimation range for c m, which is 0.011–0.013 Fm−2.
Discussion
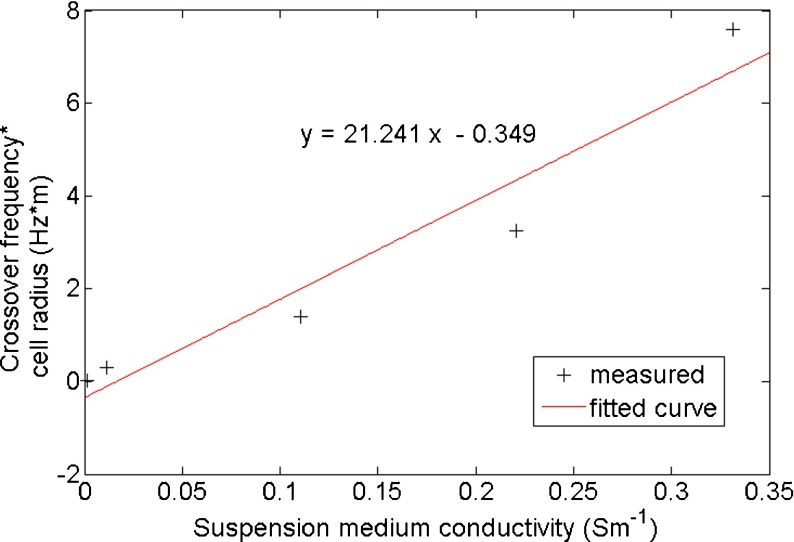
According to Lei et al. [26], the slope of the linear relationship between the product of CF and cell radius (f ⋅ r) and medium conductivity (σ m) predicts the reverse of cell membrane effective capacitance (c m), under certain conditions. Using our measured hippocampal neuronal CF data, a similar plot can be generated, as can be seen in Fig. 6. In Fig. 6, the fitted linear equation has a slope of 21.241, which, based on [26], satisfies the following expression:
Fig. 6.
Linear fitting of (f ⋅ r) against σ m, based on data from Fig. 4c and the formula in [26], predicts cell membrane effective capacitance well within our suggested range, verifying the accuracy of our fitting procedure
Therefore, the cell membrane effective capacitance (c m) obtained using this approach is 0.0106 Fm−2. This value is well within the range we predicted in Fig. 4c, verifying the accuracy of using our fitting procedure to determine the cell membrane effective capacitance.
The CF of glial cells in 30% cell media solution could not be determined experimentally because the DEP effect is very weak at higher frequencies (>2 MHz), as mentioned before. Considering this observation, DEP spectra (Re[K]) of glial cells in 30% cell media solution were simulated with Maple (Maplesoft Inc., Waterloo, Canada), using cytoplasm conductivity (σ c) values from the determined range (0.3–0.4 Sm−1) above (see Fig. 7). As shown, compared with other values, σ c of 0.32 Sm−1 (green) and 0.35 Sm−1 (magenta) create the preferable curves at higher frequencies because they are closer to the zero-value base line and the resulting absolute values of Re[K] are smaller, and consequently, so is the DEP effect. Although the magenta data line has a crossover point and the green data line does not, they both represent possible situations. Additionally, glial cells have a nDEP effect at 2 MHz on both the green and magenta data lines, confirming the experimental observations.
From Table 3, most of the conductivity of the suspension mixture is magnitudes higher than that of DEP buffers previously used [11, 14, 21, 24, 26, 27] because of the addition of cell culture media, which compromises the validity of the low-frequency approximation, as mentioned earlier. In order to ensure the survival of cells in these suspension mixtures, we investigated the viability of hippocampal cells in the most severe situation (only 10% sucrose). Sufficiently high viability (87%) was achieved for hippocampal cells after short-term (30 min) exposures to sucrose, compared with the control sample (88%) in pure cell culture media. Details about the hippocampal viability measurement can be found in our previous work [39, 40].
With these considerations in mind, in Table 4 we have summarized the range of three dielectric and physical properties of mouse hippocampal neurons, as well as of glial cells, determined in this work. As can be seen in Table 4, compared with original cell property values from literature (Table 2), the newly determined values are more reasonable and closer to previously published cell dielectric properties characterized with DEP [35].
Table 4.
Dielectric properties of hippocampal neurons and glial cells determined in this work
| Cytoplasm dielectric constant ɛ c/ɛ 0 | Cytoplasm conductivity σ c (Sm−1) | Membrane effective capacitance c m (Fm−2) | |
|---|---|---|---|
| Hippocampal neurons | ≤60 | 0.75–0.95 | 0.01–0.012 |
| Glial cells | ≤60 | 0.35a | 0.012a |
aParameter is determined to be close to this value
In conclusion, the range of dielectric properties of mouse hippocampal neurons and glial cells, specifically cytoplasm permittivity, cytoplasm conductivity, and membrane effective capacitance, are easily determined from dielectrophoresis crossover frequencies. Theoretical CFs are obtained directly from the governing equation of the Clausius–Mossotti factor. The range of property values is determined by a fitting procedure, comparing theoretical and experimentally measured DEP CFs, which are obtained from a simple quadrupole electrode setup. Cell properties determined here provide valuable additional information to the current body of knowledge. While selected types of cells are experimentally verified here, this methodology can be applied to a wide variety of cells.
Acknowledgments
This work was funded by The National Science Foundation (NSF) through grant NSF ECCS-1321356.
Contributor Information
Tianyi Zhou, Phone: +1 610 758 4552, Email: tiz209@lehigh.edu.
Svetlana Tatic-Lucic, Phone: +1 610 758 4552, Email: svt2@lehigh.edu.
References
- 1.Chitwood RA, Hubbard A, Jaffe DB. Passive electrotonic properties of rat hippocampal CA3 interneurones. J. Physiol. 1999;515(3):743–756. doi: 10.1111/j.1469-7793.1999.743ab.x. [DOI] [PMC free article] [PubMed] [Google Scholar]
- 2.Major G, Larkman AU, Jonas P, Sakmann B, Jack JB. Detailed passive cable models of whole-cell recorded CA3 pyramidal neurons in rat hippocampal slices. J. Neurosci. 1994;14(8):4613–4638. doi: 10.1523/JNEUROSCI.14-08-04613.1994. [DOI] [PMC free article] [PubMed] [Google Scholar]
- 3.Mainen ZF, Carnevale NT, Zador AM, Claiborne BJ, Brown TH. Electrotonic architecture of hippocampal CA1 pyramidal neurons based on three-dimensional reconstructions. J. Neurophysiol. 1996;76(3):1904–1923. doi: 10.1152/jn.1996.76.3.1904. [DOI] [PubMed] [Google Scholar]
- 4.Carnevale NT, Tsai KY, Claiborne BJ, Brown TH. Comparative electrotonic analysis of three classes of rat hippocampal neurons. J. Neurophysiol. 1997;78(2):703–720. doi: 10.1152/jn.1997.78.2.703. [DOI] [PubMed] [Google Scholar]
- 5.Rall W. Theory of physiological properties of dendrites. Ann. N. Y. Acad. Sci. 1962;96:1071–1092. doi: 10.1111/j.1749-6632.1962.tb54120.x. [DOI] [PubMed] [Google Scholar]
- 6.Miles R. Synaptic excitation of inhibitory cells by single CA3 hippocampal pyramidal cells of the guinea-pig in vitro. J. Physiol. 1990;428:61–77. doi: 10.1113/jphysiol.1990.sp018200. [DOI] [PMC free article] [PubMed] [Google Scholar]
- 7.Traub RD, Miles R. Pyramidal cell-to-inhibitory cell spike transduction explicable by active dendritic conductances in inhibitory cell. J. Comput. Neurosci. 1995;2(4):291–298. doi: 10.1007/BF00961441. [DOI] [PubMed] [Google Scholar]
- 8.Gentet LJ, Stuart GJ, Clement JD. Direct measurement of specific membrane capacitance in neurons. Biophys. J. 2000;79:314–320. doi: 10.1016/S0006-3495(00)76293-X. [DOI] [PMC free article] [PubMed] [Google Scholar]
- 9.Pilwat G, Zimmermann U. Determination of intracellular conductivity from electrical breakdown measurements. Biochim. Biophys. Acta. 1985;820:305–314. doi: 10.1016/0005-2736(85)90125-7. [DOI] [PubMed] [Google Scholar]
- 10.Heida T, Rutten WLC, Marani E. Dielectrophoretic trapping of dissociated fetal cortical rat neurons. IEEE Trans. Biomed. Eng. 2001;48(8):921–930. doi: 10.1109/10.936368. [DOI] [PubMed] [Google Scholar]
- 11.Flanagan LA, Lu J, Wang L, Marchenko SA, Jeon NL, Lee AP, Monuki ES. Unique dielectric properties distinguish stem cells and their differentiated progeny. Stem Cells. 2008;26(3):656–665. doi: 10.1634/stemcells.2007-0810. [DOI] [PubMed] [Google Scholar]
- 12.Pethig R, Menachery A, Pells S, Sousa PD. Dielectrophoresis: a review of applications for stem cell research. J. Biomed. Biotechnol. 2010;2010:182581. doi: 10.1155/2010/182581. [DOI] [PMC free article] [PubMed] [Google Scholar]
- 13.Jaber FT, Labeed FH, Hughes MP. Action potential recording from dielectrophoretically positioned neurons inside micro-wells of a planar microelectrode array. J. Neurosci. Methods. 2009;182:225–235. doi: 10.1016/j.jneumeth.2009.06.013. [DOI] [PubMed] [Google Scholar]
- 14.Sano MB, Henslee EA, Schmelz E, Davalos RV. Contactless dielectrophoretic spectroscopy: examination of the dielectric properties of cells found in blood. Electrophoresis. 2011;32(22):3164–3171. doi: 10.1002/elps.201100351. [DOI] [PubMed] [Google Scholar]
- 15.Gagnon ZR. Cellular dielectrophoresis: applications to the characterization, manipulation, separation and patterning of cells. Electrophoresis. 2011;32:2466–2487. doi: 10.1002/elps.201100060. [DOI] [PubMed] [Google Scholar]
- 16.Morgan, H., Sun, T., Holmes, D., Gawad, S., Green, N.G.: Single cell dielectric spectroscopy. J. Phys. D Appl. Phys. 40, 61–70 (2007)
- 17.Pethig, R.: Dielectrophoresis: status of the theory, technology, and applications. Biomicrofluidics 4, 022811 (2010) [DOI] [PMC free article] [PubMed]
- 18.Mahaworasilpa TL, Coster HGL, George EP. Forces on biological cells due to applied alternating (AC) electric fields. I. Dielectrophoresis. Biochim. Biophys. Acta. 1994;1193:118–126. doi: 10.1016/0005-2736(94)90340-9. [DOI] [PubMed] [Google Scholar]
- 19.Gascoyne P, Pethig R, Satayavivad J, Becker FF, Ruchirawat M. Dielectrophoretic detection of changes in erythrocyte membranes following malarial infection. Biochim. Biophys. Acta. 1997;1323:240–252. doi: 10.1016/S0005-2736(96)00191-5. [DOI] [PubMed] [Google Scholar]
- 20.Vykoukal DM, Gascoyne PR, Vykoukal J. Dielectric characterization of complete mononuclear and polymorphonuclear blood cell subpopulations for label-free discrimination. Integr. Biol. 2009;1(7):477–484. doi: 10.1039/b906137a. [DOI] [PubMed] [Google Scholar]
- 21.Vahey MD, Voldman J. An equilibrium method for continuous-flow cell sorting using dielectrophoresis. Anal. Chem. 2008;80:3135–3143. doi: 10.1021/ac7020568. [DOI] [PubMed] [Google Scholar]
- 22.Vahey MD, Voldman J. High-throughput cell and particle characterization using isodielectric separation. Anal. Chem. 2009;81(7):2446–2455. doi: 10.1021/ac8019575. [DOI] [PMC free article] [PubMed] [Google Scholar]
- 23.Gagnon Z, Gordon J, Sengupta S, Chang H-C. Bovine red blood cell starvation age discrimination through a glutaraldehyde-amplified dielectrophoretic approach with buffer selection and membrane cross-linking. Electrophoresis. 2008;29:2272–2279. doi: 10.1002/elps.200700604. [DOI] [PubMed] [Google Scholar]
- 24.Gascoyne PRC, Shim S, Noshari J, Becker FF, Stemke-Hale K. Correlations between the dielectric properties and exterior morphology of cells revealed by dielectrophoretic field-flow fractionation. Electrophoresis. 2013;34:1042–1050. doi: 10.1002/elps.201200496. [DOI] [PMC free article] [PubMed] [Google Scholar]
- 25.Schwan HP. Electrical properties of tissue and cell suspensions. Adv. Biol. Med. Phys. 1957;5:147–209. doi: 10.1016/B978-1-4832-3111-2.50008-0. [DOI] [PubMed] [Google Scholar]
- 26.Lei U, Sun P-H, Pethig R. Refinement of the theory for extracting cell dielectric properties from dielectrophoresis and electrorotation experiments. Biomicrofluidics. 2011;5(4):44109–4410916. doi: 10.1063/1.3659282. [DOI] [PMC free article] [PubMed] [Google Scholar]
- 27.Huang Y, Wang XB, Becker FF, Gascoyne PRC. Membrane changes associated with the temperature-sensitive P85gag-mos-dependent transformation of rat kidney cells as determined by dielectrophoresis and electrorotation. Biochim. Biophys. Acta. 1996;1282:76–84. doi: 10.1016/0005-2736(96)00047-8. [DOI] [PubMed] [Google Scholar]
- 28.Jones, T.B.: Electromechanics of Particles, pp. 34–81. Cambridge University Press, New York (1995)
- 29.Zhou, T., Tatic-Lucic, S.: On application of positive dielectrophoresis and microstructure confinement on multielectrode array with sensory applications. Proc. Sensors, IEEE, Taipei, 1–4 (2012)
- 30.Pohl, H.A.: Dielectrophoresis: the Behavior of Neutral Matter in Nonuniform Electric Fields. Cambridge University Press, New York (1978)
- 31.Yu Z, Xiang G, Pan L, Huang L, Yu Z, Xing W, Cheng J. Negative dielectrophoretic force assisted construction of ordered neuronal networks on cell positioning bioelectronic chips. Biomed. Microdevices. 2004;6(4):311–324. doi: 10.1023/B:BMMD.0000048563.58129.76. [DOI] [PubMed] [Google Scholar]
- 32.Huang Y, Wang XB, Becker FF, Gascoyne PR. Introducing dielectrophoresis as a new force field for field-flow fractionation. Biophys. J. 1997;73(2):1118–1129. doi: 10.1016/S0006-3495(97)78144-X. [DOI] [PMC free article] [PubMed] [Google Scholar]
- 33.Gagnon Z, Senapati S, Gordon J, Chang H-C. Dielectrophoretic detection and quantification of hybridized DNA molecules on nano-genetic particles. Electrophoresis. 2008;29:4808–4812. doi: 10.1002/elps.200800528. [DOI] [PubMed] [Google Scholar]
- 34.Prasad S, Zhang X, Yang M, Ni Y, Parpura V, Ozkan CS, Ozkan M. Separation of individual neurons using dielectrophoretic alternative current fields. J. Neurosci. Methods. 2004;135:79–88. doi: 10.1016/j.jneumeth.2003.12.007. [DOI] [PubMed] [Google Scholar]
- 35.Asami, K., Takahashi, Y., Takashima, S.: Dielectric properties of mouse lymphocytes and erythrocytes. Biochim. Biophys. Acta Mol. Cell. Res. 1010, 49–55 (1989) [DOI] [PubMed]
- 36.Peters, M., Stinstra, J., Leveles, I.: Modeling and imaging of bioelectrical activity principles and applications. In: He, B. (ed.) Bioelectric Engineering, pp. 281–319. Springer, New York (2005)
- 37.Okada YC, Huang J, Rice ME, Tranchina D, Nicholson C. Origin of the apparent tissue conductivity in the molecular and granular layers of the in vitro turtle cerebellum and the interpretation of current source-density analysis. J. Neurophysiol. 1994;72(2):742–753. doi: 10.1152/jn.1994.72.2.742. [DOI] [PubMed] [Google Scholar]
- 38.Wang, X.-B., Huang, Y., Gascoyne, P.R.C., Becker, F.F., Holzel, R., Pethig, R.: Changes in Friend murine erythroleukaemia cell membranes during induced differentiation determined by electrorotation. Biochim. Biophys. Acta Biomembr. 1193(2), 330–344 (1994) [DOI] [PubMed]
- 39.Zhou, T., Perry, S.F., Tatic-Lucic, S.: On combining the dielectrophoresis and microdevices: Investigation of hippocampal neuronal viability after implementing dielectrophoretic positioning on multi-electrode arrays. BIODEVICES 2015, Proceedings of the International Conference on Biomedical Electronics and Devices, Lisbon, Portugal, 71–77 (2015)
- 40.Zhou, T., Perry, S.F., Ming, Y., Petryna, S., Fluck, V., Tatic-Lucic, S.: Separation and assisted patterning of hippocampal neurons from glial cells using positive dielectrophoresis. Biomed. Microdevices 17(3), 9965 (2015). doi:10.1007/s10544-015-9965-6 [DOI] [PubMed]


