

Abstract
Recyclability is an important aspect for heterogeneous photo-catalysts. Ease of recovery and stability of the photo-catalyst in terms of efficiency over the number of cycles are highly desired and in fact it is ideal if the efficiency is constant and it should not decrease marginally with each cycle. Presented here is a seminal observation in which the photocatalytic activity is shown to improve with increasing number of catalytic cycles (it is 1.7 times better after the 1st cycle and 3.1 times better after the 2nd cycle). Specifically, nanorods of pure TiO2 and TiO2 doped with controlled amount of tungsten have been used to degrade two model pollutants: Phenol and Rhodamine B under exclusive visible light illumination. It was found that, in case of 1 mol.% W incorporation, rate of photocatalysis and also the range of visible light absorption of the photocatalyst increased after the photocatalysis as compared to before photocatalysis. This aspect is unique for doped TiO2 and hence provides an intriguing way to mitigate low photoactivity.
Finding easier and more economical ways of activating a diverse set of organic reactions has been the main-stay of a variety of researchers over the years. A catalyst is defined as an additive that lowers the activation energy, providing for a more energetically economical reaction pathway and ideally the catalyst returns to its starting chemical state without any deleterious effects. Photocatalyst is a material that is able to increase the rate of a reaction, however, only when specifically activated by either UV or visible electromagnetic radiation, generating holes and electrons which subsequently participate in oxidation and reduction reactions respectively1,2,3,4,5,6,7,8.
In terms of the choices of chemical composition for photocatalysis, TiO2 has always been the preferred material and used in a wide range of applications (ranging from catalysis,9,10,11,12 and as a component in photoanodes in solar cells13,14,15 to even as a scaffold in bone implants16). Among the common crystalline forms of titania, anatase is perceived as the more active phase because of its superior surface chemistry, more open framework, and better electron diffusion. This in turn leads to an enhancement in transport efficiency and higher band-gap17,18,19. Furthermore, in order to exploit TiO2 even more favorably and to induce improvements in rates of catalysis, (a) its morphology, (b) level of crystallinity and (c) bandgap tuning are some aspects that have been actively manipulated. One morphology, in addition to spherical nanoparticles, that has been oft-cited as being highly conducive for electron transport based applications is 1D nanostructures (nanowires, nanorods and/or nanotubes). These structures can demonstrate faster electron mobility since the direction is confined and they can also display higher sensitivity to the surface processes because of their large surface-to-volume ratio20,21,22,23,24. Improvement in crystallinity through synthesis has been pursued such that grain boundaries can be minimized (the presence of a large number of interfacial contacts, grain boundaries and a high density of deep electronic states below the conduction band of the TiO2 layer slow down the electron diffusion rates due to trapping and detrapping, as a result, these slow electrons are “lost” as their propensity to recombine increases). And finally doping of the chemical structure has been effectively practiced so as to improve the light harvesting capability of TiO2. Doping of TiO2 with transition metals and non-metals has been extensively studied25,26,27,28,29,30. The variation in absorption properties has been attributed to alteration of the electronic states and interestingly not in all cases does the photoactvity increase. There are many cases where in fact there is a decrease observed. This has been ascribed to the type and concentration of dopant employed and the manner in which it is incorporated in the lattice. Among the cations investigated, Tungsten doping has been showcased quite often due to the fact that the ionic radius is commensurate with Ti4+ (W(VI) in a tetrahedral environment has a radius of 56 pm which is the same as Ti(IV) in a tetrahedral environment)31,32,33,34. Tungsten with a stable 6 + oxidation state ideally should enable donation up to two extra electrons for every one dopant atom35. The ramification of this is that low dopant concentrations are sufficient and in fact are preferred as they lead to reduction in scattering of charge carriers.
Most importantly, an aspect of photocatalysis that normally does not get much recognition is recyclability (especially for heterogeneous catalysis)36,37,38,39. In fact, for a catalyst to be industrially viable, it must be able to withstand the reaction conditions repeatedly. The rates of reaction upon re-using the catalysts must not change dramatically (or at all in fact). It is commonly observed that heterogeneous catalysts undergo deactivation or loss in activity mainly due to catalytic poison. In designing a catalyst, ease of recovery and stability in terms of efficiency over the number of cycles are ideally highly desired properties. Normally, literature has emphasized the morphology as a crucial parameter in order to maintain catalytic efficacy over many cycles. Films are preferred as they are easily separated from the solution phase, however nanoparticles offer the highly desirable property of high surface area. Currently, although there are numerous reports on formation of novel photocatalysts and of these very few discuss their recyclability. The latter aspect is only showcased if the rate remains the same or there is a minimal decrease.
As a further to this, presented here is the facile synthesis of tungsten doped TiO2 nanorods. The manner of preparation of solely TiO2 rods has been adapted from a previous study from our lab where the facile synthesis of an air stable rod-like titanium glycerolate precursor has been developed using glycerol as both a solvent and chelating agent40. By calcining at elevated temperature in air, this glycerolate precursor is converted into the anatase phase of TiO2 without changing its original morphology. This is a simple environmental-friendly two-step approach without the use of any catalysts, templates, bases or acids. These rods have an aspect ratio that provides for a substantial surface area along with a particle size that provides for ease of recovery from the parent solution. Since the formation of TiO2 involves an isolable precursor stage, this methodology lends itself to a unique way of incorporating dopants. Hence we have endeavored to incorporate tungsten at various concentration levels into the precursor itself and then subsequently annealed the precursor to form W doped TiO2. Furthermore, these rods have been evaluated for enhanced visible light activity in degrading two separate model pollutants (phenol that is predominantly UV light absorbing and Rhodamine B that is a Visible light absorber) but most intriguingly their photo-catalytic efficiency has been found to be surprisingly improved when the catalyst is recycled.
Results
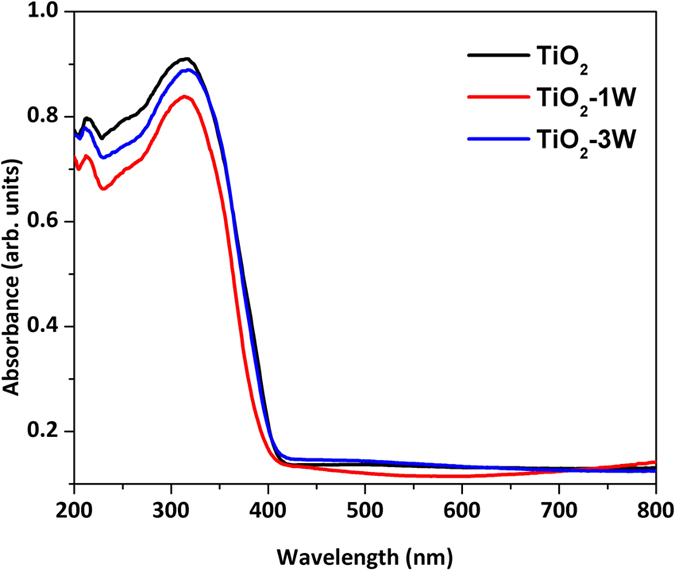
For the purposes of this study, 3 samples were prepared. Pure anatase phase of TiO2 nanorods, 1 mol.% Tungsten doped TiO2 and 3 mol.% Tungsten doped TiO2. These have been labeled in the subsequent sections simply as TiO2, TiO2-1W and TiO2-3W respectively. At this point it should be noted that higher loadings of Tungsten were also investigated (namely 5, 7 and 10 mol.%). However as their results were worse than the TiO2-3W, their data is not being detailed here. Room temperature PXRD patterns of the as synthesized TiO2 structures are shown in Fig. 1. It can be seen that all the three samples are anatase phase of TiO2 (JCPDS 21-1272) however at higher concentration of tungsten loading (3 mol.%) a minor phase of rutile starts appearing. There is absence of any other phases such as WO3 in the tungsten loaded samples. In terms of obtaining information regarding the level of crystallinity in the sample, FWHM (full width at half maximum) of two different lattice planes ((101) and (200)) was obtained by fitting a Gaussian curve to these peaks. The data are collated in Table 1 and it can be seen that TiO2-1W had the smallest FWHM for both the lattice planes, signifying relatively higher crystallinity than the other two samples. SEM data was collected on all the three samples, Fig. 2, and it can be seen that the morphology consists of rod like particles and this is retained even after incorporating 1 or 3 mol.% of tungsten in the synthesis. Average length of TiO2 sample was 220 ± 45 nm, while the average length of rods reduced as the W loading was increased, Table 1. The width of the rods however remained relatively constant. Also shown in Table 1 are the BET surface area values and it can be seen the values were not commensurate with the length of the rods. This is to say, the longest rods (pure anatase) had the BET surface area of ca. 61 m2/g. However TiO2-1W (with shorter rods) also had a smallest BET surface area. Intriguingly, TiO2-3W which had the shortest rods had the highest surface area of ca. 66 m2/g. This part could be attributed to the fact that an additional phase of rutile was observed in this TiO2-3W sample, as such this additional phase might not be rod-like and could consist of smaller particles (not resolvable in SEM), hence giving rise to an overall high surface area. Light absorption property of the samples was measured by Diffuse Reflectance Spectroscopy (DRS) which have been shown in Fig. 3. It can be observed that there is no significant change in absorption profile of the three samples after W loading. There is slight blue shift for the TiO2-1W sample however there is no subsequent variation for the TiO2-3W sample.
Figure 1. X-Ray diffraction patterns of the as-synthesized photocatalysts (i) TiO2,(ii) TiO2-1W and (iii) TiO2-3W.
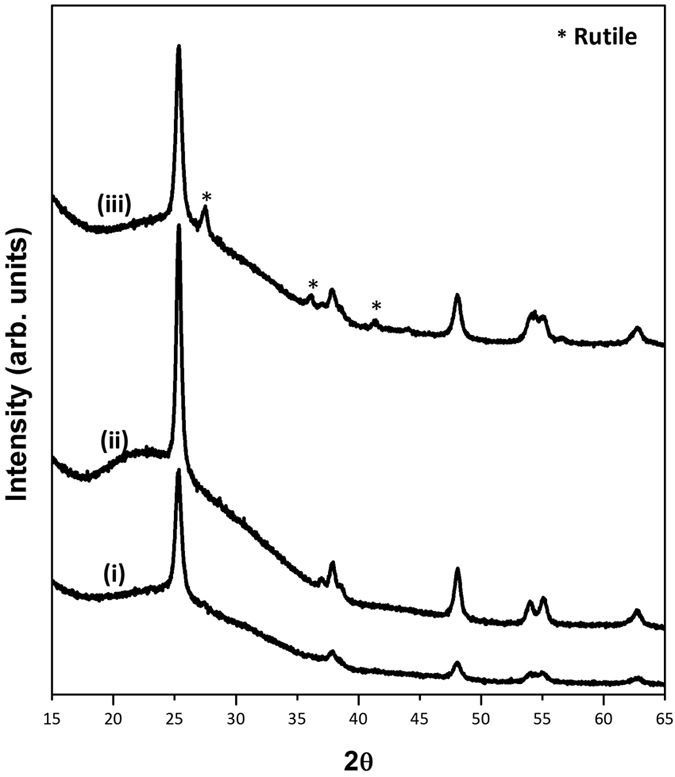
Table 1. For the as-synthesized catalysts, the FWHM (from XRD data), average size (from SEM data) and BET surface area values.
| Catalyst | FWHM Plane (101) | FWHM Plane (200) | Average Size (L × W nm) | BET Surface Area (m2/g) |
|---|---|---|---|---|
| TiO2 | 0.63 | 0.66 | 220 ± 45 × 19 ± 2 | 61 ± 0.4 |
| TiO2-1W | 0.51 | 0.58 | 178 ± 68 × 22 ± 6 | 48 ± 0.1 |
| TiO2-3W | 0.59 | 0.64 | 152 ± 22 × 16 ± 4 | 66 ± 0.2 |
Figure 2. SEM images of (A) TiO2,(B) TiO2-1W and (C) TiO2-3W. Scale bar = 200 nm.

Figure 3. Diffuse reflectance spectra of the three as-synthesized photocatalysts.
Photocatalysis
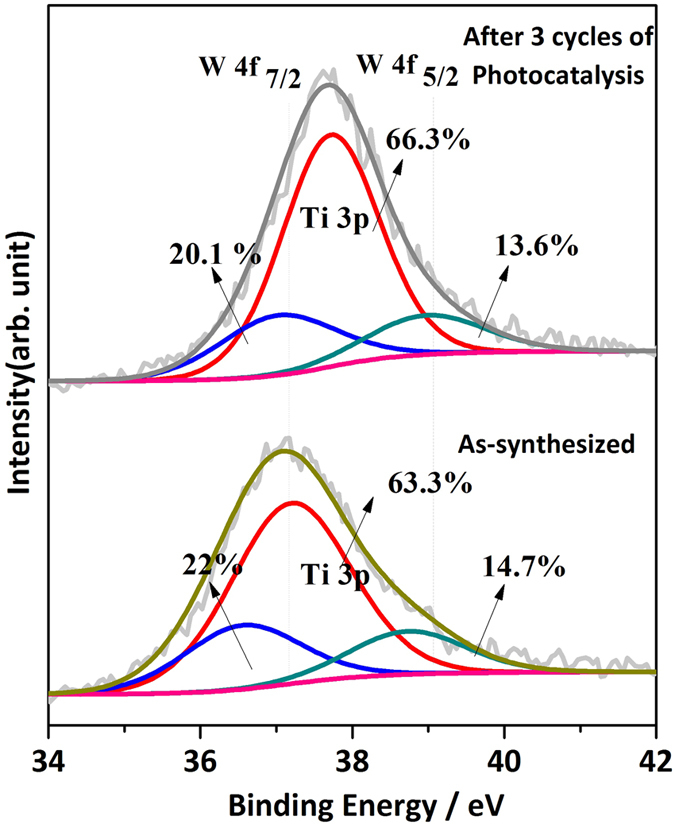
Effectiveness of these samples as photocatalysts was evaluated by performing a degradation experiment using two model pollutants: Rhodamine B and Phenol. For Rhodamine B, excitation of the catalyst was done using only visible light and the data is shown in supplementary information. For Phenol degradation, the samples were also exclusively irradiated with visible light (above 400 nm by using the appropriate long pass filter). Phenol was explicitly used so as to avoid sensitization effects as it has negligible absorption in the visible region hence it is evaluated in detailed here. Figure 4A displays the degradation profile of Phenol with reference to time for TiO2. Subsequent to this, recycling of the catalyst was performed whereby, after the 1st round of catalysis, the solid phase was recovered from the phenol solution and the catalyst washed twice with DI water by careful centrifugation at 10,000–14,000 RPM for 10 min. The sample was completely dried and then re-inserted into a fresh solution of phenol and the photocatalysis was redone. Three rounds of such photocatalysis were performed with the same batch of catalyst and in each case a fresh solution of phenol was used. All parameters were controlled as carefully as possible for each cycle (temperature, concentration ratio of catalyst to phenol, volume of solution used, light flux and distance from light source). Figure 4 displays the data as represented by the plot of Log(C/C0) vs. time for all the three samples and for all the three cycles. For TiO2 and TiO2-3W sample, it can be seen that the repeated cycling of the same sample leads to an eventual loss in activity and reaction rate, however intriguingly for TiO2-1W sample, there is a gradual increase in the rate upon each cycle. The rate constants were obtained using the assumption of a pseudo-1st order reaction rate and the data are compiled in Table 2 (note that the weight of the catalyst has been normalized in all the three rounds of catalysis). The recovered catalysts (after the three cycles were complete) were re-evaluated with XRD, SEM, BET and DRS techniques, and the data are given in Table 2 and Fig. 5. It can be observed that there was a decrease in particle size (i.e. rods were getting shorter) after each round of photocatalysis. This was attributed to the stirring of the solid phase leading to a mechanical distress on the morphology for all the three samples. Also observed was that the BET surface area values for all the three samples decreased. The FWHM from XRD data showed that only TiO2-1W sample had a slight increase in its peak widths (the other two samples had a decrease in peak widths) suggesting perhaps that the level of crystallinity in these samples was not varying in a similar manner. TiO2-1W showed a decrease in crystallinity with each cycle of catalysis. Figure 6 displays a 3D graph that depicts the percent degradation of phenol as a function of time and cycle of photocatalysis. For comparison only TiO2 and TiO2-1W are shown in this graph and it can be clearly observed that only TiO2-1W shows a dramatic increase in the percent of phenol degradation with each cycle. In order to get further insight into the nature of W upon recycling, XPS was performed and the data are shown in Fig. 7. A large peak is observed at 37.1 eV which can be deconvoluted to show the presence of Ti3p and W4f (7/2 and 5/2) peaks. From this, the ratio of Ti to W (before and catalysis) was obtained as 2.9 and 3.3 respectively. Although the ratio does change suggesting a small amount of W leaching during the catalysis, nonetheless it can also be observed that there was negligible change in the binding energy for the main envelope peak and the three deconvoluted peaks for before and after photocatalysis. This insinuated there was no change in the electronic environment of either Ti or W during the three cycles of photocatalysis.
Figure 4.

(A) Absorption profile of phenol as it undergoes degradation and change in Log C/Co vs time for (B) TiO2 (C) TiO2-1W and (D) TiO2-3W.
Table 2. Rate constants obtained from each round of catalysis and for the catalysts recovered after 3 cycles of photocatalysis, the FWHM (from XRD data), average size (from SEM data) and BET surface area values.
| Catalyst | Rate constants for each cycle of Photocatalysis (hr−1) | FWHM Plane (101) | FWHM Plane (200) | Average Size (L × W nm) | BET Surface Area (m2/g) | ||
|---|---|---|---|---|---|---|---|
| 1st Cycle | 2nd Cycle | 3rd Cycle | |||||
| TiO2 | −0.024 ± 0.002 | −0.017 ± 0.002 | −0.011 ± 0.001 | 0.54 | 0.61 | 99 ± 48 × 16 ± 2 | 57 ± 0.2 |
| TiO2-1W | −0.018 ± 0.002 | −0.031 ± 0.002 | −0.057 ± 0.003 | 0.56 | 0.60 | 77 ± 35 × 12 ± 3 | 35 ± 0.1 |
| TiO2-3W | −0.017 ± 0.022 | −0.030 ± 0.010 | −0.023 ± 0.021 | 0.55 | 0.60 | 127 ± 57 × 13 ± 6 | 55 ± 0.1 |
Figure 5.

(A) XRD of the photocatalysts before (I) and after (II) 3 rounds of photocatlaysis for (i) TiO2 (ii) TiO2-1W and (iii) TiO2-3W and (B) Diffuse reflectance spectra of the photocatalysts before and after 3 rounds of photocatlaysis for (i) TiO2 (ii) TiO2-1W and (iii) TiO2-3W.
Figure 6. Stack Plot showing % Degradation of Phenol vs Time for (A) TiO2 and (B) TiO2-1W for all the three cycles.

Figure 7. XPS of TiO2-1W catalyst before and after 3 rounds of Photocatalysis.
Discussion
Upon evaluating all the aforementioned data, it can be surmised that only the TiO2-1W sample showed dramatic improvement of the photocatalytic activity. The increase in rate of degradation was 1.7 times higher in the second cycle (when compared to the first) and then it was 3.1 times higher in the third cycle (again, when compared to the first). This aspect has been reproduced repeatedly. However this increment was not observed with the other samples. TiO2-3W did show a preliminary increase after the first cycle however a subsequent decrease was observed for the latter cycle. Moreover, all these aspects were mirrored in the degradation of Rhodamine B (see supplementary information).
Photocatalytic activity is strongly dependent on parameters such as surface area, band gap, and phase composition (presence of anatase and/or rutile). For all the three samples, after catalysis, a degradation of morphology was observed and the BET surface area seemed to decrease as well. Moreover, in fact out of the three samples, TiO2-1W sample had the smallest surface area after the three rounds of catalysis. Despite a decrease in surface area, obviously there was either an increase in the number of charge carriers or charge transport was being enhanced in order to account for the improvement in the catalysis rates. In regards to the phases present after the three cycles of catalysis, TiO2 showed a substantial increase in the rutile content, TiO2-1W showed a marginal increase while TiO2-3W had rutile in the as-synthesized material to begin with and this got augmented after the three cycles of catalysis. Rutile is known to form if the anatase phase is exposed to visible light or is mechanically agitated over prolonged periods41,42,43. Moreover, it is well accepted now in literature that presence of rutile at small concentrations has a beneficial effect on catalysis however at larger concentrations, it has a deleterious effect17. These aspects might account for why TiO2-3W did not show an enhanced rate in the final cycle. Additionally, normally for tungsten doped TiO2, it has been well accepted that two aspects govern the rate of photocatalysis – the surface aspects (presence of W(VI) cation on the surface shifts the isoelectric point to lower values in comparison to pristine TiO2) and the bulk aspects (denoted by isomorphic substitution within the lattice)44,45. It is being hypothesized for this case that as the diffuse reflectance spectrum evolves and there is a slight red shift (ca. 0.1 eV) before and after three rounds of catalysis, there is therefore an extension of the light absorption range leading to an increase in the number of charge carriers. Do note that there are no dramatic changes in crystallinity and surprisingly, even the XPS data does not show any change in the oxidation states of W for the TiO2-1W sample. The binding energy remains the same before and after the catalysis. Moreover, XRD data shows neither a separated phase of WO3 nor other crystalline phases of tungsten. In fact, to improve resolution of the XRD data, long scans (over 12 hours collection time) were done and despite this, additional phases of tungsten oxide were not observed. It can therefore be surmised that non-stoichiometric solid solution of WX-Ti1-XO2 could be feasible because of similarity in ionic radius of the two metal ions. The only slight variation that has been observed, as mentioned above, is the slight red shift of the TiO2-1W sample in DRS spectra after catalysis. For the other two samples, the spectra show either a zero or slight blue shift in the absorption profile after catalysis. This suggests that perhaps diffusion (the redistribution of atoms from regions of high concentration, i.e. surface, to regions of low concentration, i.e. bulk of lattice) is occurring for the dopant cation. It has been reported that when tungsten is the dopant atom, there is a preference for it to reside on the surface of the TiO2 nanoparticles. This aspect has been detailed by Couselo et al.45 and Kong et al.46. Therefore it is purported for the as-synthesized samples, tungsten which could be residing predominantly only on the surface initially, after each round of photocatalysis, slowly diffuses into the TiO2 lattice leading to enhancement. This aspect can be corroborated by the fact that, after catalysis, a slightly higher FWHM is observed only for TiO2-1W sample when compared to its two other counterparts. This suggests that there was a decrease in domain size (from which coherent diffraction can occur) upon recycling the catalyst. However for TiO2 and TiO2-3W, the FWHM showed the opposite trend. This could mean that although the coordination environment around W remains the same, however by having isomorphic substitution into the lattice, the cation dopant is creating shallow states that are leading to enhanced visible light photoactivity with each cycle of photocatalysis (as observed by the increased absorption spectrum range). This aspect is unique in that this study that has revealed a seminal observation that doped catalysts undergo alterations in the nature of their lattice during catalysis. The dopant atom diffuses and impregnates in a more concerted way into the lattice creating a better doped structure leading to enhanced photoactivity. It is important to note that this appears to be only valid for certain concentrations of dopants as at higher concentrations (as in our case for TiO2-3W) other effects override the rate of catalysis (such as presence of other phases) that have deleterious effects on the overall rate.
Conclusion
In summary, TiO2 nanowires doped with different concentration of W were synthesized in a simple and facile sol-gel route using glycerol as the solvent and chelating ligand and tungstic acid as the precursor for W. W was incorporated into TiO2 lattice as the PXRD pattern did not show the presence of any other phases except TiO2. All the photocatalysts were able to degrade phenol and rhodamine B as the model pollutants under exclusive visible light illumination. However, most importantly, it was found that the TiO2 nanowires doped with 1 mol.% W showed enhanced photocatalytic activity with increasing number of cycles. This enhancement in photocatalytic activity with increasing number cycles was due to the enhancement in visible light absorption with number of increasing cycles as suggested by the red shift in TiO2 absorption band edge in DRS UV-Vis spectra.
Methods
Analytical reagent grade Titanium butoxide Ti(OCH2CH2CH2CH3)4 (97%), Anhydrous Glycerol (HOCH2CHOHCH2OH) and Tungstic acid (H2WO4) were used without any further purification as received from Sigma Aldrich and Merck respectively. TiO2 was prepared by following earlier work reported by Das et al.36 Primarily, a titanium glycerolate precursor was first synthesized (having a rod like morphology) and this was then subsequently converted to anatase phase of TiO2 upon annealing. Specifically, 40 ml glycerol was dried at 140 °C, for preparation of samples having 1% and 3% mole of Tungsten (W) 3.0 mg and 9.0 mg of Tungstic acid powder was added respectively to anhydrous glycerol. Then 0.4 ml Titanium butoxide was added. Reaction mixture was refluxed at 190 °C for 36 Hours under N2 flow. A white precipitate of titanium glycerolate was harvested by centrifugation with repeated washings with ethanol. This was dried at 60 °C for 1 hr and then subsequently calcined at 500 °C with a dwell time 1 hour and 1 °C/min heating rate to yield TiO2 or its doped analogue.
Catalyst characterization
Powder X-ray diffraction (XRD) measurements from 5° to 80° 2θ were recorded using PANalytical X’pertpro diffractometer with monochromatic CuKα radiation (λ = 1.54056 Å) operating at 40 kV and 30 mA. BET analysis was done on Micromeritics ASAP Surface Area and Porosity Analyzer. Scanning electron microscopy (SEM) images were taken using JEOL JSM-840. The BET surface area of the sample was measured on Micromeritics ASAP 2020 Analyzer. Prior to N2 physisorption data collection, the samples were degassed at 120 °C under vacuum for 12 h. Diffuse reflectance spectra were collected on JASCO V-670 spectrometer. X-ray Photoelectron Spectroscopy (XPS) analysis was performed with a custom built ambient pressure XPS system2047 (Prevac, Poland) and equipped with a VG Scienta SAX 100 emission controller monochromator using an Al Kα anode (1486.6 eV) in transmission lens mode. The photoelectrons were energy analyzed using VG Scienta’s R3000 differentially pumped analyzer.
Measurement of Photocatalytic activity
For measurement of photocatalytic activity, a 100W Schott LED cold source lamp with a 400 nm long pass filter was used to obtain exclusive visible irradiation. 50ml glass beaker was placed having 30 ml of 100 μM phenol solution and 30 mg of catalyst on the magnetic stirrer. Initially in order to attain adsorbed equilibrium, the solution plus catalyst were kept in dark condition for 1 hour with mild stirring. An UV-Vis adsorption reading taken of the phenol supernatant then light was illuminated and after certain time intervals 1.0 ml aliquot was taken for absorbance measurement. Prior to absorbance spectra measurement, the supernatant was centrifuged for 20 mins to remove any catalyst. Absorbance was recorded by SPECORD 205 spectrophotometer from 200–800 nm wavelength range. At the end of each cycle, the catalyst was recovered by centrifugation and air dried. This recovered solid photocatalyst was re-weighed and re-inserted into fresh phenol solution and irradiated with light as the second cycle. Subsequently, again the solid catalyst harvested and reused for 3rd cycle of phenol degradation. Total three consecutive cycles were performed by the same batch catalyst. Volume of phenol solution (1 ml–100 μM) and catalyst (mg) ratio was maintained at 1:1. After the last cycle, the catalyst was calcined to remove any adsorbed impurities and then re-characterized by SEM, DRS, XPS, and BET.
Additional Information
How to cite this article: Sorathiya, K. et al. Enhancement in Rate of Photocatalysis Upon Catalyst Recycling. Sci. Rep. 6, 35075; doi: 10.1038/srep35075 (2016).
Supplementary Material
Acknowledgments
Authors are thankful to TIFR’s SEM facility (Ms. Bhagyashri Chalke, Mr. Rudhir Bhapat), XRD facility (Mr. Nilesh Kulkarni), and TEM facility (Mr. Lalit Borde).
Footnotes
Author Contributions K.S., B.M. and A.K. performed all the experiments, K.P.R. and C.S.G. performed the XPS measurements, C.S.G. assisted with XPS analysis and D.K. conceived the experiments, analyzed the results and wrote the manuscript.
References
- Bai S., Jiang J., Zhang Q. & Xiong Y. Steering charge kinetics in photocatalysis: intersection of materials syntheses, characterization techniques and theoretical simulations. Chem. Soc. Rev. 44, 2893–2939 (2015). [DOI] [PubMed] [Google Scholar]
- Mishra B. & Khushalani D. Nanomaterials based photocatalysts in Nanocatalysis: Synthesis and Application (eds Polshettiwar V. & Asefa T.) 469–493 (John Wiley & Sons, 2013). [Google Scholar]
- Zhang N. et al. Waltzing with the versatile platform of graphene to synthesize composite photocatalysts. Chem. Rev. 115, 10307–10377 (2015). [DOI] [PubMed] [Google Scholar]
- Bharad P. A., Sivaranjani K. & Gopinath C. S. A rational approach towards enhancing solar water splitting: a case study of Au–RGO/N-RGO–TiO2. Nanoscale. 7, 11206–11215 (2015). [DOI] [PubMed] [Google Scholar]
- Schneider J. et al. Understanding TiO2 photocatalysis: mechanisms and materials. Chem. Rev. 114, 9919–9986 (2014). [DOI] [PubMed] [Google Scholar]
- Martin D. J. et al. Efficient visible driven photocatalyst, silver phosphate: performance, understanding and perspective. Chem. Soc. Rev. 44, 7808–7829 (2015). [DOI] [PubMed] [Google Scholar]
- Tachikawa T. & Majima T. Single-molecule, single-particle fluorescence imaging of TiO2-based photocatalytic reactions. Chem. Soc. Rev. 39, 4802–4819 (2010). [DOI] [PubMed] [Google Scholar]
- Gligorovski S., Strekowski R., Barbati S. & Vione D. Environmental implications of hydroxyl radicals (•OH). Chem. Rev. 115, 13051–13092 (2015). [DOI] [PubMed] [Google Scholar]
- Ohko Y. & Fujishima A. Kinetic analysis of the photocatalytic degradation of gas-phase 2-propanol under mass transport-limited conditions with a TiO2 film photocatalyst. J. Phys. Chem. B 102, 1724–1729 (1998). [Google Scholar]
- Fujishima A. & Honda K. Electrochemical photolysis of water at a semiconductor electrode. Nature, 238, 37–38 (1972). [DOI] [PubMed] [Google Scholar]
- Graciani J., Nambu A., Evans J., Rodriguez J. A. & Sanz J. F. Au-N synergy and N-doping of metal oxide-based photocatalyst. J. Am. Chem. Soc. 130, 12056–12063 (2008). [DOI] [PubMed] [Google Scholar]
- Wilhelm P. & Stephan D. Photodegradation of rhodamine B in aqueous solution via SiO2@TiO2 nano-spheres. J. Photochem. Photobiol., A: Chemistry 185, 19–25 (2007). [Google Scholar]
- Roy P., Kim D., Lee K., Spiecker E. & Schmuki P. TiO2 nanotubes and their application in dye-sensitized solar cells. Nanoscale 2, 45–59 (2010). [DOI] [PubMed] [Google Scholar]
- Mishra B., Agarkar S. & Khushalani D. Novel precursors for anatase nanorods and their application in DSSCs. Mater. Chem. Phys. 147, 1110–1116 (2014). [Google Scholar]
- Mor G. K., Shankar K., Paulose M., Varghese O. K. & Grimes C. A. Use of highly-ordered TiO2 nanotube arrays in dye-sensitized solar cells. Nano Lett. 6, 215–218 (2006). [DOI] [PubMed] [Google Scholar]
- Gotfredson K., Wennerberg A., Johansson C., Skovgaard C. T. & Hjorting-Hansen E. Anchorage of TiO2-blasted, HA-coated, and machined implants: an experimental study with rabbits. J. Biomed. Mater. Res. A 29, 1223–1231 (1995). [DOI] [PubMed] [Google Scholar]
- Luttrell T. et al. Why is anatase a better photocatalyst than rutile? –Model studies on epitaxial TiO2 films. Sci. Rep. 4, 4043 (2014). [DOI] [PMC free article] [PubMed] [Google Scholar]
- Li G. et al. Synergistic effect between anatase and rutile TiO2 nanoparticles in dye-sensitized solar cells. Dalton Trans. 10078–10085 (2009). [DOI] [PubMed] [Google Scholar]
- Park N.-G., van de Lagemaat J. & Frank A. J. Comparison of dye-sensitized rutile- and anatase-based TiO2 solar cells. J. Phys. Chem. B 104, 8989–8994 (2000). [Google Scholar]
- Wu W.-Q. et al. Hydrothermal fabrication of hierarchically anatase TiO2 nanowire arrays on FTO glass for dye-sensitized solar cells. Sci. Rep. 3, 1352 (2013). [DOI] [PMC free article] [PubMed] [Google Scholar]
- Law M., Greene L. E., Johnson J. C., Saykally R. & Yang P. Nanowire dye-sensitized solar cells. Nat. Mat. 4, 455–459 (2005). [DOI] [PubMed] [Google Scholar]
- Liu B., Khare A. & Aydil A. S. Synthesis of single-crystalline anatase nanorods and nanoflakes on transparent conducting substrates. Chem. Commun. 48, 8565–8567 (2012). [DOI] [PubMed] [Google Scholar]
- Varghese O. K., Paulose M. & Grimes C. A. Long vertically aligned titania nanotubes on transparent conducting oxide for highly efficient solar cells. Nat. Nanotechnol. 4, 592–597 (2009). [DOI] [PubMed] [Google Scholar]
- Wang X., He G., Fong H. & Zhu Z. Electron transport and recombination in photoanode of electrospun TiO2 nanotubes for dye-sensitized solar cells. J. Phys. Chem. C 117, 1641−1646 (2013). [Google Scholar]
- Long R. & English N. J. First-principles calculation of nitrogen-tungsten codoping effects on the band structure of anatase-titania. Appl. Phys. Lett. 94, 132102 (2009). [Google Scholar]
- Serpone N. Is the band gap of pristine TiO2 narrowed by anion- and cation-doping of titanium dioxide in second-generation photocatalysts? J. Phys. Chem. B 110, 24287–24293 (2006). [DOI] [PubMed] [Google Scholar]
- Gai Y., Li J., Li S.-S., Xia J.-B. & Wei S.-H. Design of narrow-gap TiO2: a passivated codoping approach for enhanced photoelectrochemical activity. Phy. Rev. Lett. 102, 036402 (2009). [DOI] [PubMed] [Google Scholar]
- Celik V. & Mete E. Range-separated hybrid exchange-correlation functional analyses of anatase TiO2 doped with W, N, S,W/N, or W/S. Phy. Rev. B 86, 205112 (2012). [Google Scholar]
- Nah Y.-C., Paramasivam I. & Schmuki P. Doped TiO2 and TiO2 nanotubes: synthesis and applications. Chem. Phys. Chem 11, 2698–2713 (2010). [DOI] [PubMed] [Google Scholar]
- Kumar A. & Mohanty T. Electro-optic modulation induced enhancement in photocatalytic activity of N-doped TiO2 thin films. J. Phys. Chem. C 118, 7130–7138 (2014). [Google Scholar]
- Abdullah S. M. A. & Chong. F. K. Dual-effects of adsorption and photodegradation of methylene blue by tungsten-loaded titanium dioxide. Chem. Eng. J. 158, 418–425 (2010). [Google Scholar]
- Song K. Y. et al. Preparation of transparent particulate MoO3/TiO2 and WO3/TiO2 films and their photocatalytic properties. Chem. Mater. 13, 2349–2355 (2001). [Google Scholar]
- Grabowska E., Sobczak J. W., Gazda M. & Zaleska A. Surface properties and visible light activity of W-TiO2 photocatalysts prepared by surface impregnation and sol–gel method. Appl. Catal. B: Environmental 117–118, 351–359 (2012). [Google Scholar]
- Pan J. H. & Lee W. I. Preparation of highly ordered cubic mesoporous WO3/TiO2 films and their photocatalytic properties. Chem. Mater. 18, 847–853 (2006). [Google Scholar]
- Sathasivam S. et al. Tungsten doped TiO2 with enhanced photocatalytic and optoelectrical properties via aerosol assisted chemical vapor deposition. Sci. Rep. 5, 10952 (2015). [DOI] [PMC free article] [PubMed] [Google Scholar]
- Liu Z., Sun D. D., Guo P. & Leckie J. O. One-step fabrication and high photocatalytic activity of porous TiO2 hollow aggregates by using a low-temperature hydrothermal method without templates. Chem. Eur. J. 13, 1851–1855 (2007). [DOI] [PubMed] [Google Scholar]
- Roy N., Sohn Y. & Pradhan D. Synergy of low-energy {101} and high-energy {001} TiO2 crystal facets for enhanced photocatalysis. ACS Nano 7, 2532–2540 (2013). [DOI] [PubMed] [Google Scholar]
- Han F., Kambala V. S. R., Srinivasan M., Rajarathnam D. & Naidu R. Tailored titanium dioxide photocatalysts for the degradation of organic dyes in wastewater treatment: A review. Appl. Catal. A 359, 25–40 (2009). [Google Scholar]
- Prado A. G. S., Bolzon L. B., Pedroso C. P., Moura A. O. & Costa L. L. Nb2O5 as efficient and recyclable photocatalyst for indigo carmine degradation. Appl. Catal. A 82, 219–224 (2008). [Google Scholar]
- Das J., Freitas F. S., Evans I. R., Nogueira A. F. & Khushalani D. A facile nonaqueous route for fabricating titania nanorods and their viability in quasi-solid-state dye-sensitized solar cells. J. Mater. Chem. 20, 4425–4431 (2010). [Google Scholar]
- Ricci P. C. et al. Anatase-to-rutile phase transition in TiO2 nanoparticles irradiated by visible Light. J. Phys. Chem. C 117, 7850–7857 (2013). [Google Scholar]
- Dutta H., Sahu P., Pradhan S. K. & De M. Microstructure characterization of polymorphic transformed ball-milled anatase TiO2 by rietveld method. Mater. Chem. Phys. 77, 153–164 (2002). [Google Scholar]
- Pan X., Jiang D., Lin Y. & Ma X. Structural characterization and ferromagnetic behavior of Fe-doped TiO2 powder by high-energy ball milling. J. Magn. Magn. Mater. 305, 388–391 (2006). [Google Scholar]
- Li X. Z., Li F. B., Yang C. L. & Ge W. K. Photocatalytic activity of WOx-TiO2 under visible light irradiation. J. Photochem. & Photobio. A. 141, 209–217 (2001). [Google Scholar]
- Couselo N., Einschlag F. S. G., Candal R. J. & Jobbágy M. Tungsten-doped TiO2 vs pure TiO2 photocatalysts: effects on photobleaching kinetics and mechanism. J. Phys. Chem. C 112, 1094–1100 (2008). [Google Scholar]
- Kong M. et al. Tuning the relative concentration ratio of bulk defects to surface defects in TiO2 nanocrystals leads to high photocatalytic efficiency. J. Am. Chem. Soc. 133, 16414–16417 (2011). [DOI] [PubMed] [Google Scholar]
- Roy K., Vinod C. P. & Gopinath C. S. Design and performance aspects of a custom built ambient pressure photoelectron spectrometer towards bridging the pressure gap: oxidation of Cu, Ag and Au surfaces at 1 mbar O2 pressure. J. Phys. Chem. C 117, 4717–4726 (2013). [Google Scholar]
Associated Data
This section collects any data citations, data availability statements, or supplementary materials included in this article.