

Abstract
Molecular imaging holds considerable promise for elucidating biological processes in normal physiology as well as disease states, but requires noninvasive methods for identifying analytes at sub-micromolar concentrations. Particularly useful are genetically encoded, single-protein reporters that harness the power of molecular biology to visualize specific molecular processes, but such reporters have been conspicuously lacking for in vivo magnetic resonance imaging (MRI). Here, we report TEM-1 β-lactamase (bla) as a single-protein reporter for hyperpolarized (HP) 129Xe NMR, with significant saturation contrast at 0.1 μM. Xenon chemical exchange saturation transfer (CEST) interactions with the primary allosteric site in bla give rise to a unique saturation peak at 255 ppm, well removed (~60 ppm downfield) from the 129Xe-H2O peak. Useful saturation contrast was also observed for bla expressed in bacterial cells and mammalian cells.
Keywords: Molecular imaging, NMR reporter genes, Protein biophysics, MR contrast agents, Supramolecular chemistry
Graphical Abstract
TEM-1 β-lactamase (bla) is a single-protein reporter for hyperpolarized 129Xe NMR, with significant saturation contrast at 0.1 μM. Xenon chemical exchange saturation transfer (CEST) interactions with an allosteric site in bla give rise to a unique saturation peak at 255 ppm, well removed (~60 ppm downfield) from the 129Xe-H2O peak. Useful saturation contrast was also observed for bla expressed in bacterial and mammalian cells.
Genetically encoded optical reporters such as green fluorescent protein (GFP) have enabled biomolecular imaging, making it possible to connect cellular processes with quantitative, real-time measurements of localized gene expression.[1] However, due to the strong scattering of light by living tissue, optical reporters are mostly limited to studies of single cells and transparent, model organisms. Alternate non-invasive imaging methods such as magnetic resonance imaging (MRI) are thus needed for monitoring gene expression and tracking cell migration in larger organisms.[2] MRI offers excellent spatiotemporal resolution, however 1H MRI reporter genes are limited by low detection sensitivity and also by high background 1H signals from water and fat. This has motivated investigation of hyperpolarized (HP) 129Xe (I = ½), which can provide Xe-specific molecular information within the context of 1H NMR signals.
HP 129Xe with long T1 gives rise to 104–105 signal enhancement over the room-temperature Boltzmann population of nuclear spins and is readily obtained by a process of spin-exchange optical pumping.[3] HP 129Xe is non-toxic, can be delivered to living organisms via inhalation or Xe-solution injection, and has been employed for imaging the lungs and brain of living mammals, including human.[4] Xenon has high affinity for hydrophobic void spaces, including host molecules such as water-soluble cryptophane and cucurbituril,[5] and the highly polarizable electron cloud affords xenon high sensivitiy to its local environment. The interactions between xenon and small molecules have led to many biosensing applications.[6] Using a NMR technique known as HP 129Xe chemical exchange saturation transfer (Hyper-CEST),[7] structures with low-affinity Xe binding sites can be identified that are otherwise invisible by direct detection of HP 129Xe NMR peaks. By Hyper-CEST, host-encapsulated HP 129Xe is selectively depolarized by radiofrequency (RF) saturation pulses, and the depolarized 129Xe rapidly exchanges with HP 129Xe in aqueous solvent, where Xe is soluble (~5 mM/atm at rt) and loss of signal is readily observed. Recently, Shapiro et al. reported the use of genetically encoded bacterial gas vesicles (GVs) as ultrasensitive Hyper-CEST contrast agents.[8] While providing a pioneering example, GVs are very large (0.1 – 2 μm long) multimeric protein assemblies from complex gene clusters, and difficult to reconstitute in many eukaryotic systems. Here we show that the 29 kDa TEM-1 β-lactamase from E. coli can function as a genetically encoded single-protein contrast agent for Hyper-CEST, and gives useful contrast in both bacterial and mammalian cells (Scheme 1).
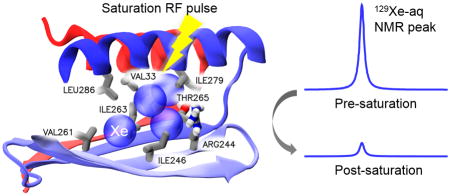
Scheme 1.

Ultrasensitive detection of bla via HP 129Xe chemical exchange saturation transfer. HP 129Xe (green) exchanges into bla, where the unique resonance frequency can be saturated by shaped RF pulses. Saturated xenon (maroon) returns to the bulk, leading to a decrease in Xe-aq signal.
The small size (D = 4.3 Å) and hydrophobicity of xenon allow it to interact with proteins via both non-specific and specific binding events.[9] Previous 129Xe NMR studies have probed hydrophobic cavities within globular proteins.[10] The promiscuous interactions of xenon with many proteins have also been investigated by the X-ray diffraction of protein crystals under high Xe pressure, where xenon can occupy hydrophobic cavities, substrate-binding sites, and also channel pores.[11] Notably, these are weak interactions, with hemoglobin and myoglobin exhibiting the highest reported xenon association constants of around 200 M−1 at rt.[12] In our search for a versatile genetically encoded reporter for Hyper-CEST NMR, we targeted a candidate protein TEM-1 β-lactamase (bla) based on its well-established allosteric site whose size and hydrophobicity suggest it to be a good target for Xe exchange. In 2004, the allosteric site was discovered serendipitously via X-ray crystallography,[13] and additional cryptic allosteric sites were recently identified in molecular dynamics (MD) simulations analyzed using Markov State Models.[14] Bla is a small, monomeric bacterial enzyme that hydrolyzes β-lactam antibiotics and confers antibiotic resistance to its host. Importantly, bla is not normally found in eukaryotic cells and is nontoxic when overexpressed in eukaryotic cells.[15] The activity that bla confers initially motivated the development of fluorogenic substrates for studies of gene expression in mammalian cell culture.[16] Bla has since been widely applied in biotechnology, e.g., in protein fragment complementation assays for studying protein-protein interactions in vitro and in vivo,[17] with constructs engineered to be minimally immunogenic, and in transgenic bla-mouse reporters.[18]
To explore whether bla is able to accommodate Xe atoms, we performed “flooding” MD simulations. In this protocol, the protein is simulated in the presence of a large number of solute moieties to increase the rate of collisions between the solute and protein and thus enhance the sampling of binding events. In particular, we simulated bla in presence of Xe atoms (0.15 M) dissolved in water. Characterization of the protein regions visited by Xe atoms during the simulation gives information about the putative binding sites, pathways, and relative binding kinetics.
The analysis of a 1-μs trajectory reveals a complex landscape with numerous bla regions characterized by a large value of Xe occupancy (Figure 1a). The most prominent binding region is located between the two terminal α-helices (one at the N-terminus and the other at the C-terminus: residues 26 to 41 and 272 to 290, respectively) and the flanking β sheet; where Xe atoms are observed to form a cluster of up to 4 atoms (Fig. 1 and 2a). Strikingly, this is the same allosteric site that had been characterized crystallographically (Supporting information, Fig. S1).[13] Five other regions with comparable occupancy but smaller size are detected throughout the protein, all of them in proximity of helix 2 (residues 67 to 87).
Figure 1.

a) Cartoon representation of bla showing secondary structure elements; color highlights the position of each residue along the primary structure, from red (N-terminus) to blue (C-terminus). The purple volumes indicate regions of high Xe occupancy. b) Selected snapshots from the molecular dynamics trajectory after 0.6 μs (top panel) and 1 μs (bottom panel), highlighting Xe atoms (blue spheres) occupying only the main allosteric site. The sidechains of the residues lining the pocket are represented as sticks.
Figure 2.

a) Close-up of the main Xe binding site. Secondary structure elements--helices 1 and 12 and the flanking beta sheet—are colored red (N-terminus) to blue (C-terminus). Xe atoms (blue spheres) establish van der Waals interactions with many sidechains (gray sticks). b) Hyper-CEST z-spectra for wt-bla and I263A, 80 μM in pH 7.2 PBS.
The location and extension of these high-Xe-occupancy regions (Fig. S2) bear striking resemblance to the cryptic allosteric sites detected by Geissler[14a] on a large sampling of protein conformations collected via Markov State Models, which included the experimentally validated allosteric binding site.[13] In this relatively large, hydrophobic cavity, Xe atoms establish van der Waals interactions with the sidechains of several residues (V33, V44, R244, I246, V261, I263, T265, I279, L286). R244 and T265 are the only polar residues in this pocket (Fig. 2a). As previously noted,[14a] the side chains that form this primary cavity also interact with allosteric bla inhibitors.[13]
Our simulations provide insight on the relative binding kinetics of Xe to this allosteric site. Indeed, we found that binding to the innermost section of this cavity (located between helix 1 and 12) occurs after ~0.6 μs and only after the most solvent accessible part of the cavity (lined by helix 11 and 12) is fully occupied by two Xe atoms (Figure 1b). Thus, in spite of the high concentration of Xe atoms, binding to the allosteric pocket is a relatively slow process, slower than binding to any other pocket present in bla (Fig. S3).
For in vitro studies, recombinant bla was expressed in BL21(DE3) E. coli and purified by column chromatography. Bla (80 μM) was used to obtain a Hyper-CEST z-spectrum, where multiple selective Dsnob-shaped saturation pulses were scanned over the chemical shift range of 143–293 ppm in 5-ppm steps, and aqueous 129Xe signal was measured as a function of saturation pulse offset (Fig. 2b and Fig. S4). Two saturation responses were observed: one for free 129Xe in solution peak centered at 195 ppm, and a second peak centered at 255 ppm that was attributed to xenon-bla interaction. Both peaks in the Hyper-CEST z-spectrum appeared broad, indicating that xenon undergoes fast exchange between the aqueous state and transient protein-binding state. Importantly, the unique 129Xe-bla peak cannot be directly observed by HP 129Xe NMR spectroscopy even with high-concentration (~mM) bla, due to the low xenon-bound population and high rate of xenon exchange between different sites. This scenario was observed previously with spores[19] and also CB[6].[20]
We then carried out Hyper-CEST measurements by varying saturation time to determine the molecular sensitivity of bla. Shaped saturation pulses were applied at the chemical shift of 129Xe-bla, and the residual aqueous 129Xe signal after saturation transfer was measured as on-resonance CEST response (Fig. S4 and S5). Off-resonance pulses were applied at 135 ppm, to mirror the 60-ppm frequency interval observed for Xe-bla and Xe-aq signals. The observed depolarization response in Hyper-CEST experiments arose from both self-relaxation of HP 129Xe and bla-mediated saturation transfer. The normalized difference between on-resonance and off-resonance signals was represented by the saturation contrast. Using this method, 0.1 μM (2.9 μg/mL) bla was able to produce 0.23 ± 0.02 saturation contrast (Equation S1). The in vitro detection limit of single protein bla is comparable to previously reported GVs in terms of protein mass concentration,[8] and represents a roughly 100-fold improvement compared to 1H-CEST reporter genes.[21]
We hypothesized that the 255 ppm peak observed in the Hyper-CEST spectrum may originate from the allosteric cavity (Figure 1b) identified by MD simulations. Ile-263 is positioned at the entrance of this Xe binding site and lies in close proximity to the bound Xe (Figure 2a). Thus, Ile-263 was mutated to alanine, and the I263A mutant was expressed and purified following the same procedure used for wild-type (wt) bla. The Hyper-CEST z-spectrum for I263A showed almost complete loss of the Xe-bla signal (Figure 2b). Following Hyper-CEST, an activity assay confirmed that the I263A enzyme was not denatured by Xe bubbling during the Hyper-CEST experiments. Additionally, circular dichroism (CD) spectroscopy confirmed that the secondary structure of the I263A mutant was maintained (Fig. S6). The loss of Hyper-CEST signal at 255 ppm is attributed to faster Xe exchange and/or lower Xe affinity for the larger I263A cavity. This highlights that the architecture of the wt-bla allosteric site is crucial for producing Hyper-CEST signal.
We then investigated the possibility of using bla as a genetically encoded 129Xe NMR reporter in cells. BL21(DE3) E. coli cells expressing recombinant wt-bla were cultured in LB media and induced with 2 mM isopropyl-β-thiogalactopyranoside (IPTG). Cells were then pelleted, washed, resuspended in phosphate-buffered saline (PBS), and used in Hyper-CEST experiments. E. coli cells transformed with the same plasmid but not induced by IPTG were prepared following the same procedure as a negative control. Saturation time-dependent Hyper-CEST experiments showed that bla-expressing E. coli grown to OD600 of 9.2 (7.4 billion cells/ml) produced a saturation contrast of 0.72 ± 0.03 (Fig. 3a). After 6.7 s of nearly continuous irradiation of 129Xe-bla with saturating RF pulses, the 129Xe-aq peak was almost completely saturated. By contrast, the on-resonance and off-resonance curves were almost identical for the control E. coli sample at the same OD600. The same result was observed in the z-spectra of induced and non-induced E. coli cells (Fig. S7). In these E. coli experiments, bla was readily detected at the equivalent of 6.5 μM concentration in the cell suspension, as confirmed by gel and colorimetric assay (Fig. S8).
Figure 3.

Top: Time-dependent saturation transfer data for induced E. coli (left) and non-induced E. coli (right). Bottom: Time-dependent saturation transfer data for transfected (left) and control (right) HEK293T/17 cells. Saturation frequencies of Dsnob-shaped pulses were positioned +60 ppm and -60ppm referenced to Xe-aq peak, for on- and off-resonance. Pulse length, τpulse = 1.0496 ms; field strength, B1,max = 279 μT. The number of pulses linearly increased from 0 to 6000, 12000 or 14000.
Having established that bla can be used as a genetically encoded reporter in a bacterial system, we set out to test whether it can also function in mammalian cells. HEK293T/17 cells were transfected with a transient-expression plasmid incorporating SV40 enhancer, harvested, and resuspended in PBS for Hyper-CEST experiments. Control cells were subcultured from the same flask but not transfected. At 4.4 million cells per ml concentration, without optimization for bla expression, both transfected and non-transfected cells produced obvious saturation contrast, and both z-spectra had a slight shoulder appearing in the downfield region of the 129Xe-aq peak (Fig. S9). We hypothesize this background signal arises from the interaction of xenon with membranes enclosing the organelles in eukaryotic cells,[22] which are absent in prokaryotic cells. In order to minimize background contrast, we compared Hyper-CEST signal of samples at lower cell density while increasing the bla expression level. As illustrated by Figure 3c, 0.2 million/ml transfected HEK cells producing the equivalent of 0.7 μM bla in the cell suspension (Fig. S10) was sufficient to produce a saturation contrast of 0.13 ± 0.01, compared to minimal contrast observed for control HEK cells.
Lower detection sensitivity was observed for bla expressed in cellular environments compared to pure bla in buffer. For example, the saturation contrast produced by approximately 6.5 μM bla expressed in E. coli was considerably less than that produced by 0.5 μM pure bla in buffer under the same saturation pulse conditions (Fig. S5). This decrease in saturation contrast can be attributed to the diffusion barriers imposed by cells, which can result in tens-of-millisecond xenon penetration time.[23] Nevertheless, 0.7 μM bla expressed by 0.2 million/ml transfected HEK cells was readily detected using Hyper-CEST. Use of isotopically enriched 129Xe and new 129Xe hyperpolarization technology should increase detection sensitivity more than 10-fold.[24] We also aim to improve bla as a Hyper-CEST reporter for biomolecular imaging: The introduction of site-specific mutations, for example, can increase bla affinity for Xe and/or shift its Hyper-CEST response peak to achieve multiplexing or discriminate against 129Xe-mammalian cell background signals.
Supplementary Material
Acknowledgments
This work was supported by NIH R01-GM097478 and CDMRP-LCRP Concept Award #LC130824. We thank Kristy Ou and Ana Melo for gift of HEK293T cells, UPenn Chemistry NMR facility for spectrometer time.
Footnotes
Supporting information for this article is given via a link at the end of the document.
References
- 1.Lippincott-Schwartz J, Patterson GH. Science. 2003;300:87–91. doi: 10.1126/science.1082520. [DOI] [PubMed] [Google Scholar]
- 2.a) Liu G, Gilad AA. 2011;771:733–746. doi: 10.1007/978-1-61779-219-9_36. [DOI] [PubMed] [Google Scholar]; b) Minn I, Bar-Shir A, Yarlagadda K, Bulte JWM, Fisher PB, Wang H, Gilad AA, Pomper MG. Magn Reson Med. 2015;74:544–549. doi: 10.1002/mrm.25748. [DOI] [PMC free article] [PubMed] [Google Scholar]; c) Bar-Shir A, Bulte JWM, Gilad AA. ACS Chem Biol. 2015;10:1160–1170. doi: 10.1021/cb500923v. [DOI] [PMC free article] [PubMed] [Google Scholar]
- 3.Walker TG, Happer W. Rev Mod Phys. 1997;69:629–642. [Google Scholar]
- 4.a) Swanson SD, Rosen MS, Agranoff BW, Coulter KP, Welsh RC, Chupp TE. Magn Reson Med. 1997;38:695–698. doi: 10.1002/mrm.1910380503. [DOI] [PubMed] [Google Scholar]; b) Mugler JP, 3rd, Altes TA. J Magn Reson Imaging. 2013;37:313–331. doi: 10.1002/jmri.23844. [DOI] [PMC free article] [PubMed] [Google Scholar]
- 5.a) Bai Y, Hill PA, Dmochowski IJ. Anal Chem. 2012;84:9935–9941. doi: 10.1021/ac302347y. [DOI] [PMC free article] [PubMed] [Google Scholar]; b) Wang Y, Dmochowski IJ. Chem Commun. 2015;51:8982–8985. doi: 10.1039/c5cc01826a. [DOI] [PMC free article] [PubMed] [Google Scholar]; c) Schnurr M, Sloniec-Myszk J, Dopfert J, Schroder L, Hennig A. Angew Chem Int Edit. 2015;54:13444–13447. doi: 10.1002/anie.201507002. [DOI] [PubMed] [Google Scholar]; d) Wang Y, Roose BW, Philbin JP, Doman JL, Dmochowski IJ. Angew Chem Int Ed. 2016;55:1733–1736. doi: 10.1002/anie.201508990. [DOI] [PMC free article] [PubMed] [Google Scholar]
- 6.a) Spence MM, Rubin SM, Dimitrov IE, Ruiz EJ, Wemmer DE, Pines A, Yao SQ, Tian F, Schultz PG. Proc Natl Acad Sci U S A. 2001;98:10654–10657. doi: 10.1073/pnas.191368398. [DOI] [PMC free article] [PubMed] [Google Scholar]; b) Taratula O, Dmochowski IJ. Curr Opin Chem Biol. 2010;14:97–104. doi: 10.1016/j.cbpa.2009.10.009. [DOI] [PMC free article] [PubMed] [Google Scholar]
- 7.Schroeder L, Lowery TJ, Hilty C, Wemmer DE, Pines A. Science. 2006;314:446–449. doi: 10.1126/science.1131847. [DOI] [PubMed] [Google Scholar]
- 8.Shapiro MG, Ramirez RM, Sperling LJ, Sun G, Sun J, Pines A, Schaffer DV, Bajaj VS. Nat Chem. 2014;6:629–634. doi: 10.1038/nchem.1934. [DOI] [PubMed] [Google Scholar]
- 9.a) Rubin SM, Spence MM, Pines A, Wemmer DE. J Magn Reson. 2001;152:79–86. doi: 10.1006/jmre.2001.2389. [DOI] [PubMed] [Google Scholar]; b) Rubin SM, Lee SY, Ruiz EJ, Pines A, Wemmer DE. J Mol Biol. 2002;322:425–440. doi: 10.1016/s0022-2836(02)00739-8. [DOI] [PubMed] [Google Scholar]; c) Rubin SM, Spence MM, Goodson BM, Wemmer DE, Pines A. Proc Natl Acad Sci U S A. 2000;97:9472–9475. doi: 10.1073/pnas.170278897. [DOI] [PMC free article] [PubMed] [Google Scholar]
- 10.a) Landon C, Berthault P, Vovelle F, Desvaux H. Protein Sci. 2001;10:762–770. doi: 10.1110/ps.47001. [DOI] [PMC free article] [PubMed] [Google Scholar]; b) Bowers CR, Storhaug V, Webster CE, Bharatam J, Cottone A, Gianna R, Betsey K, Gaffney BJ. J Am Chem Soc. 1999;121:9370–9377. doi: 10.1021/ja991443+. [DOI] [PMC free article] [PubMed] [Google Scholar]; c) Dubois L, Da Silva P, Landon C, Huber JG, Ponchet M, Vovelle F, Berthault P, Desvaux H. J Am Chem Soc. 2004;126:15738–15746. doi: 10.1021/ja046195i. [DOI] [PubMed] [Google Scholar]; d) Tilton RF, Kuntz ID. Biochemistry. 1982;21:6850–6857. doi: 10.1021/bi00269a035. [DOI] [PubMed] [Google Scholar]; e) Desvaux H, Dubois L, Huber G, Quillin ML, Berthault P, Matthews BW. J Am Chem Soc. 2005;127:11676–11683. doi: 10.1021/ja053074p. [DOI] [PubMed] [Google Scholar]
- 11.Prangé T, Schiltz M, Pernot L, Colloc’h N, Longhi S, Bourguet W, Fourme R. Proteins: Structure, Function, and Bioinformatics. 1998;30:61–73. [PubMed] [Google Scholar]
- 12.a) Conn HL. J Appl Physiol. 1961;16:1065. doi: 10.1152/jappl.1961.16.6.1065. [DOI] [PubMed] [Google Scholar]; b) Ewing GJ, Maestas S. J Phys Chem. 1970;74:2341. doi: 10.1021/j100705a018. [DOI] [PubMed] [Google Scholar]
- 13.Horn JR, Shoichet BK. J Mol Biol. 2004;336:1283–1291. doi: 10.1016/j.jmb.2003.12.068. [DOI] [PubMed] [Google Scholar]
- 14.a) Bowman GR, Geissler PL. Proc Natl Acad Sci U S A. 2012;109:11681–11686. doi: 10.1073/pnas.1209309109. [DOI] [PMC free article] [PubMed] [Google Scholar]; b) Bowman GR, Bolin ER, Hart KM, Maguire BC, Marqusee S. Proc Natl Acad Sci U S A. 2015;112:2734–2739. doi: 10.1073/pnas.1417811112. [DOI] [PMC free article] [PubMed] [Google Scholar]
- 15.a) Matagne A, Lamotte-Brasseur J, Frère JM. Biochem J. 1998;330:581–598. doi: 10.1042/bj3300581. [DOI] [PMC free article] [PubMed] [Google Scholar]; b) Philippon A, Dusart J, Joris B, Frere JM. Cell Mol Life Sci. 1998;54:341–346. doi: 10.1007/s000180050161. [DOI] [PMC free article] [PubMed] [Google Scholar]
- 16.Zlokarnik G, Negulescu PA, Knapp TE, Mere L, Burres N, Feng L, Whitney M, Roemer K, Tsien RY. Science. 1998;279:84–88. doi: 10.1126/science.279.5347.84. [DOI] [PubMed] [Google Scholar]
- 17.a) Galarneau A, Primeau M, Trudeau LE, Michnick SW. Nat Biotechnol. 2002;20:619–622. doi: 10.1038/nbt0602-619. [DOI] [PubMed] [Google Scholar]; b) Wehrman T, Kleaveland B, Her JH, Balint RF, Blau HM. Proc Natl Acad Sci U S A. 2002;99:3469–3474. doi: 10.1073/pnas.062043699. [DOI] [PMC free article] [PubMed] [Google Scholar]; c) Spotts JM, Dolmetsch RE, Greenberg ME. Proc Natl Acad Sci U S A. 2002;99:15142–15147. doi: 10.1073/pnas.232565699. [DOI] [PMC free article] [PubMed] [Google Scholar]
- 18.Bouabe H, Liu Y, Moser M, Bösl MR, Heesemann J. The Journal of Immunology. 2011;187:3165–3176. doi: 10.4049/jimmunol.1101477. [DOI] [PubMed] [Google Scholar]
- 19.Bai Y, Wang Y, Goulian M, Driks A, Dmochowski IJ. Chem Sci. 2014;5:3197–3203. doi: 10.1039/c4sc01190b. [DOI] [PMC free article] [PubMed] [Google Scholar]
- 20.Kunth M, Witte C, Hennig A, Schroder L. Chem Sci. 2015 doi: 10.1039/c5sc01400j. [DOI] [PMC free article] [PubMed] [Google Scholar]
- 21.Bar-Shir A, Liang Y, Chan KWY, Gilad AA, Bulte JWM. Chem Commun. 2015;51:4869–4871. doi: 10.1039/c4cc10195b. [DOI] [PMC free article] [PubMed] [Google Scholar]
- 22.a) Riggle BA, Wang Y, Dmochowski IJ. J Am Chem Soc. 2015;137:5542–5548. doi: 10.1021/jacs.5b01938. [DOI] [PMC free article] [PubMed] [Google Scholar]; b) Klippel S, Döpfert J, Jayapaul J, Kunth M, Rossella F, Schnurr M, Witte C, Freund C, Schröder L. Angew Chem Int Edit. 2014;53:493–496. doi: 10.1002/anie.201307290. [DOI] [PubMed] [Google Scholar]
- 23.a) Bifone A, Song YQ, Seydoux R, Taylor RE, Goodson BM, Pietrass T, Budinger TF, Navon G, Pines A. Proc Natl Acad Sci USA. 1996;93:12932–12936. doi: 10.1073/pnas.93.23.12932. [DOI] [PMC free article] [PubMed] [Google Scholar]; b) Boutin C, Desvaux H, Carrière M, Leteurtre F, Jamin N, Boulard Y, Berthault P. NMR Biomed. 2011;24:1264–1269. doi: 10.1002/nbm.1686. [DOI] [PubMed] [Google Scholar]
- 24.a) Freeman MS, Emami K, Driehuys B. Physical Review A. 2014;90:023406. doi: 10.1103/physreva.90.023406. [DOI] [PMC free article] [PubMed] [Google Scholar]; b) Nikolaou P, Coffey AM, Walkup LL, Gust BM, Whiting N, Newton H, Barcus S, Muradyan I, Dabaghyan M, Moroz GD, Rosen MS, Patz S, Barlow MJ, Chekmenev EY, Goodson BM. Proc Natl Acad Sci U S A. 2013;110:14150–14155. doi: 10.1073/pnas.1306586110. [DOI] [PMC free article] [PubMed] [Google Scholar]
Associated Data
This section collects any data citations, data availability statements, or supplementary materials included in this article.