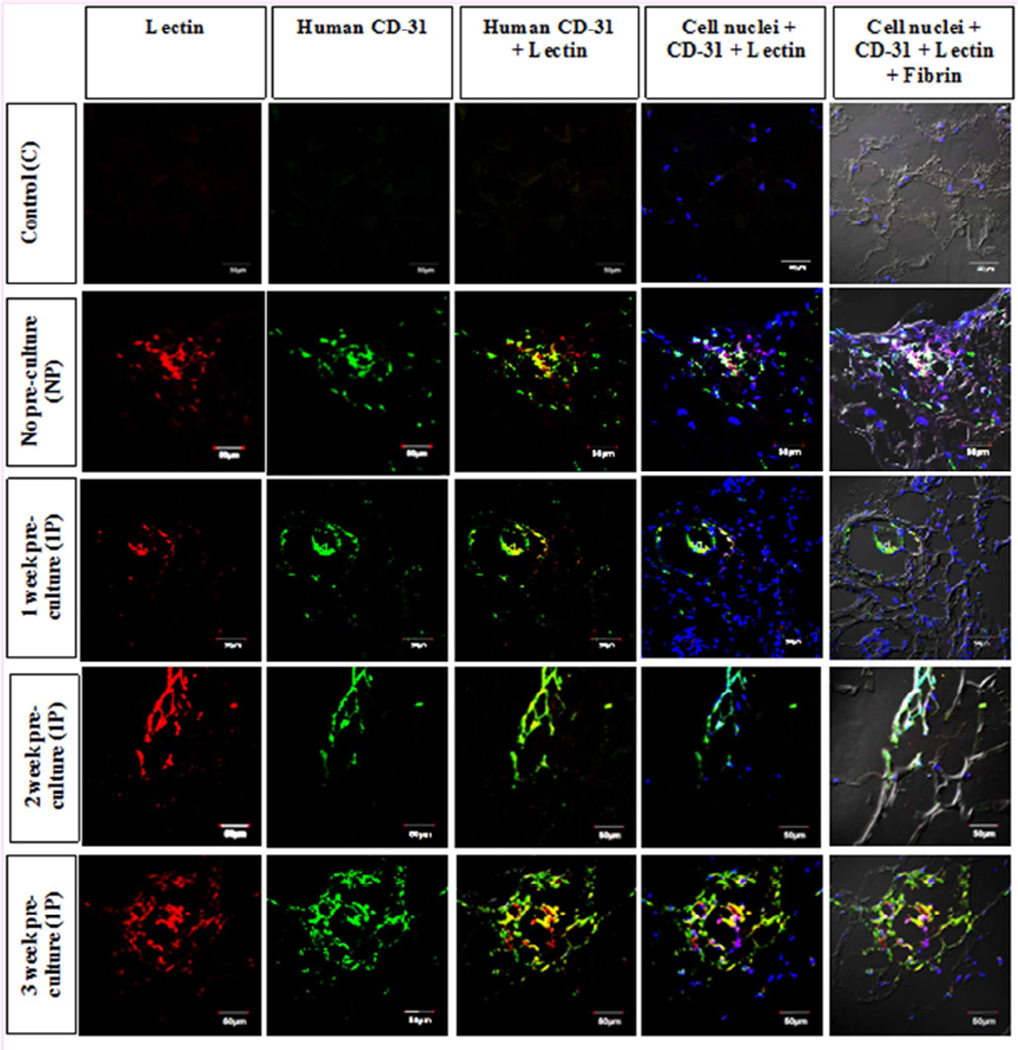
Figure 6.
Macroscopic and microscopic fluorescence analysis for lectin perfusion. (A) Analysis of the explanted scaffolds to quantify the total florescence radiant efficiency after lectin tail vein injection showing significantly (*p<0.05) higher fluorescence value (in photons s−1 cm−2 steradian−1 per µW cm−2) in the 3 week pre-culture (3P) group (4.22E+08±1.12E+08) as compared to the control (C) (1.53E+08±3.49E+07) group. Representative images of the C and 3P groups are shown to qualitatively demonstrate the difference in fluorescence. (B) Microscopic fluorescence analysis of the positive lectin staining of the vascular areas (red) along with the cell nuclei indicated by dapi staining (blue) at the fibrin area inside the scaffold shows the spreading and increase of vascular networks upon moving sequentially through the no pre-culture (NP), 1 week pre-culture (1P), 2 week pre-culture (2P) and 3 week pre-culture (3P) groups. Here, the control (C) group does not show any positive staining for lectin demonstrating the absence of vessels inside the scaffold. Scale bar for each image is 100µm.

