

Abstract
Background Given the greater uncertainty surrounding probability estimates associated with qualitative (use of words or phrases) descriptions, the use of quantitative (numerical) information to communicate the risks and benefits of therapies is recommended but the impact of its use in decision aids is unexplored.
Objective Using stroke prevention in atrial fibrillation as an example, to compare the impact of quantitative vs. qualitative descriptions of probability risk estimates in decision aids on the clinical decision‐making process.
Design Randomized trial with a 2 × 2 factorial design.
Subjects A total of 198 volunteers aged 60–80 years.
Setting Outpatient clinics of a university‐affiliated, tertiary‐care teaching hospital.
Methods Participants were asked to imagine that they had atrial fibrillation, and using a decision aid, were then randomized to two ways of receiving pertinent risk information regarding the probability of stroke and major bleeding when taking warfarin, aspirin or no therapy: (1) quantitatively, in which the 2‐year probabilities of stroke and major haemorrhage were presented both numerically and graphically with 100 faces (e.g. 8 of 100), and (2) qualitatively in which these probabilities were presented with the use of verbal phrases (e.g. very low, moderate).
Outcome measures Primary: decisional conflict. Secondary: participants' choices, knowledge and expectations of outcomes using qualitative and quantitative scales.
Results Participants reviewing quantitative risk information scored better on the informed subscale of the decisional conflict scale (P < 0.05) and, as expected, were better able to estimate numerically their chance of stroke and bleeding when taking warfarin, aspirin or no medication. For the low risk arm, there were no significant differences in treatment choices for the qualitative and quantitative groups. For the moderate risk arm, treatment choices between the two groups were significantly different (P = 0.01), with those in the quantitative group more likely to make an actual choice and to choose therapies at the extremes of effectiveness (warfarin and no treatment). There were no significant differences between the quantitative and qualitative groups in their ability to rank‐order their stroke risk when taking warfarin, aspirin and no treatment, overall knowledge about atrial fibrillation and its treatment, and other dimensions of decisional conflict (all P‐values >0.05).
Conclusions For participants without the disease in question, this study found that providing sufficient quantitative risk information makes them feel more informed, which sometimes affects their treatment choices. Further studies are necessary to confirm these findings for patients making actual clinical decisions.
Keywords: atrial fibrillation, decision aids, patient preferences
Introduction
Active involvement of patients in the clinical decision‐making process requires that physicians communicate the chance of pertinent outcomes to them. Physicians may provide this information qualitatively through use of words or phrases such as ‘most likely’, ‘frequent’ or ‘highly improbable’, or quantitatively by giving numerical probability estimates. 1 Previous work has demonstrated that both patients and physicians give wide ranges of numerical ratings for words and phrases that denote frequency or likelihood, although the relative meaning of the terms show consistent trends. 2 , 3 , 4 Given the impreciseness of these words and phrases, some authors have suggested that ‘verbal specifications of frequency have no place in medicine’. 5 Others take a less radical approach, suggesting that it is possible to systematically codify words and phrases denoting likelihood in an effort to enhance patient–physician communication. 6 , 7 , 8
Determining best practices for risk communication is particularly important when considering preventive options for conditions such as atrial fibrillation. Patients with atrial fibrillation are five times more likely to suffer a stroke than those without atrial fibrillation. 9 In randomized controlled trials, both warfarin and aspirin have been extensively studied regarding their efficacy to prevent stroke in patients with atrial fibrillation. 10 , 11 Warfarin is more efficacious than aspirin, but is associated with a greater likelihood of adverse effects (e.g. major haemorrhage) and is more inconvenient to use. Thus, the decision regarding whether to take warfarin, aspirin or neither depends upon the patients' understanding of the risks and benefits of the two medications, and how they value the trade‐off between the reduction in the likelihood of stroke and the increase in the likelihood of major haemorrhage. 12 , 13
We have previously developed and tested decision aids to help patients with atrial fibrillation to balance these risks and benefits. 14 , 15 When using these educational materials, we have always provided quantitative (numerical) descriptions of the probability of pertinent risks and benefits as have most other developers. 16 However, it is not known whether presentation of qualitative or quantitative expressions of probabilities for pertinent outcomes affects the decision‐making process of patients. Using stroke prevention in atrial fibrillation as an example, the objective of this study was to compare the impact of qualitative vs. quantitative descriptions of the probability of pertinent risks and benefits on participants' expectations of the likelihood of outcomes, decisional conflict (the amount of uncertainty regarding the course of action to take), actual choices and general knowledge of treatment options. Our hypothesis was that those reviewing quantitative information would be more able to make informed decisions that were associated with more realistic expectations and less decisional conflict.
Methods
The Research Ethics Committee of the Ottawa Hospital approved the study protocol.
Participants
One hundred and ninety‐eight volunteers aged 60–80 years without atrial fibrillation were recruited from the outpatient geriatric and medical clinics of the Ottawa Hospital. Once agreeing to participate, demographic information was collected for each participant, who then immediately reviewed one of two versions of a decision aid with subsequent completion of the outcome questionnaire.
Randomization
In a 2 by 2 factorial design, participants were randomized to one of four versions of the decision aid depending on whether the risk estimates were qualitative or quantitative and whether the level of stroke risk was low or moderate; (1) quantitative low stroke risk, (2) qualitative low stroke risk, (3) quantitative moderate stroke risk, and (4) qualitative moderate stroke risk.
Quantitative and qualitative versions of the decision aids
The decision aids were in an audiobooklet 17 (AB) format consisting of a 19‐page booklet, a 15‐min audiotape and a personal worksheet. The booklet highlighted pertinent points (similar to a slide presentation) with the audiotape guiding the participant through the booklet and connecting the points in a narrative fashion. The ABs contained descriptions of the consequences of a minor stroke a major stroke, and a major haemorrhage; and the possible inconveniences and side‐effects of taking warfarin or aspirin (e.g. the need to take medication daily, the blood monitoring required when taking warfarin). These descriptions have previously been extensively pilot tested for content and comprehensibility. 14
Quantitative and qualitative versions of the AB were produced (see Fig. 1 for example pages from each). In the qualitative version, these probabilities were presented with the use of verbal phrases (e.g. moderate risk). The specific terms that were used were determined following interviews with three family physicians and three internists regarding the words they use to describe the risk of stroke and bleeding.
Figure 1.
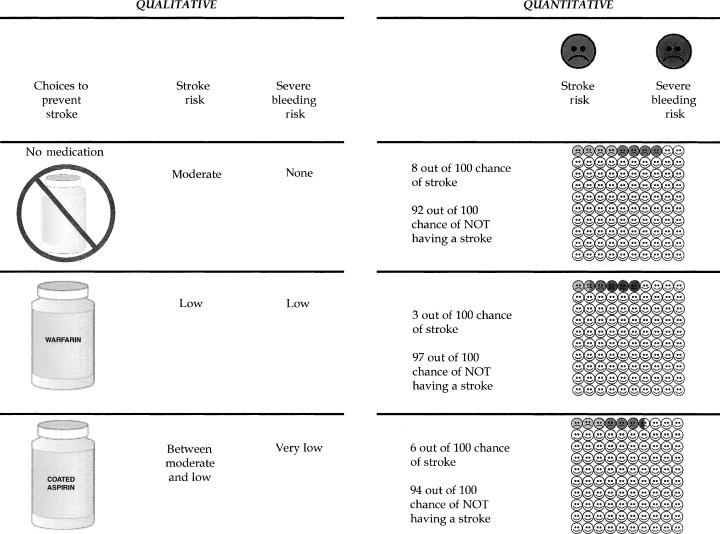
Example pages from qualitative and quantitative audiobooklets.
The quantitative version of the decision aid used in this study was similar to, but not identical to, one used in a previous study. 15 The 2‐year probabilities of stroke and major haemorrhage were presented using numbers (e.g. 8 of 100) accompanied by graphical depiction of 100 faces coloured to show the numerical chance of these events. Also, in order to assess whether the baseline risk of stroke affected participants' decision‐making process, versions of the qualitative and quantitative ABs were developed corresponding to a low (3% over 2 years) and moderate (8% over 2 years) risk of stroke when taking no antithrombotic therapy. Table 1 shows the qualitative and quantitative descriptions used for the two strata of stroke risk.
Table 1.
Quantitative (of 100) and qualitative descriptions of 2‐year probabilities of pertinent outcomes used in audiobooklets
| Chance of: | Stroke | Major bleeding | ||
|---|---|---|---|---|
| Quantitative | Qualitative | Quantitative | Qualitative | |
| Low stroke risk group | ||||
| No medication | 3 | Low | 0 | None |
| Warfarin | 1 | Very low | 3 | Low |
| Aspirin | 2 | Between low and very low | 0.5 | Very low |
| Moderate stroke risk group | ||||
| No medication | 8 | Moderate | 0 | None |
| Warfarin | 3 | Low | 3 | Low |
| Aspirin | 6 | Between moderate and low | 0.5 | Very low |
Outcome measures
Immediately after reviewing the AB, participants completed a questionnaire eliciting information about the following outcome measures (further details available on our website (http://www.lri.ca/programs/ceu/ohdec/measures.htm):
Primary outcome
-
•
Decisional conflict. The decisional conflict scale 18 (DCS) measured participants' uncertainty about which therapy to choose, modifiable factors contributing to uncertainty (such as feeling informed, clear about values and supported in decision‐making), and perceived effective decision‐making. A priori, the items of the informed subscale of the DCS were deemed to be the most sensitive to the presentation of qualitative or quantitative information. The scale was modified slightly to improve its applicability to the decision‐making regarding choice of antithrombotic therapy in atrial fibrillation. 15
Secondary outcomes
-
•
Choices. Participants were asked to indicate their choice of antithrombotic therapy along a 10‐cm line anchored at one end by ‘no antithrombotic therapy’ and ‘warfarin’ at the other, with ‘coated aspirin’ in the middle. Participants could also choose ‘unsure’.
-
•
Rank‐order of stroke risk. The responses of each participant's expectations of stroke risk were rank‐ordered according to their perception of the chance of stroke when taking no therapy, aspirin and warfarin. Persons were considered to have the correct rank‐order if they felt that their stroke risk was highest to lowest in the following order: when taking no therapy, aspirin and warfarin.
-
•
Knowledge. Knowledge was tested using 24 questions about atrial fibrillation, stroke and the advantages and disadvantages of taking warfarin or aspirin. These questions (e.g. ‘Taking warfarin means that you have to go for regular blood testing’) had the potential responses of ‘true’, ‘false’ and ‘unsure’.
-
•
Realistic expectations. Participants' expectations were elicited regarding their chances of stroke with no treatment, aspirin and warfarin, and their chances of major bleeding with aspirin and warfarin. Two different scales were used. The first was a verbal phrase (qualitative) scale with response items: very low; between low and very low; low; between moderate and low; moderate. The second scale was a numerical probability (quantitative) scale with 14 possible ranges starting from ‘0% to 0.5 of 100’ to ‘80–100 of 100’). Realistic expectations were defined as the ability to correctly choose within one category of the correct one. Examples of these scales are available on our website (http://www.ohri.ca).
Sample size
Prior to the initiation of the study, we believed that the informed subscale of the DCS would bethe most sensitive indicator of differences between the qualitative and quantitative groups and thus chose it as the basis upon which to calculate sample size. Using a 2 × 2 factorial design, in order to detect a difference of 0.40 units on the DCS based on an alpha and beta error rate of 0.05 and 0.20, respectively, a total sample size of 200 participants was necessary. This difference represents a meaningful behavioural difference, as it is the smallest difference observed between those who delayed and made decisions in previous studies. 16
Statistical analysis
For the qualitative and quantitative groups, differences in outcomes regarding decisional conflict, knowledge, expectations and choices were tested with chi‐square and t‐tests as appropriate. For the choice of medications, the analysis was further stratified by whether participants reviewed low or moderate stroke risk ABs. In order to identify the factors that were important determinants of participant treatment choices, a post hoc linear regression analysis was performed which included multiple demographic (those listed in Table 2), allocation group and response variables (qualitative and quantitativestroke and bleeding risk perceptions when taking no therapy, aspirin and warfarin; and decisional conflict scores).
Table 2.
Participant characteristics
| Quantitative group (n = 99) | Qualitative group (n = 99) | |
|---|---|---|
| Mean age (years) (SD) | 71 (7) | 71 (7) |
| Sex (% female) | 56 | 46 |
| Education (high school or greater) | 73 | 78 |
| Medical history of: | ||
| Atrial fibrillation | 0 | 0 |
| Stroke | 4 | 4 |
| Transient ischaemic attack | 6 | 8 |
| Myocardial infarction | 8 | 6 |
| Gastrointestinal bleeding | 5 | 3 |
| Medications for: | ||
| Hypertension | 33 | 32 |
| Diabetes | 4 | 7 |
| Angina | 8 | 10 |
| Ever taken warfarin | 8 | 4 |
| Ever taken aspirin regularly | 31 | 31 |
| Know others with: | ||
| Atrial fibrillation | 17 | 16 |
| Stroke | 82 | 81 |
| Gastrointestinal bleeding | 27 | 25 |
Results
Two hundred and forty‐two persons were approached for participation in the study, with 198 agreeing. No further information is available on those who refused participation.
All participants completed the interview process. Table 2 compares the demographic characteristics of participants in the qualitative and quantitative groups. The groups were well matched for all characteristics except for a 10% difference in the number of males and females. However, this difference had 95% confidence limits that overlapped with zero.
Primary outcome
Table 3 shows participants' decisional conflict scores. Those using the quantitative decision aids felt more informed than those using the qualitative decision aid. However, there were no statistically significant differences between the two groups with respect to feeling certain, clear about values, supported in decision‐making, or perceiving they had made effective decisions.
Table 3.
Participant decisional conflict after use of audiobooklet
| Quantitative | Qualitative | Difference (95% CI) | P‐value | |
|---|---|---|---|---|
| Mean DC Scale a score (SD) | ||||
| Total Scale | ||||
| Overall | 1.8 (0.5) | 1.9 (0.5) | −0.1 (−0.08, 0.24) | 0.89 |
| Subscales | ||||
| Feel uncertain | 2.0 (0.8) | 2.1 (0.8) | 0.1 (−0.15, 0.31) | |
| Feel uninformed | 1.6 (0.5) | 1.8 (0.5) | 0.2 (0.02, 0.31)* | |
| Feel unclear re. values | 1.9 (0.5) | 1.9 (0.7) | 0.0 (−0.08, 0.25) | |
| Feel unsupported | 2.1 (1.0) | 2.1 (0.9) | 0.0 (−0.23, 0.31) | |
| Effective decision | 1.8 (0.7) | 1.9 (0.7) | −0.1 (−0.09, 0.29) | |
Decisional Conflict Scale: scoring uses Likert scaling from 1 (low decisional conflict) to 5 (high decisional conflict). Overall scores of 2.0 and lower are associated with taking action on decisions.
95% confidence limits of differences do not overlap with zero.
Secondary outcomes
Participant choices regarding antithrombotic therapy are shown in Table 4. In all groups, whether at moderate or low risk of stroke, the majority chose to take aspirin. When comparing qualitative and quantitative groups, there was a statistically significant difference between treatment choices for the moderate risk arm (P = 0.01) but not the low risk arm. For the moderate risk arm, participants in the quantitative group were more likely to choose therapy at the extremes of effectiveness (warfarin or no therapy). Also, more persons in the qualitative group chose the options of aspirin and were ‘unsure’ than those in the quantitative group. Asexpected, given the greater absolute benefit of warfarin to prevent stroke, persons in the moderate risk arm were more likely to choose warfarin therapy, compared with persons in the low risk arm [12/98 (12%) vs. 4/100 (4%); P = 0.03].
Table 4.
Participant choices of antithrombotic therapy after use of audiobooklet
| Low risk group | Moderate risk group* | |||
|---|---|---|---|---|
| Quantitative n = 51 | Qualitative n = 49 | Quantitative n = 48 | Qualitative n = 50 | |
| Number choosing (%): | ||||
| Aspirin | 36 (71) | 33 (67) | 25 (52) | 32 (64) |
| Warfarin | 2 (4) | 2 (4) | 8 (17) | 4 (8) |
| No medication | 7 (14) | 7 (14) | 9 (19) | 2 (4) |
| Unsure | 6 (12) | 7 (14) | 6 (13) | 12 (24) |
Significant difference (P = 0.01) in choices between qualitative and quantitative groups.
Figure 2 shows the percentage of respondents in each of the four groups who were able to correctly rank‐order their chance of stroke when taking no therapy, aspirin and warfarin. The overall percentage of correct rank ordering of stroke risk was 48%. The use of a qualitative or quantitative AB made no significant difference in participants' ability to rank‐order their stroke risk in a quantitative or qualitative manner (all comparison P‐values >0.10).
Figure 2.
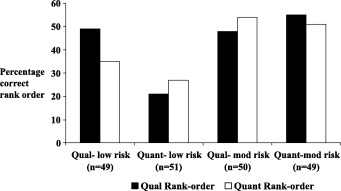
Qualitative and quantitative rank‐ordering of stroke risk when taking no therapy, aspirin and warfarin: the percentage of participants with correct rank‐ordering. Qual – qualitative, Quant – quantitative.
Table 5 compares participant knowledge. After reviewing their respective ABs, there were no significant differences between the qualitative and quantitative groups in their knowledge of pertinent information regarding atrial fibrillation, stroke and the use of warfarin and aspirin.
Table 5.
Participant knowledge after use of audiobooklet
| Correct Responses (%) (No. correct/Total answered) | |||
|---|---|---|---|
| Quantitative | Qualitative | P‐value | |
| Atrial fibrillation and stroke‐related (six questions) | 92 | 91 | 0.64 |
| Aspirin‐related (nine questions) | 66 | 66 | 0.91 |
| Warfarin‐related (nine questions) | 83 | 84 | 0.60 |
As expected, using the quantitative (numerical) scale, a significantly higher percentage of the participants using the quantitative ABs had realistic estimates of the numerical probabilities for all outcomes compared with those exposed to the qualitative ABs (all P‐values <0.01). For example, when estimating the chance of stroke while taking warfarin, 76 and 32% of the quantitative and qualitative groups gave correct answers, respectively. In contrast, using the qualitative scale, the differences between groups in estimating the correct verbal phrases describingtheir probabilities were much smaller, and not statistically significant (complete results available from the authors).
The linear regression analysis showed that three factors were associated with an increased preference for warfarin therapy; the absence of a history of gastrointestinal bleeding (P = 0.04), female gender (P = 0.02), and increased qualitative perception of the baseline risk of stroke (P = 0.002). In particular, previous use of warfarin did not enter the regression model because only 12 of the 199 participants had ever taken warfarin previously.
Discussion
In this study, we assessed whether the qualitative (verbal phrases) or quantitative (numbers and graphics) presentation of pertinent risk information affected the decision‐making process of volunteers who were asked to consider the need for antithrombotic therapy to prevent stroke from atrial fibrillation. Given the greater uncertainty regarding probability estimates associated with qualitative descriptions, we believed that those reviewing quantitative information would be more able to make informed decisions that were associated with less decisional conflict.
Study participants reviewing quantitative ABs had improved decisional conflict related to feeling informed, compared with those reviewing qualitative ones. There were no statistically significant differences in knowledge of options and outcomes other than probabilities of outcomes between the two groups. There were also no statistically significant differences between the qualitative and quantitative groups in their ability to correctly rank‐order their chance of stroke when taking warfarin, aspirin or no therapy. These results were expected as the information needed to answer the knowledge questions and rank‐order stroke risk were available in both decision aids. Also as was fully expected, study participants reviewing ABs with quantitative risk information were better able to quantitatively (numerically) estimate their chance of stroke and bleeding when taking warfarin, aspirin or no medication. Finally, the presentation of qualitative vs. quantitative information seemed to have a variable effect on actual treatment choices of participants, showing no effect in the low risk group and a significant effect in the moderate risk group.
Although the method of presenting numerical probabilities improved participant's understanding of risk information and feeling informed, it did not appear to affect other dimensions of decisional conflict. The lack of statistically significant effects on decisional conflict subscales of feeling supported and feeling clear about values are not surprising given that the interventions were comparably designed to address these dimensions of decisional conflict. The same lack of effect on the uncertainty subscale may have been the result of the low uncertainty scores, where there was little room to improve (floor effect).
The variable effect of qualitative vs. quantitative information on treatment choices is more difficult to explain. Previous studies have also shown that treatment choices are influenced by the baseline risk levels for the outcomes. 19 , 20 Thus, a possible explanation may lie in the different baseline risk of stroke in the low and moderate stroke risk strata.
For the low risk arm, it is possible that both the qualitative and quantitative groups perceived that their chance of stroke was ‘low’ and thus chose similar therapy. For the moderate risk arm, more persons in the quantitative group chose the options of warfarin and no treatment than those in the qualitative group. Thus, participants in the quantitative group were more likely to choose therapy at the extremes of effectiveness (warfarin or no therapy). Also, more persons in the qualitative group chose the options of aspirin and were ‘unsure’ than those in the quantitative group. Thus, there may have been variable individual interpretation of the significance of a ‘moderate’ (qualitative group) and ‘8% over 2 years’ (quantitative group) baseline chance of stroke. It is possible that those in the qualitative group were less able to evaluate the meaning of a ‘moderate’ risk of stroke. Therefore, their tendency was to be unable to make a decision or to choose the ‘compromise’ 21 therapy of aspirin. With those in the quantitative group receiving more precise information upon which to base their decision, they were more likely to have a firmer opinion on the significance of an 8% stroke risk. Thus, those who evaluated their baseline chance of stroke as significant chose warfarin, and those who did not, chose no therapy. This also led to more participants in this group being able to make a treatment choice and thus, fewer who were ‘unsure’.
The regression analysis demonstrated that one of the three factors associated with an increased preference for warfarin therapy was increased qualitative perception of the baseline risk of stroke, with quantitative perceptions of risk not being associated with participant choices. It appears that participants exposed to quantitative estimates of stroke and bleeding risks made qualitative judgements (e.g. low, very low, moderate) about these numerical estimates. They then used these qualitative estimates as the basis for their choices. Thus, in this study, the qualitative perceptions of probability were more powerful predictors than the quantitative ones. With these qualitative perceptions being roughly the same in both qualitative and quantitativegroups of the low risk arm, the lack of effect of the intervention on their choices may be explained.
The lack of impact of quantitative information on choice in the low stroke risk arm of this study does not necessarily mean that this information is not important in such clinical situations. Certainly, the use of only qualitative information in decision aids would make the patient presentation process simpler and more comparable with the usual patient education materials. However, it may be premature to conclude this for several reasons. First, the results of this study need replication with patients facing actual treatment decisions, in which baseline decisional conflict may be higher and risk perceptions more distorted. Secondly, creating realistic expectations of outcomes (even when it does not impact on choices) may provide reassurance value in situations where risks are commonly over‐estimated. For example, in our previous studies, we have found that patients with atrial fibrillation overestimate their risk of strokes, which may be a source of distress. In a study of women who were high risk for breast cancer, risk counselling, which moderated women's exaggerations of risk also reduced their distress from perceived risk. 22
This study has some limitations. Study participants were volunteers who did not have atrial fibrillation. They were asked to imagine that they had atrial fibrillation and used clinical vignettes, therefore they were not making ‘real‐life’ clinical decisions, and thus had little personal stake in the decisions they made. This may explain the overall low (≈50% correct responses) ability of patients to correctly estimate and rank‐order their stroke risk on different medications. Also, previous studies have found that treatment choices can differ between persons who have a disease and those who do not. 23 , 24 Thus, it is likely inappropriate to use the treatment choices of the study participants to guide patients with atrial fibrillation who are making real‐life treatment choices. Interestingly, however, the mean DCS scores of the participants reviewing quantitative ABs in this study were quite similar (and slightly lower) to those of another AB study 15 in which patients with AF made real‐life decisions about stroke prevention therapy. Additionally, decisional conflict was generally low and satisfaction generally high in both the quantitative and qualitative groups. Thus, there may have been little room for the presentation of quantitative or qualitative information to affect these outcomes.
In summary, this study demonstrates that, compared with the provision of qualitative information, providing sufficient quantitative risk information to allow individuals to make fully informed decisions improves their accuracy of risk perceptions, the comfort with feeling informed and may affect their actual choices. Further studies are necessary to confirm whether this study's findings are replicable in patients making actual clinical decisions and in other clinical situations, and to explore further the reassurance values of moderating exaggerated risk perceptions.
Acknowledgements
This study was funded by the Medical Research Council of Canada.
References
- 1. Kong A, Barnett GO, Mosteller F, Youtz C. How medical professionals evaluate expressions of probability. New England Journal of Medicine , 1986; 315: 740–744. [DOI] [PubMed] [Google Scholar]
- 2. Bryant GD, Norman GR. Expression of probability: words or numbers. New England Journal of Medicine , 1979; 302: 411. [DOI] [PubMed] [Google Scholar]
- 3. Cohn LD, Schydlower M, Foley J, Copeland RL. Adolescents' misinterpretation of health risk probability expressions. Pediatrics , 1995; 95: 713–716. [PubMed] [Google Scholar]
- 4. Mazur DJ, Hickam DH. Patients' interpretations of probability terms. Journal of General Internal Medicine , 1991; 6: 237–240. [DOI] [PubMed] [Google Scholar]
- 5. Nakoa MA, Axelrod S. Numbers are better than words. American Journal of Medicine , 1983; 74: 1061–1065. [DOI] [PubMed] [Google Scholar]
- 6. O'Brien BJ. Words or numbers? The evaluation of probability expressions in general practice. Journal of the Royal College of General Practice , 1989; 39: 98–100. [PMC free article] [PubMed] [Google Scholar]
- 7. Calman KC. Cancer: science and society and the communication of risk. British Medical Journal , 1996; 313: 799–802. [DOI] [PMC free article] [PubMed] [Google Scholar]
- 8. Calman KC, Royston GH. Risk language and dialects. British Medical Journal , 1997; 315: 939–942. [DOI] [PMC free article] [PubMed] [Google Scholar]
- 9. Wolf PA, Abbott RD, Kannel WB. Atrial fibrillation as an independent risk factor for stroke: the Framingham study. Stroke , 1991; 22: 983–988. [DOI] [PubMed] [Google Scholar]
- 10. Atrial Fibrillation Investigators . Risk factors for stroke and efficacy of antithrombotic therapy in atrial fibrillation. Archives of Internal Medicine , 1994; 154: 1449–1457. [PubMed] [Google Scholar]
- 11. Atrial Fibrillation Investigators. The efficacy of aspirin in patients with atrial fibrillation. Archives of Internal Medicine , 1997; 157: 1237–1240. [PubMed] [Google Scholar]
- 12. Gage BF, Cardinalli AB. Owen DK. Cost‐effectiveness of preference‐based antithrombotic therapy for patients with atrial fibrillation. Stroke , 1998; 29: 1083–1091. [DOI] [PubMed] [Google Scholar]
- 13. Protheroe J, Fahey T, Montgomery AA, Peters TJ. The impact of patients' preferences on the treatment of atrial fibrillation: an observational study of patient based decision analysis. British Medical Journal , 2000; 320: 1380–1384. [DOI] [PMC free article] [PubMed] [Google Scholar]
- 14. Man‐Son‐Hing M, Laupacis A, O'Connor A et al. Warfarin for atrial fibrillation. The patient perspective. Archives of Internal Medicine , 1996; 156: 1841–1848. [PubMed] [Google Scholar]
- 15. Man‐Son‐Hing M, Laupacis A, O'Connor AM et al. A patient decision aid regarding antithrombotic for stroke prevention in atrial fibrillation. Journal of the American Medical Association , 1999; 282: 737–743. [DOI] [PubMed] [Google Scholar]
- 16. O'Connor AM, Rostom A, Fiset V et al. Decision aids for patients facing health treatment or screening decisions: systematic review. British Medical Journal , 1999; 319: 731–734. [DOI] [PMC free article] [PubMed] [Google Scholar]
- 17. O'Connor AM, Tugwell P, Wells GA et al. Randomized trial of a portable self‐administered decision aid for postmenopausal women considering long‐term preventive hormone therapy. Medical Decision Making , 1998; 18: 295–303. [DOI] [PubMed] [Google Scholar]
- 18. O'Connor AM. Validation of a decisional conflict scale. Medical Decision Making , 1995; 15: 25–30. [DOI] [PubMed] [Google Scholar]
- 19. Eraker SA, Sox HC. Assessment of patients' preferences for therapeutic outcomes. Medical Decision Making , 1981; 1: 29–39. [DOI] [PubMed] [Google Scholar]
- 20. Hershey JC, Kunreuther HC, Schoemaker PJH. Sources of bias in assessment procedures for utility functions. Management Science , 1982; 28: 936–953. [Google Scholar]
- 21. Simonson I. Choice based on reasons: the case of attraction and compromise effects. Journal of Consumer Research , 1989; 16: 158–174. DOI: 10.1086/209205 [Google Scholar]
- 22. Lerman C, Schwartz MD, Miller SM, Daly M, Sands C, Rimer BK. A randomized trial of breast cancer risk counseling: interacting effects of counseling, educational level, and coping style. Health Psychology , 1996; 15: 75–83. [DOI] [PubMed] [Google Scholar]
- 23. Llewellyn‐Thomas HA, Thiel EC, McGreal MJ. Patients' evaluations of their current health state: the influence of expectations, comparisons, and actual health state. Medical Decision Making , 1992; 121: 115–122. [DOI] [PubMed] [Google Scholar]
- 24. Boyd NF, Sutherland HJ, Heasman KZ, Tritchler DL, Cummings BJ. Whose utilities for decision analysis? Medical Decision Making , 1990; 10: 58–68. [DOI] [PubMed] [Google Scholar]