

Abstract
Background A common and often integral method of delivering patient information is the use of patient guides. However, the acceptability, utility and impact of evidence‐based therapeutic guides on physicians, pharmacists and patients have not been well evaluated.
Methods This study was a prospective evaluation of 53 general practitioners' offices and 30 community pharmacies from three locations in Canada. Evidence‐based guides were provided to 1176 patients who presented to either a general practitioner or a community pharmacist and were interested in receiving information about sore throat, heartburn, or osteoporosis (http://www.ti.ubc.ca/canadadrugguide). The acceptability, utility and impact of the guides were assessed via structured patient telephone interviews, structured health professional interviews, and patient chart audits.
Results Eighty to 90% of patients reported that the guides were ‘very easy’ to understand. Fifty six per cent/47%/38% (sore throat/heartburn/osteoporosis) of patients rated the guides as ‘very’ or ‘extremely’ useful. Seventy‐two per cent/67%/58% of respondents reported that the information helped them make decisions about their treatment. Ninety eight per cent of physicians and 92% of pharmacists reported that the guides helped their patients understand the issues involved in their treatment. None of the analyses showed any significant differences in prescribing of medications between the intervention and control groups.
Interpretations Patients found these evidence‐based guides to be useful, easy to understand, and that they helped them in their understanding of treatment options and the decision‐making process. Physicians and pharmacists reported that the guides helped their patients understand the issues involved in their treatment. Further research is required to determine the degree to which providing evidence‐based guides to patients can impact on prescribing and patient outcomes.
Keywords: decision‐making guides, evidence based, heartburn, osteoporosis, sore throat
Introduction
One of the important health transitions presently underway is a greater involvement of patients in their treatment decision‐making. Given that, patients need and want more information about their medications and non‐drug therapies. A common and often integral method of delivering patient information is the use of patient guides. Unfortunately, it has been shown that information contained in patient guides is not always accurate. Slaytor and Ward showed that in 58 information guides on mammography, the benefits were reported inconsistently and were never presented as absolute risk reductions. 1 Patient guides have also been shown to contain inaccurate or misleading information, 2 and benefits are often emphasized while the risks of side‐effects are not. 3 While numerous patient guides have been developed, the acceptability, utility and impact of evidence‐based therapeutic guides have not been well evaluated. Evidence‐based guides should help a patient and health‐care provider engage in a meaningful discussion about the particular effects various treatment options could have on that patient's health. Patients have indicated that education about drugs should not only focus on specific drugs, but should also include explanations of disease aetiologies, self‐care information, drug and non‐drug treatment options, treatment risks and benefits, and comparative costs of treatments. 4 Further, therapeutic information should reflect the best available evidence of effectiveness, be accessible, comprehensible, useable and involve patients in its development. 4 For the above reasons, a study was designed to (1) test the feasibility of producing evidence‐based guides in lay language; and (2) assess the acceptability, utility and impact of these evidence‐based guides on physicians, pharmacists and patients.
Methodology
Creation of the evidence‐based guides
Three evidence‐based guides were developed to represent three different types of medical conditions: sore throat (acute symptomatic), heartburn (chronic symptomatic), and osteoporosis (chronic asymptomatic). The guide development phase of the project involved an extensive review of the available therapeutic evidence for each condition and the relevant literature on patient education. In addition, focus groups with patients, physicians and pharmacists in three Canadian provinces (British Columbia, Nova Scotia, and Ontario) were conducted. The focus groups helped determine the perceived general treatment information needs of patients, and those that were particular to these three medical conditions. 4 The focus groups also informed the development of the preferred format and method of delivery for the medication‐related information. The final guides were one page (double‐sided) in length and included information about the medical condition, patient self‐management, and prescription and non‐prescription therapeutic options including risks and benefits of those options. Final drafts of each guide were printed for dissemination to patients via physician offices and pharmacies and are available electronically at http://www.ti.ubc.ca/canadadrugguide.
Study sample
Family physicians and community pharmacists in Ontario, Nova Scotia and British Columbia, Canada were invited to participate in the study (Fig. 1). These practitioners or their staff were asked to recruit patients who presented with or were interested in receiving information about one of the three target conditions (sore throat, heartburn, or osteoporosis). Clinicians were asked to incorporate the evidence‐based guides into their practice and provide the guides to their patients. The Ethics Review Boards at each of the participating academic centres approved all evaluation protocols.
Figure 1.
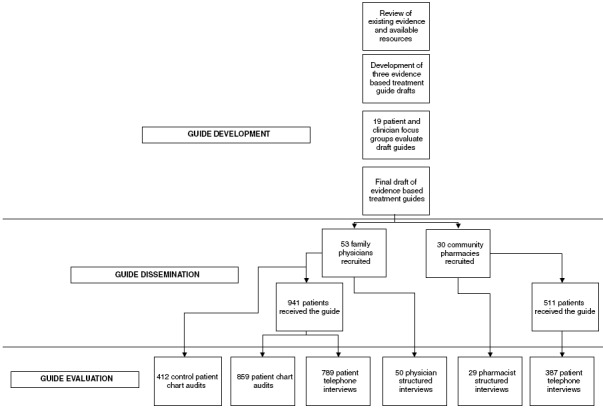
Flow diagram depicting the stages of guide development, dissemination and evaluation.
Patient recruitment was conducted between July 1999 and February 2000. Each site was asked to recruit 10 patients per target condition. A short form was attached to each guide and returned by fax to the coordinating offices on which the patient signed consent for a telephone interview and for access to their medical records (physician group only).
Patients recruited had to be able to read and speak English. The sore throat guide was restricted to those who were currently seeking treatment for a sore throat. If the patient was a minor and unable to give consent, a substitute/parent who agreed to the study was interviewed. The patient must have been seeking treatment for heartburn to receive the heartburn guide (women who were pregnant were excluded). The osteoporosis guide was limited to women over the age of 50 years, who were concerned about osteoporosis or had a personal or family history of osteoporosis. The three guides were distributed, one at a time, to each practising physician and in random order, so that physicians were recruiting patients for only one guide at a time. The guide was replaced by another once 10 patients were recruited for that condition. The next guide was added after 2 months, if the pratice had not reached its target of 10 patients for the initial condition. Pharmacies received all three guides at the same time. Once 10 patients were recruited for a particular guide, it was removed from the pharmacy.
Evaluation of the evidence‐based guides
The acceptability, utility and impact of the guides were assessed in three ways (Fig. 1). First, 1–10 days after receiving the guide from either a physician or a pharmacist, patients who had signed a consent received a phone call from a trained interviewer. The structured interviews consisted of a series of 27 questions pertaining to the guide they had received and to the decision‐making process they had used. Second, structured interviews were conducted with the physicians and pharmacists who participated in this study. Lastly, charts of patients who received the guide in a physician's office and a selection of control charts from the same physician's practice were reviewed by trained auditors using established criteria. To establish the control group, physicians selected three patients for each condition who were seen immediately prior to the period during which the guides were used. Differences in the charted prescriptions received by patients in the intervention group for each target condition were compared with prescriptions received by the control group. Charting of prescribing for antibiotics, non‐drug measures or over‐the‐counter products were examined in patients presenting to their physician for a sore throat; in the therapeutic use of H2 blockers, proton pump inhibitors, other antacids or gastroprotective agents, or non‐drug therapies for heartburn; and in calcium (plus or minus vitamin D), oestrogens or selective estrogen receptor modulators (SERMs), and bisphosphonates use for osteoporosis.
Statistical analysis
Using the SAS statistical package, mean, standard deviations, and proportions were used to describe the data obtained. The groups compared were Guide Users (GU) vs. non‐Guide Users (nGU). Current drug use (yes/no) was tabulated against group (GU vs. nGU) for previous drug use, non‐previous drug use, and then with both previous and non‐previous drug use combined. Fisher's exact test was used to test for the relation of current drug use (as recorded in the physician's office chart) and group affiliation. Previous drug use was considered an important variable to consider, as it was felt that people on drug therapy before the study would be strongly associated with being on the same drug therapy at the point when study outcomes were measured. Logistical regression was used to adjust for previous drug use. Numerous additional covariates (age, sex, seeing a specialist, symptoms present or absent, first visit, non‐drug measures tried, and investigative procedures performed) were tested in univariate analyses. However, none were statistically significant, and so they were not included in the final analysis.
Multiple linear regression using the Cochran test for linear trend was used in a two by three contingency table to determine the predictors of how useful or how influential (on the treatment decision) patients felt the guides were. The following independent variables were tested as predictors: new or recurring problem, sheet obtained from a physician/pharmacist versus their staff, how easy the information was to understand (on a five‐point scale), previously read about options prior to using the guide or not, guide added new information or not, and made a treatment decision with the physician/pharmacist or independently.
Odds ratios and 95% confidence intervals were computed to determine the odds of recording treatment options in the office chart if a patient received a guide compared with if a patient had not received a guide.
Results
Patient demographics
Table 1 outlines the demographics of the patients who were interviewed. Approximately two‐thirds of all patients interviewed received guides in their physician's office. The remaining one‐third of patients were given the guides while visiting a pharmacy.
Table 1.
Patient demographics
| Total no. | % who received guide in physician's office | % Female | Mean age (years) | |
|---|---|---|---|---|
| Sore throat | 406 | 68 | 79 | 40 |
| Heartburn | 358 | 68 | 63 | 52 |
| Osteoporosis | 412 | 65 | 99 | 60 |
Telephone interview results
Eighty‐one per cent of the 1452 patients were interviewed within 10 days of receiving the guide from their doctor or pharmacist. The following analysis is based on the results of the 1176 (81%) patients who completed interviews. Reasons for not being interviewed were as follows: patient was unreachable within 10 days, 173 (11.9%); inappropriate enrollment, 56 (3.9%); not willing to participate, 19 (1.3%); wrong telephone number, 12 (0.8%); number not in service, 5 (0.3%); patient away for greater than 10 days, 4 (0.3%); patient in hospital, 5 (0.3%); and patient too ill to be interviewed, 2 (0.1%).
How was the guide used?
The guide was discussed with the physician for 252 (32%) of the 789 patients who received the guide in the physician's office. The remaining 537 patients (68%) reviewed the information at home. Of the 387 patients who received the guides in pharmacies, 23% discussed the guide with the pharmacist, whereas 77% reviewed the guide at home. There were no differences amongst the different topic areas in how and where the guides were reviewed.
Were the guides useful and understandable?
Patients were asked to rate the guides on a five‐point scale ranging from ‘extremely easy/ useful’ to ‘not at all easy/useful’. Eighty to 90% of all patients (regardless of where they received and reviewed the guide) reported that the guides were ‘very easy’ to understand. Patients rated the sheet as ‘very’ or ‘extremely’ useful in 56% of the interviews for sore throat, 47% for heartburn and 38% for osteoporosis. Less than 10% of patients stated the information was ‘not useful at all’ (Fig. 2). Three variables were found to predict how useful patients reported the guides to be, and included: discussion of the guide with the physician or pharmacist (P < 0.0001); not previously having read about treatment options (P < 0.0001); and provision of new information (P < 0.0001).
Figure 2.
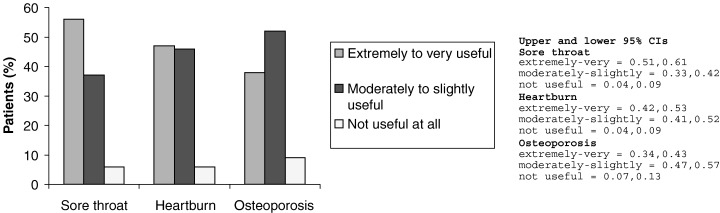
Patients’ rating of the usefulness of the evidence‐based guides.
How did the guide help?
Seventy‐two per cent (sore throat), 67% (heartburn) and 58% (osteoporosis) of respondents reported that the information helped them make decisions about their treatment. When asked how the guide was helpful, more than half (51–59%) reported that the guides gave them ‘treatment options and helped them make a treatment decision.’ A quarter of the respondents reported that the guide gave them a ‘greater knowledge or understanding about their condition’ whereas 23% (sore throat), 18% (heartburn) and 12% (osteoporosis) of patients stated that the guide ‘helped understand the clinician's reasoning’. Of the 400 patients (34%) who reported that the information sheet did not help them, approximately 90% indicated that this was because they were already familiar with the information.
Did the guide influence decision‐making?
When questioned as to the ‘degree the information influenced your [the patients’] decision about taking medication or treatment,’ 70% of sore throat, 62% of heartburn and 62% of osteoporosis patients reported that the guide exerted at least some influence on their decision (Fig. 3). Approximately 30–40% of patients reported that the guides had ‘no influence’ on their decision‐making. Regardless of the self‐reported degree of influence the guide had, at least half of the patients stated that they made their decision about treatment with their physician (49–61%), while 23–30% reported making their decision at home. Two variables were found to predict how influential the guide was on decision‐making: the easier the guide was to understand (P = 0.04) and not previously having read about treatment options (P < 0.0001). Additionally, those who discussed the guide with their physician or pharmacist found the guide to be of greater value to their decision‐making (P = 0.07). Seventy‐three per cent of the total guide users said that the main messages they learned from using the information guide was one of ‘treatment options’, ‘general information’ or ‘a greater understanding of their condition’.
Figure 3.
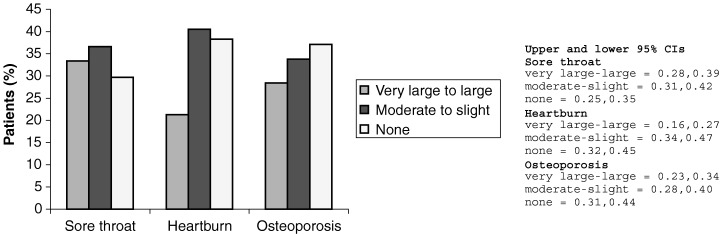
Degree to which the information influenced the patients’ decision about taking medication or treatment.
Structured clinician interview results
Interviews were conducted with 53 physicians and 30 pharmacists to obtain additional feedback on the conduct of the study, and to gather perceptions of the utility and value of the guides. Three physicians who did not recruit any patients or withdrew early from the study were interviewed, but these results are not included in this analysis. Twenty‐seven were face‐to‐face interviews and the remainder were conducted via telephone or faxed questionnaires. The structured interview results are presented in Table 2. Clinicians, in general, felt that the information guides helped their patients understand the issues involved in their treatment and that the level of reading was appropriate. Fifty‐three per cent of physicians thought that the information had an impact on their drug use and selection; i.e. their self‐reported behaviour was different as a result of using the sheet. Forty‐one per cent of pharmacists self‐reported that the guides impacted their drug selection. Thirty‐three per cent of physicians stated the guide impacted on their usual management whereas only 19% of pharmacists stated the guide impacted their management.
Table 2.
Structured interview results
| % who agreed with comment | ||
|---|---|---|
| Physicians (n = 50) | Pharmacists (n = 30) | |
| Guide helped patient understand issues related to treatment | 98 | 81 |
| Specific numbers were useful in helping patients understand issues related to treatment | 84 | 63 |
| Reading level was appropriate | 100 | 93 |
| Material in guide was too simple | 0 | 7 |
| Impacted usual management of patient | 33 | 19 |
| Impacted drug use and selection | 53 | 41 |
Chart audit results
Chart audits were conducted to determine if the guides had any impact on physician prescribing of medications. The charts of 859 guide patients and 412 control patients were audited in physicians’ offices. However, discussions of treatment options were only recorded in 20% of all patient encounters. This limited quantity of information was used to determine how the guide influenced patient care, including the choice of prescription or non‐prescription therapies, discussion of treatment options and the use of any relevant diagnostic tests. No significant differences in prescribing of medications between the intervention and control groups were detected. For example, 26.1% of patients receiving the guide were taking a bisphosphonate at the end of the study, compared with 25.4% of control patients (P = 0.81) and 9.6% of patients receiving the guide were taking proton pump inhibitors at the end of the study compared with 13.9% of the control patients (P = 0.29). In sore‐throat patients who received the guide, 34.5% had been given an antibiotic compared with 39.4% of patients who did not receive the guide (P = 0.61).
A record of treatment options was more likely to have been charted for heartburn patients who received a guide (18% vs. 10%) [OR 2.12 (95% CI, 1.11, 4.06) in favour of guide user]. However, chart recording of treatment options was no more likely for sore throat or osteoporosis guide users than for controls. For all three conditions combined, chart recording of the discussion of treatment options was no more likely in guide users than in control charts (21% vs. 17%).
Discussion
This study demonstrates that evidence‐based guides can be developed with the input of patient and clinician focus groups and can be disseminated to patients through physician offices or pharmacies. While the guides used graphs and absolute risk or benefit numbers to describe the results of published clinical studies, approximately 90% of patients interviewed stated that the guides were easy to understand and half stated that the guides were extremely or very useful. Fifty to 69% stated that the guides played a ‘moderate’ to ‘very large’ influence on their decision‐making process. None of the clinicians felt that the information was too complex for their patients.
Evaluating the impact of a guide on drug use is a complex issue. In this study, the majority of patients (60%) reviewed the guides at home rather than with their health‐care practitioner. This could have limited the potential for the guide to have an impact on treatment options. If the guide was discussed with the physician or pharmacist, patients rated the guide as more useful and also rated the guide as more influential in their own decision‐making. The fact that most patients reviewed the information at home may reflect health professional time constraints.
The health‐care professionals received an educational benefit from participation in this study as they read the information and became aware of the latest evidence for the management of the particular condition (regardless of whether or not they discussed it with the patient). It was not possible to determine whether physicians and pharmacists were able to use the evidence in their decision‐making process. For acute situations (sore throat), where the decision to treat and how to treat could be made relatively quickly, these sheets could be used at the time of the intervention. However, for chronic conditions, the guides could be used as supplemental information to be discussed at a future visit.
To expect a change in treatment recommendations is probably unrealistic. First, having evidence presented in an understandable fashion is only one part of the process of physician and patient decision‐making. Second, the information in the guide may simply reinforce an already appropriate treatment decision. In addition, the guides contained evidence rather than a direct recommendation, as would commonly be found in clinical practice guidelines. Regardless of whether or not prescribing changed, patients appeared to be better informed and felt that they played a part in the decision‐making process concerning their own management.
Only 20% of patient clinic encounters had treatment decision information recorded in the chart. Overall, recording was not influenced by the use of the guides or being involved in a study. The low occurrence of chart recording of actions such as the discussion of treatment options raises the methodological issue of chart audit as an outcome measure. Others have reported a similar experience. 5 Consistent under‐recording substantially underestimates the actual physician–patient interaction around a treatment decision. The small effect of the guides seen in this study may be explained by the presence of inadequately recorded decision‐making, but it is also possible that this intervention was of insufficient strength or duration to effect physician behaviour. The continuing education literature reports successful change is enhanced when physicians and patients both receive educational strategies. 6 Perhaps the provision of training for the health professionals on use of the guides and their content would have increased the effect of the guides.
Conclusions
This study was the first evaluation of a unique process of patient‐involvement in the development of evidence‐based guides that were subsequently disseminated in a primary‐care setting. Evidence‐based guides can be developed in this fashion and are of value to patients when distributed by clinicians in health‐care settings. Patients reported that the information was useful, easy to understand and that it helped in their understanding of treatment options and the decision‐making process. Based on chart review, which unfortunately provided only limited information, the guides did not appear to have a measurable impact on how drugs were recommended.
Acknowledgements
The authors would like to thank Gary Foster, PhD and Andrew Willan, PhD for their help with the statistical analysis of the data.
References
- 1. Slayter EK, Ward JE. How risks of breast cancer and benefits of screening are communicated to women: analysis of 58 pamphlets. British Medical Journal, 1998; 317: 263–264. [DOI] [PMC free article] [PubMed] [Google Scholar]
- 2. Smith H, Gooding S, Brown R, Frew A. Evaluation of readability and accuracy of information leaflets in general practice for patients with asthma. British Medical Journal, 1998; 317: 264–265. [DOI] [PMC free article] [PubMed] [Google Scholar]
- 3. Coulter A. Evidence based patient information. British Medical Journal, 1998; 317: 225–226. [DOI] [PMC free article] [PubMed] [Google Scholar]
- 4. Nair K, Dolovich L, Cassels A et al. What do patients want to know about their medications: Focus group study of patient and clinician perspectives. Canadian Family Physician, 2002; 48: 104–110. [PMC free article] [PubMed] [Google Scholar]
- 5. Mann KV, Lindsay EA, Putnam RW, Davis DA. Increasing physician involvement in cholesterol‐lowering practices. Journal of Continuing Education in the Health Professions,1996; 16: 225–240. [DOI] [PubMed] [Google Scholar]
- 6. Davis DA, Thomson MA, Oxman AD, Haynes RB. Changing physician performance. A systematic review of the effect of continuing medical education strategies. Journal of American Medical Association, 1995; 274: 700–705. [DOI] [PubMed] [Google Scholar]