

Abstract
Introduction In order to facilitate informed decision making, women require information on the probabilities of different outcomes with mammography screening. This paper derives these probabilities for a US population and illustrates them visually in a readily understandable format.
Methods Probabilities of the breast cancer mortality, all cause mortality and further investigation are derived from published data on mortality from breast cancer and published estimates of effectiveness using a life‐table method. Probabilities are calculated of surviving to age 75 from age 40 with and without two‐yearly mammography screening from age 40 and age 50. Probabilities are also calculated that a woman will be referred for further assessment or biopsy or die from breast cancer despite screening. To avoid being misled, these outcomes are presented in the form of a single decision aid illustrating the outcomes for 1000 women choosing each alternative: mammography screening or no mammography screening.
Results Of 1000 women undergoing two‐yearly mammography screening from age 40 an additional four (3.7 per 1000) will reach the age of 75; of the survivors 514 will be referred for further investigation and 138 will undergo biopsy. Of 1000 women screened from age 50 an additional three (3.3 per 1000) will reach age 75; of the survivors 408 will be referred for further investigation and 94 will undergo biopsy. Mammography from age 40 to 49 reduces mortality by 0.4 in 1000. This information is readily presented visually.
Conclusions It is possible to provide realistic estimates of the effects of mammography screening on mortality in a readily understandable format. Women require this information if they are to make informed choices about mammography screening.
Keywords: breast cancer, informed consent, mass screening, patient information
Introduction
The American Medical Association recommends annual mammography screening for all women aged 40 and older. 1 However it emphasizes the need for the decision to take place in the context of an informed discussion between physician and patient. In other words, women should make an informed decision. The American Medical Association guidance on informed decision making indicates that consent can only be exercised when the patient possesses enough information to make an intelligent choice; that she should make her own determination; and that the physician's duty is to present the medical facts accurately and not to withhold information that might influence the decision. 2 Legal guidance is even more explicit: patients should be told the nature of the procedure and of treatment alternatives (including no treatment). For all the alternatives, the risks and benefits should be shown. 3
This guidance clearly applies to mammography screening. Healthy adults offered screening are undoubtedly competent to make their own judgements. Nevertheless, commentators have expressed concern about the degree to which women are adequately informed about mammography screening. 4 It has been observed that educational efforts mainly focus on persuading people to be tested rather than informing them of the trade‐offs involved. 5 Information provided is often incomplete. Information produced to help women decide whether to undergo breast cancer screening is not always helpful. The American Academy for Family Physicians’ leaflet for women aged 40–49 correctly estimates the benefits of the screening in this age group but does not use decision aids. 6 American Cancer Society information includes no numerical information on the benefits of screening, scant information on false positives and no visual decision aids. 7 The National Cancer Institute's information includes no numerical information on benefits or risks. 8 The University of California at San Francisco's information is much more complete, including numerical estimates of risks and benefits and representing some of these visually. 9 However even this information fails to display both risks and benefits in the same decision aid and fails to distinguish between preventing breast cancer mortality and additional survival. As one‐quarter of women die from other causes before the age of 75, not all women whose death from breast cancers is prevented will survive to 75.
Knowledge about mammography screening
When asked, women tend to overestimate both their risk of breast cancer and the benefits of mammography screening. 10 , 11 In one study the combination of these errors overestimates the absolute benefits of mammography screening by a factor of 100. 10 In a survey across four countries most women estimated that screening 1000 women for 10 years would prevent at least 40 deaths. 12 Women who overestimate the benefits of screening are more likely to attend for screening. 11
Information requirements for informed consent
What information should health professionals give to women regarding risks and benefits of mammography screening? Health professionals should indicate the alternatives (to participate or not to participate in the programme) and based on the best available current evidence, the prognosis with and without participation. This means offering women numerical information they can understand. Evidence suggests that risk information should be presented through the use of decision aids as these improve knowledge, encourage realistic expectations of the benefits and harms of options, increase patient involvement in decisions and reduce decisional conflict from feeling uninformed. 13 There is a degree of consensus about how risk information should be presented, in order to be more meaningful for the public. 14 Evidence suggests that the use of relative risks rather than absolute risks increases the tendency of lay people to accept screening, 15 or medication, 16 , 17 and of clinicians to recommend treatment. 18 Absolute risks should therefore be given more prominence than relative risks. The effects of the decision over the individual's lifetime should be presented rather than the effects in the next few years. The way in which information is framed also influences the decisions people reach. Reductions in losses (e.g. decrease in mortality from 6% to 4%) are more persuasive than increases in gains (e.g. increase survival from 94% to 96%). The influence of framing can be minimized by presenting risks of both gains (e.g. survival) and losses (e.g. mortality). Individuals tend to find it easier to understand data presented in the form of integers (e.g. three in 10 people) rather than probabilities (e.g. 30% of people).
Presenting information on breast cancer screening
The aim of mammography screening is to reduce premature death from breast cancer. This is therefore the primary outcome of interest to women. Another possible benefit of screening is a reduction in the need for mastectomy. The adverse consequences of mammography screening include unnecessary referral for further investigation (false positives) and death from breast cancer despite screening. Breast cancer deaths in screened women may be the result of interval cancers, screen detected cancer having a poor prognosis or cancer predating screening. Further investigation includes assessment by a specialist and surgical biopsy. Increase in probability of referral and biopsy are therefore also outcomes of interest to women. A further possible disadvantage of screening is a longer period of time with a diagnosis of cancer (due to lead time bias).
In relation to mammography screening it is simplest to think of a woman as facing two separate questions at two distinct ages. The first is whether to undergo screening from age 40. If she decides not to undergo screening from age 40 she faces a second question: whether to undergo screening from age 50. This paper calculates probability of death and probability of false‐positive results to the age of 75 for an individual woman aged 40 with and without two‐yearly mammography screening from age 40 and from age 50.
Based on effective techniques for encouraging informed decision making, the paper illustrates these outcomes in a way that is likely to be understood. These allow easy visual comparison of the effects of participating and not participating in mammography screening.
Methods
Effectiveness of mammography screening programmes
Estimates of the effectiveness – reduction in breast cancer mortality – of screening vary considerably. A small but sceptical minority of opinion has cast doubt on the evidence of effectiveness. 19 A more enthusiastic consensus has concluded that there is a reduction in breast cancer mortality of about one‐third. 20 Most estimates of effectiveness lie between these two extremes. The US Preventive Services Task Force concluded that relative risk of death from breast cancer with mammography screening is 0.85 for women aged 40–49 (followed up for 14 years) and 0.84 for women aged 40–74. 21 This is taken as an estimate of the effectiveness of current US screening policies.
Efficacy of screening
The effectiveness of any screening programme is the product of the efficacy of screening and the programme coverage rates. A programme with 100% coverage could be expected to detect proportionately more treatable cancers and therefore prevent proportionately more deaths. Therefore for an individual woman participating fully in the programme the efficacy of screening is calculated by dividing the estimated effectiveness of mammography screening by the average programme coverage rate and multiplied by the expected coverage rate with 100% participation. Age specific coverage rates for mammography screening were obtained from national data sources. 22 As there is a lag time between screening and its effect on mortality, coverage rates from 1994 were used for the analysis.
Breast cancer and all‐cause mortality rates
Age‐specific breast cancer mortality rates and all‐cause mortality rates were obtained from published sources. 23 Mammography screening is assumed only to affect breast cancer mortality. The expected breast cancer mortality rates without a screening programme were calculated as follows. Current breast cancer mortality rates were divided by the effectiveness of breast cancer screening. This represents the probability that a woman would die from breast cancer if she did not participate in mammography screening. The all‐cause mortality rate for a woman not participating in screening is the sum of her ‘all cause except breast cancer’ mortality rate and her expected breast cancer mortality rates without screening.
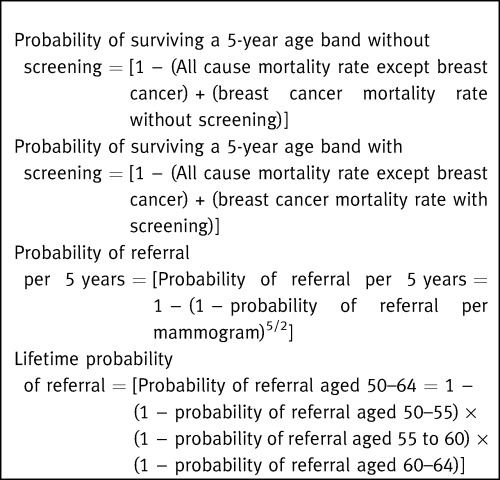
The probability that a woman would die from breast cancer if she fully participated in mammography screening was calculated by multiplying the probability of dying without mammography screening by the efficacy of screening with 100% uptake. The all‐cause mortality rate for a woman fully participating in screening is the sum of her ‘all cause except breast cancer’ mortality rate and her expected breast cancer mortality rates with screening (Box 1).
Figure Box 1.
False‐positive referral for assessment and biopsy
The probability that following mammography a woman will be referred for assessment or undergo biopsy varies with age. The referral rate and biopsy rate per mammogram were obtained from published National Breast and Cervical Cancer Early Detection Program (NBCCEDP) data. 24 Rates of cancer detection were subtracted from the referral rates to determine false‐positive referral rates. Referral rates are higher after the first mammogram than after subsequent mammograms.
Current recommendations are that mammography is carried out at one or two yearly intervals. 25 Each woman has two to three mammograms (5/2) in each age band. The rate of referral in a given 5‐year age band is therefore the rate of referral per mammogram adjusted for the number of mammograms she would have whilst in that age band. Lifetime probability of referral is calculated in a similar way (Box 1).
Data presentation
Cumulative outcomes to age 75 are presented as bar charts and showing the expected outcomes for 1000 women fully taking part and not taking part in screening. Bar charts show the numbers of women likely to survive without further investigation; numbers likely to survive but to be referred for assessment at least once; numbers likely to survive but to undergo biopsy at least once; numbers likely to die.
Results
Table 1 shows the age‐specific effectiveness (reduction in breast cancer mortality) of mammography screening from age 40 upwards. Table 2 shows the effectiveness of full participation in screening (the mortality reduction possible with 100% coverage) and the cumulative probability of a woman surviving each age band with and without screening. The cumulative probability of surviving from age 40 to 75 is the product of the probabilities of surviving each age band.
Table 1.
Effectiveness of the current mammography screening programme and the efficacy of a programme with full coverage
| Cell number | Age band | Relative risk of breast cancer mortality attributable to current programme | Coverage in this age band (%) | Relative risk of breast cancer mortality in this age band with 100% coverage | ||
|---|---|---|---|---|---|---|
| Current programme | With 100% coverage | Without screening | ||||
| A | B | C | D | E = 1−[(1−A) / (B × C)] | ||
| 1 | 40–44 | 1.0000* | 61.3 | 100 | 0 | 1.0000 |
| 2 | 45–49 | 0.8500 | 61.3 | 100 | 0 | 0.7553 |
| 3 | 50–54 | 0.8400 | 66.5 | 100 | 0 | 0.7594 |
| 4 | 55–59 | 0.8400 | 66.5 | 100 | 0 | 0.7594 |
| 5 | 60–64 | 0.8400 | 66.5 | 100 | 0 | 0.7594 |
| 6 | 65–69 | 0.8400 | 63.0 | 100 | 0 | 0.7460 |
| 7 | 70–74 | 0.8400 | 63.0 | 100 | 0 | 0.7460 |
*Screening has no effect on mortality for first 5 years
Table 2.
Mortality with the current mammography screening and the efficacy of full participation in mammography screening
| Cell number | Age band | Breast cancer mortality rate (per 5 years) | Mortality rate due to all other causes (except breast cancer) | Cumulative survival to the end of this age band | ||||
|---|---|---|---|---|---|---|---|---|
| Current programme | With 100% coverage | No screening programme | Current programme | With 100% coverage | No screening programme | |||
| F | G = H × E* | H = F/A* | I | J = Cumulative product [1 − (F + I)] | K = Cumulative product [1 − (G + I)] | L = Cumulative product (1 − (H + I)] | ||
| 1 | 40–44 | 0.000815 | 0.000815 | 0.000815 | 0.007771 | 0.9914 | 0.9914 | 0.9914 |
| 2 | 45–49 | 0.001339 | 0.001190 | 0.001575 | 0.011308 | 0.9789 | 0.9790 | 0.9787 |
| 3 | 50–54 | 0.002043 | 0.001847 | 0.002432 | 0.017151 | 0.9601 | 0.9605 | 0.9595 |
| 4 | 55–59 | 0.002702 | 0.002443 | 0.003216 | 0.027576 | 0.9311 | 0.9317 | 0.9301 |
| 5 | 60–64 | 0.003326 | 0.003007 | 0.003958 | 0.044940 | 0.8863 | 0.8871 | 0.8847 |
| 6 | 65–69 | 0.004009 | 0.003561 | 0.004771 | 0.070296 | 0.8206 | 0.8218 | 0.8185 |
| 7 | 70–74 | 0.004940 | 0.004389 | 0.005879 | 0.109046 | 0.7275 | 0.7289 | 0.7249 |
*A and E from Table 1
With full participation in mammography screening from age 40, a woman reduces her risk of dying from any cause by age 75 from 275 to 271 per 1000: a relative risk of 0.986. Approximately one‐quarter of women who avoid breast cancer mortality die from other causes before age 75, therefore reductions in breast cancer mortality are greater than reductions in total mortality. Risk of breast cancer mortality by age 75 is reduced from 22 (rounded from 22.4) to 17 (rounded from 17.1) per 1000: a relative risk of 0.763. Despite screening, therefore, 17 per 1000 women therefore die from breast cancer before age 75.
If she fully participates in mammography screening from age 50 onwards, a woman of 40 reduces her risk of dying by age 75 from 275 to 272 per 1000: a relative risk of 0.988. She reduces her risk of breast cancer mortality from 22 (rounded from 22.4) to 19 (exactly) per 1000: a relative risk of 0.848. Despite screening therefore, 19 per 1000 women will die from breast cancer by age 75.
Table 3 shows the false‐positive referral rate with mammography. By the age of 75, of 1000 women undergoing mammography from age 40, a total of 514 will have been referred at least once for further investigation. Table 4 shows the false‐positive biopsy rate with mammography. By age 75, of 1000 women undergoing mammography from age 40, 138 will have undergone biopsy without subsequently being diagnosed with breast cancer. Only 214 women will survive to age 75 without having undergone some unnecessary investigation. The probabilities of the principal outcomes are illustrated in Fig. 1.
Table 3.
Referral rates for assessment with 100% mammography uptake
| Age band | Mammograms in this age band A | Survival rate for this age band B | Cumulative probability of survival C | Referral rate per mammogram D | Probability of survival without referral in this age band E = B × (1−D)A | Cumulative probability of survival without referral F | Cumulative probability of survival with referral G = C − F |
|---|---|---|---|---|---|---|---|
| 40–44 | 2.5 | 0.9914 | 0.9914 | First screen 0.1191 Subsequently 0.0772 | 0.7742 | 0.7742 | 0.2172 |
| 45–49 | 2.5 | 0.9875 | 0.9790 | 0.0772 | 0.8078 | 0.6254 | 0.3536 |
| 50–54 | 2.5 | 0.9810 | 0.9605 | 0.0772 | 0.8025 | 0.5019 | 0.4586 |
| 55–59 | 2.5 | 0.9700 | 0.9317 | 0.0665 | 0.8167 | 0.4099 | 0.5218 |
| 60–64 | 2.5 | 0.9522 | 0.8871 | 0.0633 | 0.8086 | 0.3314 | 0.5557 |
| 65–69 | 2.5 | 0.9263 | 0.8218 | 0.0466 | 0.8222 | 0.2725 | 0.5493 |
| 70–74 | 2.5 | 0.8870 | 0.7289 | 0.0466 | 0.7872 | 0.2145 | 0.5144 |
Source: D: Smith‐Bindmann et al. 24 .
Cumulative probability of survival with referral declines after age 65 because the probability of survival declines significantly after this age.
Table 4.
Biopsy rates with 100% mammography uptake
| Age band | Mammograms in this age band A | Survival rate for this age band B | Cumulative probability of survival C | Biopsy rate per mammogram D | Probability of survival without biopsy in this age band E = B × (1−D)A | Cumulative probability of survival without biopsy F | Cumulative probability of survival with biopsy G = C − F |
|---|---|---|---|---|---|---|---|
| 40–44 | 2.5 | 0.9914 | 0.9914 | First screen 0.0261 Subsequently 0.0142 | 0.9451 | 0.9451 | 0.0464 |
| 45–49 | 2.5 | 0.9875 | 0.9790 | 0.0142 | 0.9528 | 0.9005 | 0.0786 |
| 50–54 | 2.5 | 0.9810 | 0.9605 | 0.0142 | 0.9466 | 0.8524 | 0.1081 |
| 55–59 | 2.5 | 0.9700 | 0.9317 | 0.0105 | 0.9448 | 0.8053 | 0.1264 |
| 60–64 | 2.5 | 0.9522 | 0.8871 | 0.0103 | 0.9278 | 0.7472 | 0.1399 |
| 65–69 | 2.5 | 0.9263 | 0.8218 | 0.0076 | 0.9088 | 0.6791 | 0.1427 |
| 70–74 | 2.5 | 0.8870 | 0.7289 | 0.0076 | 0.8702 | 0.5909 | 0.1380 |
Source: D: Smith‐Bindmann et al. 24
Cumulative probability of survival with referral declines after age 70 because the probability of survival declines significantly after this age.
Figure 1.
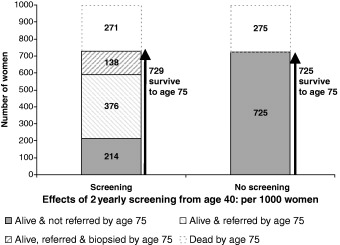
Outcomes from age 40 to age 75 for 1000 women with and without mammography screening from age 40.
For 1000 women undergoing mammography from age 50 a total of 408 will have been referred at least once for further investigation and 94 will have undergone biopsy. This is illustrated in Fig. 2.
Figure 2.
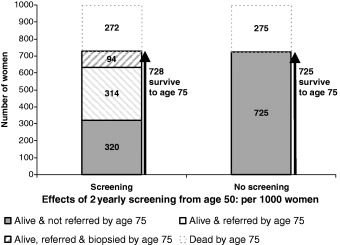
Outcomes from age 40 to age 75 for 1000 women with and without mammography screening from age 50.
Compared with mammography screening from age 50, screening from the age of 40 results in a greater probability of surviving to age 75 and a greater probability of referral for further investigation. The additional probability of survival to age 75 is the incremental benefit of mammography screening from age 40 to 49. The additional probability of referral for further investigation is the incremental hazard of mammography screening from age 40 to 49. Undergoing mammography from age 40 to 49 has an incremental survival benefit to age 75 of 0.4 per 1000 women. Mammography from age 40 to 49 prevents 0.6 an additional breast cancer deaths per 1000 women. Per 1000 women, the incremental hazard is an additional 106 at least once referred for further investigation and an additional 44 undergoing biopsy.
Sensitivity analysis
Estimates of the benefits of treatment are sensitive to assumptions about the effectiveness of treatment. A more favourable assumption about effectiveness is that the relative risk of breast cancer mortality with current screening practice is 0.75. This means that with full compliance, relative risk of breast cancer is 0.60–0.62: similar to that predicted by the International Agency for Research on Cancer analysis. 20 Under these assumptions, an additional 6.5 per 1000 women reach 75 with screening from age 40 (729.4 with and 722.9 without screening). With screening from the age of 50 years, an additional 5.7 per 1000 women reach 75 with screening from age 40 (728.7 with and 722.9 without screening). The incremental increase in survival to age 75 with screening from age 40 is 0.8 per 1000 women. With no screening there are 25.0 deaths from breast cancer, with screening from age 50 there are 17.4, with screening from age 40 there are 15.7. The numbers referred for further investigation or for biopsy do not change much under these assumptions. In effect, a favourable estimate of effectiveness increases the net benefit of screening by two or three women per 1000.
There is also uncertainty about the length of time that women must undergo screening before it reduces mortality. If screening becomes effective after 10 years, rather than 5 years, the impact on survival to age 75 is negligible. The difference between screening from age 40 and from age 50 also changes little. However if this longer lag time only applies to women under 50, the incremental benefits of screening early largely disappear.
The method for calculating referral and biopsy rates assumes that probability of referral is independent of previous screening history. The effects of changing this assumption are explored by adjusting referral rates according to a different set of assumptions. If referral rates are independent of prior screening history 514 women in every 1000 have at least one false‐positive referral (376) or biopsy (138). If referral rates are twice as high in women with previous false positives the number falls to 430 (rounded up from 429.6): 303 referrals and 126 biopsies. If referral rates are three times as high in women with previous false positives the number falls to 374: 256 referrals and 118 biopsies. The assumption of independence therefore makes some difference to the false‐positive referral rate, but little difference to the biopsy rate.
Discussion
Strengths
The model uses the most recent and locally appropriate estimates of both the advantages and disadvantages of participating in mammography screening. The approach allows information about an individual's absolute risk of a range of outcomes to be presented visually. Including an estimate of all‐cause mortality by age 75 puts the probability of death from breast cancer into perspective. This offers a more complete picture of the outcomes of screening than an estimate of relative risk reduction for breast cancer mortality, reducing the possibility of misinterpretation. The method of visual presentation is similar to a previously piloted and tested method for presenting information on prevention of heart disease. 26 Nevertheless it needs to be piloted in its own right.
Effectiveness
Estimates of effectiveness are constrained by the available data. The estimate of mortality reduction in women 40–49 years of age may be generous. Other reviews have produced less favourable estimates of effectiveness. 27 The estimate used here is based on 14 years of follow up 21 but risk reduction over 10 years may be considerably less. 28 One interpretation of the data is that there may be net harm in the first 7 years of screening. 29 A further complication is that as the treatment of breast cancer advances, survival rates improve. As a result the potential for screening to reduce breast cancer mortality decreases.
Because of the genuine disagreement about the effectiveness of screening, the most ethically defensible course for a clinician concerned about informed decision making is to state the estimate of effectiveness that they believe. The estimated effects in the sensitivity analysis correspond to relative risks of 0.696 with screening from age 50 and 0.627 from age 40 respectively. In my view these are over‐generous. I take this view because they are somewhat better than the effects predicted by a discrete event simulation‐based epidemiological model of breast cancer epidemiology and treatment. This model predicts that screening results in relative mortality risks of 0.690 (from age 40) and 0.790 (from age 50). 30 Nevertheless, under any set of assumptions, between 70 and 140 women undergo further investigation for every one who benefits. The number is very unlikely to be less than 50 or more than 200.
False positives
False‐positive rates may be underestimated in women below 50 years. This is because the efficacy of two‐yearly screening may be considerably lower than that of annual screening in women 40–49 years. 31 To achieve the benefits described here may therefore require annual mammography – with a consequent doubling of false‐positive rates.
The false‐positive referral and biopsy rates per mammogram used in this model for women aged 40–49 are in fact derived from those reported by the NBCCEDP for women aged 50–59. Those for women aged 65–74 are reported by the NBCCEDP for all women 65 and over. False‐positive rates are higher for younger women and decline with age. 32
Women with previous breast biopsies have a higher probability of referral after subsequent mammograms. 33 Sensitivity analysis shows that the false‐positive rate is not very sensitive to assumptions about how screening history affects the false‐positive rates. It has been reported that the cumulative probability of a false‐positive referral for further investigation is 0.562 after 10 mammograms. 33 Using the method outlined here, a woman's cumulative probability of referral is 0.522 after 10 mammograms. (Table 3) It has also been reported that the cumulative biopsy rate is 0.186 after 10 mammograms. Using the method outlined here the cumulative probability of biopsy is 0.126 after 10 mammograms. This suggests the estimates provided here are reasonable.
This analysis could be improved by providing an estimate of one of the frequency and type of breast surgery in screened and unscreened women. Between 30% and 55% of screen‐detected cancers would not have progressed if undiagnosed. 34 This means that some screened women undergo surgery for cancers that would never have become invasive. Screening also changes the balance of cancers detected in favour of less advanced cancers. It may therefore decrease the numbers of women undergoing mastectomy rather than lumpectomy. A more complete estimate of the effects of screening would include an estimate of the effects of screening on breast surgery, however data were hard to obtain for the purposes of this analysis.
No estimates of false‐positive referral rates for assessment or biopsy are available for women who do not undergo mammography screening. As she has initiated clinical investigation in response to her own concerns false positives resulting from investigation of symptoms may have a different significance for women than those resulting from screening women who think of themselves as healthy. False positives from investigation of symptoms are also likely to be infrequent, but their absence means that figures presented may slightly overestimate the probability of further investigation attributable to screening. Inclusion of estimated referral rates for assessment and biopsy outside of the context of mammography screening would improve the quality of the information.
Referral for investigation is strongly influenced by the radiologist, with cumulative probability of referral after five mammograms varying from 0.07 to 0.54. 33 The data presented here represent an average figure for an average woman in the USA. Clearly, an accurate estimate of risks and benefits would use provider‐specific data on referral rates.
Risk of breast cancer varies from one woman to another. This paper produces an average estimate of the benefits of screening, suitable for general information. It represents a clear advantage over current information. However, a significant improvement on this is possible using an individualized estimate of benefits, based on each woman's known risk factors. 35
Deaths despite screening
Of 1000 women currently aged 40 who choose mammography screening, 17 will nevertheless die of breast cancer before the age of 75. The information presented does not take account of additional adverse outcomes – such as psychological effects of false reassurance or medico‐legal consequences – resulting from these deaths.
The implications of each of the possible outcomes of screening are not explored or weighted. Individual women attach different importance to different outcomes. Nor does the analysis attempt to combine the weights of different outcomes with probabilities. Women may either weigh up the pros and cons themselves or decision analysis may be used to derive an individually optimal decision. It is of interest that some effects extend beyond the individual concerned. A diagnosis of ductal carcinoma in situ has a benign medical prognosis, but carries important insurance implications for women and their family members. 36
Generalizability: influences on false‐positive rates and effectiveness
This analysis was carried out for a US population, how generalizable is it to other populations? The false‐positive rate is dependent on the referral rate after each mammogram. An analysis conducted for the UK mammography screening programme found the cumulative referral rate to be half the rate calculated in this analysis. 37 This is attributable to two factors: the use of three‐yearly screening from age 50 instead of two‐yearly screening from age 40; and lower referral rates after each mammogram. False‐positive rates are likely to vary widely from one screening programme to another and from one country to another.
The effectiveness of mammography screening in increasing survival to age 75 is influenced by a number of factors: underlying breast cancer mortality, effectiveness of screening and death rates from competing causes. The UK analysis found screening prevented six deaths per 1000 women: this is because it used a more generous estimate of effectiveness. 37 We would expect screening to be less effective in countries with lower breast cancer mortality rates. It is highly unlikely that in any country 10 per 1000 additional women will survive to age 75 as result of screening. This is important in the light of the finding that in four countries most women estimated the absolute benefits to be at least four times this figure. 12
Visual presentation of data
A visual presentation of the principal outcomes of screening is only part of the information that women require. A decision aid should include a description of the process of screening, it should mention the possibility that cancer will be diagnosed earlier decision aid forms only. A similar method of visual presentation of data has been successfully used for other preventive interventions. 26
Conclusions
Informed commentators continue to call for more openness about screening. 38 , 39 Some have suggested that screening programmes should be evaluated on the basis of the proportion of women who were able to reach an informed decision rather than simply on uptake rates. 40 A decision made without access to adequate information is not informed. This paper derives an estimate of the advantages and disadvantages of screening and demonstrates a method of illustrating this information to women that is a clear improvement over current information. There is further scope for improvement on the approach outlined in this paper.
In addition to meeting the ethical requirements of informed consent, improving women's knowledge may have other advantages. The information and presentation developed should be evaluated to assess whether it has these additional effects. An appreciation of the high probability of being referred for assessment may reduce some of the associated anxiety. Understanding that screening does not prevent all breast cancer may encourage more realistic expectations of the programme. It has been suggested that screening policy could benefit from open debate by a citizen's jury. 41 Information in this type of format could help inform such a jury of the advantages and disadvantages of potential future screening programmes.
References
- 1. http://www.ama‐assn.org/ama/pub/category/9060.html (Accessed on: 2 March 2004).
- 2. http://www.ama‐assn.org/ama/pub/category/8488.html (Accessed on: 2 March 2004).
- 3. http://www.ama‐assn.org/ama/pub/category/4608.html (Accessed on: 2 March 2004).
- 4. Baum M. Who truly represents the needs of the consumer diagnosed with breast cancer? Who are these patients’ advocates? How are they informed? What, if any, are their secret agendas? European Journal of Cancer, 1997; 33: 807–808. [DOI] [PubMed] [Google Scholar]
- 5. Welch HG. Informed choice in cancer screening. Journal of the American Medical Association, 2001; 285: 2776–2778. [DOI] [PubMed] [Google Scholar]
- 6. American Academy of Family Physicians . Deciding About Mammography for Women Age 40 to 49, version 3.0. 2002. Available at: http://www.aafp.org/PreBuilt/breast_cancer_long.pdf (Accessed on: 6 July 2004). [Google Scholar]
- 7. American Cancer Society cancer reference information . Available at: http://www.cancer.org/docroot/CRI/content/CRI_2_4_3X_Can_breast_cancer_be_found_early_5.asp (Accessed on: 5 July 2004).
- 8. National Cancer Institute . Available at: http://www.cancer.gov/cancertopics/pdq/screening/breast/patient (Accessed on 5 July 2004).
- 9. UCSF (University of California San Francisco) . Potential Benefits and Risks of Mammograms. Available at: http://mammography.ucsf.edu/inform/index.cfm (Accessed on: 5 July 2004). [Google Scholar]
- 10. Black WC, Nease RF Jr, Tosteson AN. Perceptions of breast cancer risk and screening effectiveness in women younger than 50 years of age. Journal of the National Cancer Institute, 1995; 87: 720–731. [DOI] [PubMed] [Google Scholar]
- 11. Chamot E, Perneger TV. Misconceptions about efficacy of mammography screening: a public health dilemma. Journal of Epidemiology and Community Health, 2001; 55: 799–803. [DOI] [PMC free article] [PubMed] [Google Scholar]
- 12. Domenighetti G, D'Avanzo B, Egger M et al. Women's perception of the benefits of mammography screening: population‐based survey in four countries. International Journal of Epidemiology, 2003; 32: 816–821. [DOI] [PubMed] [Google Scholar]
- 13. O'Connor AM, Stacey D, Rovner D et al Decision aids for people facing health treatment or screening decisions In: Cochrane Review, Issue 2. Oxford: The Cochrane Library Update Software, 2002. [Google Scholar]
- 14. Edwards A, Elwyn G, Mulley A. Explaining risks: turning numerical data into meaningful pictures. British Medical Journal, 2002; 324: 827–830. [DOI] [PMC free article] [PubMed] [Google Scholar]
- 15. Sarfati D Howden‐Chapman P Woodward A Salmond C. Does the frame affect the picture? A study into how attitudes to screening for cancer care are affected by the way benefits are expressed. Journal of Medical Screening, 1998; 5: 137–140. [DOI] [PubMed] [Google Scholar]
- 16. Malenka DJ, Baron JA, Johansen S, Wahrenberger JW, Ross JM. The framing effect of relative and absolute risk. Journal of General Internal Medicine, 1993; 8: 543–548. [DOI] [PubMed] [Google Scholar]
- 17. Hux JE, Naylor CD. Communicating the benefits of chronic preventive therapy: does the format of efficacy data determine patients’ acceptance of treatment? Medical Decision Making, 1995; 15: 152–157. [DOI] [PubMed] [Google Scholar]
- 18. Cranney M, Walley T. Same information, different decisions: the influence of evidence on the management of hypertension in the elderly. British Journal of General Practice, 1996; 46: 661–663. [PMC free article] [PubMed] [Google Scholar]
- 19. Olsen O, Gøtzsche PG. Cochrane review on screening for breast cancer with mammography. Lancet, 2001; 358: 1340–1342. [DOI] [PubMed] [Google Scholar]
- 20. International Agency for Research on Cancer (IARC) . IARC Handbooks of Cancer Prevention. Vol. 7. Breast Cancer Screening. Lyon, France: IARC Press, 2002. [Google Scholar]
- 21. Humphrey LL, Helfand M, Chan BKS, Woolf SH. Breast cancer screening: a summary of the evidence for the U.S. preventive services task force. Annals of Internal Medicine, 2002; 137: 347–360. [DOI] [PubMed] [Google Scholar]
- 22. Centers for Disease Control (CDC) . Use of mammography for women 40 years of age and over according to selected characteristics: United States, selected years 1987–2000. Available at: http://www.cdc.gov/nchs/data/hus/tables/2003/03hus080.pdf (Accessed on: 2 November 2004). [Google Scholar]
- 23. CDC . Death rates for 113 selected causes, by 5‐year age groups, race, and sex: United States, 2000. Available at: http://www.cdc.gov/nchs/datawh/statab/unpubd/mortabs.htm (Accessed on: 30 March 2004). [Google Scholar]
- 24. Smith‐Bindmann R, Chu PW, Miglioretti DL et al. Comparison of screening mammography in the US and the UK. Journal of the American Medical Association, 2003; 290: 2129–2137. [DOI] [PubMed] [Google Scholar]
- 25. U.S. Preventive Services Task Force . Screening for breast cancer: recommendations and rationale. Annals of Internal Medicine, 2002; 137: 344–346. [DOI] [PubMed] [Google Scholar]
- 26. Bryan S, Gill P, Greenfield S, Gutridge K, Marshall T, Birmingham Patient Preferences Group . Clinicians’ preferences for treatments to prevent heart disease: a postal survey. Heart, 2005; 91: 377–378. [DOI] [PMC free article] [PubMed] [Google Scholar]
- 27. Nystrom L, Andersson I, Bjurstam N, Frisell J, Nordenskjold B, Rutqvist LE. Long‐term effects of mammography screening: updated overview of the Swedish randomised trials. Lancet, 2002; 359: 909–919. [DOI] [PubMed] [Google Scholar]
- 28. Miller AB, To T, Baines CJ, Wall C. The Canadian National Breast Screening Study: update on breast cancer mortality. Journal of the National Cancer Institute Monographs, 1997; 22: 37–41. [DOI] [PubMed] [Google Scholar]
- 29. Cox B. Variation in the effectiveness of breast screening by year of follow‐up. Journal of the National Cancer Institute Monographs, 1997; 22: 69–72. [DOI] [PubMed] [Google Scholar]
- 30. Stout NK, Rosenberg MA, Remington PL, Trentham‐Dietz A, Fryback DG. Can routine screening really reduce breast cancer mortality by 40–60%? Medical Decision Making 2003. Oral presentation by N. Stout at the Society for Medical Decision Making Annual Meeting, Chicago, IL, October 2003. [Google Scholar]
- 31. Miller AB, Baines CJ, To T, Wall C. Canadian National Breast Screening Study: 1. Breast cancer detection and death rates among women aged 40 to 49 years. Canadian Medical Association Journal, 1992; 147: 1459–1476. [PMC free article] [PubMed] [Google Scholar]
- 32. Elmore JG, Barton MB, Moceri VM, Polk S, Arena PJ, Fletcher SW. Ten‐year risk of false positive screening mammograms and clinical breast examinations. The New England Journal of Medicine, 1998; 338: 1089–1096. [DOI] [PubMed] [Google Scholar]
- 33. Christiansen CL, Wang F, Barton MB et al Predicting the cumulative risk of false‐positive mammograms. Journal of the National Cancer Institute, 2000; 92: 1657–1666. [DOI] [PubMed] [Google Scholar]
- 34. Fryback DG, Rosenberg MA, Stout NK et al. The case for limited malignant potential breast cancer Medical Decision Making 2003. Oral presentation by Fryback D.G. at the Society for Medical Decision Making Annual Meeting, Atlanta, GA, October 2004. [Google Scholar]
- 35. Benichou J, Gail MH, Mulvihill JJ. Graphs to estimate an individualized risk of breast cancer. Journal of Clinical Oncology, 1996; 14: 103–110. [DOI] [PubMed] [Google Scholar]
- 36. Thornton H. Pairing accountability with responsibility – the consequences of screening ‘promotion’. Medical Science Monitor, 2001; 7: 531–533. [PubMed] [Google Scholar]
- 37. Marshall T, Adab P. Informed consent for breast screening: what should we tell women? Journal of Medical Screening, 2003; 10: 22–26. [DOI] [PubMed] [Google Scholar]
- 38. Berry D. Commentary: screening mammography: a decision analysis. International Journal of Epidemiology, 2004; 33: 68. [DOI] [PubMed] [Google Scholar]
- 39. Welch HG. Should I be tested for cancer? Maybe not and here's why Berkeley: University of California Press, Berkeley, 2004. [Google Scholar]
- 40. Foster P, Anderson CM. Reaching targets in the national cervical screening programme: are current practices unethical? Journal of Medical Ethics, 1998; 24: 151–157. [DOI] [PMC free article] [PubMed] [Google Scholar]
- 41. Thornton H, Baum M. Should a mammographic screening programme carry the warning: screening can damage your health? British Journal of Cancer, 1999; 79: 691–692. [DOI] [PMC free article] [PubMed] [Google Scholar]