

Abstract
Background and aims Physician reimbursement for services and thus income are largely determined by the Medicare Resource‐Based Relative Value Scale. Patients’ assessment of the value of physician services has never been considered in the calculation. This study sought to compare patients’ valuation of health‐care services to Medicare’s relative value unit (RVU) assessments and to discover patients’ perceptions about the relative differences in incomes across physician specialties.
Design Cross‐sectional survey.
Participants and setting Individuals in select outpatient waiting areas at Johns Hopkins Bayview Medical Center.
Methods Data collection included the use of a visual analog ‘value scale’ wherein participants assigned value to 10 specific physician‐dependent health‐care services. Informants were also asked to estimate the annualized incomes of physicians in specialties related to the abovementioned services. Comparisons of (i) the ‘patient valuation RVUs’ with actual Medicare RVUs, and (ii) patients’ estimations of physician income with actual income were explored using t‐tests.
Outcomes Of the 206 eligible individuals, 186 (90%) agreed to participate. Participants assigned a significantly higher mean value to 7 of the 10 services compared with Medicare RVUs (P < 0.001) and the range in values assigned by participants was much smaller than Medicare’s (a factor of 2 vs. 22). With the exception of primary care, respondents estimated that physicians earn significantly less than their actual income (all P < 0.001) and the differential across specialties was thought to be much smaller (estimate: $88 225, actual: $146 769).
Conclusion In this pilot study, patients’ estimations of the value health‐care services were markedly different from the Medicare RVU system. Mechanisms for incorporating patients’ valuation of services rendered by physicians may be warranted.
Keywords: patient assessment, physician income, RVU
Introduction
In the American health‐care system, physician reimbursement is determined largely by the Medicare Resource‐Based Relative Value Scale (RBRVS). The RBRVS physician fee schedule was established to objectify measures of physician work with equitable reimbursement across specialties. 1 , 2 , 3 , 4 , 5 In adopting this scale, based on a modified version of Hsiao’s relative value unit (RVU) system, the federal government had hoped to diminish some of the reimbursement irregularities and inequities physician fee schedule. 6 , 7 , 8 The RVU calculation for a health‐care service takes into consideration (i) a physician work component, (ii) a practice expense component, and (iii) a malpractice cost component. 9 Payments are also adjusted based on geographic differences in resource costs. 2 The RVU is then multiplied by a conversion factor to produce the dollar amount of compensation for the particular service. 2 , 9
The RVU system does not equally reward the work component of physicians in different specialties. Differences in physician incomes between procedural and non‐procedural specialties in medicine continue to be substantial. 10 , 11 , 12 , 13 , 14 The inequities are thought to be particularly influential on the career decisions of medical trainees and thus the make‐up of the physician workforce in America. 10 , 15 , 16 , 17
In economic terms, value is maximized at the point where one achieves the highest quality at the lowest cost. 18 Patients, the ultimate consumers of health‐care services, do not fully bear the costs of the care they receive nor do they have the means to accurately judge quality thereby making the economic assessment of value problematical. However, in basic terms, value is defined as ‘relative merit, worth, importance’ 19 and it lies in the eyes of the beholder. It is therefore expected that patients have opinions and sentiments about the ‘relative value’ of various health‐care services that are available to them.
Though reasonable in its mathematical calculation of understood costs, the RVU system has never considered patients’ views or perspectives. In fact, patients’ valuation of physician services and how they correlate with Medicare’s RVU system is not known and has not been previously studied. The primary aim of this pilot study was to compare patients’ valuation of specific health‐care services to Medicare’s RVU assessment. Because RVUs are intimately linked to physician income, a secondary objective was to assess patients’ perceptions about the relative differences in income among various types of physicians.
Methods
Participants and setting
The study was conducted at Johns Hopkins Bayview Medical Center, a 335‐bed university affiliated medical center in Baltimore. A convenience sample, representing all adults who were sitting in five different outpatient practice waiting rooms, were approached for participation. One of the authors divided her time equally (over a 3‐week period) between five different outpatient settings – (i) a general internal medicine primary care practice, (ii) a dermatology practice, (iii) a cardiology practice, (iv) an orthopedics practice and (v) an outpatient radiology waiting room. Persons who were younger than 20 years old, non‐English speaking, demented, delirious, and those unable to hear or with severe visual impairments were excluded.
Instrument development
The data collection instrument was developed based on a systematic review of the literature and in consultation with colleagues that have expertise in survey development, clinical research, and health policy. The instrument was iteratively revised and improved by the study team in response to (i) feedback from colleagues, (ii) discussions at our monthly ‘research in progress seminars’, and (iii) based on pilot testing on subsets of patients in the waiting rooms wherein the actual study would take place.
The data collected included demographic information such as age, gender, race, number of medications taken daily, number of physician visits in the prior year, and whether the patient had Medicare insurance.
The second part of the survey included questions that asked respondents to assign ‘value’ to 10 selected physician services and tests, specifically chosen to span a wide range of Medicare RVU’s and common physician specialties. Finally, respondents were asked about their impressions on the annual income of six different types of physicians. The rationale for asking informants about their estimation of the incomes of the physicians who perform the specific services considered in the prior section was carried out as a way to incorporate a modicum of framework or criterion validity by examining the relationship between these variables.
Data collection
Data were collected during the month of November in 2003. All individuals in the waiting rooms that served as the setting for recruitment of subjects (patients or patients’ companions) were sequentially approached. After obtaining oral consent, a single investigator used the same script to collect the data.
Study subjects were asked questions about themselves and then embarked on the task of placing 10 ‘sticky’ labelled tabs representing 10 different physician services on a large scale with 100 hatches (but no numbers) that was labelled at the ends as ‘of least value’ and ‘of greatest value’ (Fig. 1). This development of the 50‐cm long ‘visual analog scale’ was produced according to established specifications. 20 , 21 Participants were informed that they could adjust the placements of the tabs relative to one another along this scale as they placed all 10 tabs. As participants were handed each labelled tab one at a time in a predetermined specified order, they were told to assess the value of the service ‘to them if they needed it’ for each of the following: (i) a visit to a primary care physician for an uncomplicated new problem such as a cold; (ii) a visit to a primary care physician for follow‐up of three chronic conditions (such as diabetes, hypertension and high cholesterol) that were well controlled; (iii) having an electrocardiogram read by a physician; (iv) having a screening colonoscopy performed by a gastroenterologist; (v) having a dermatologist take a sample of skin or superficial tissue to evaluate for a disease process; (vi) having an ophthalmologist remove a cataract; (vii) having a hip X‐ray interpreted by a radiologist; (viii) having an echocardiogram interpreted by a cardiologist, (ix) a visit to a primary care doctor for a pre‐operative evaluation before having hernia repair; and (x) a visit to a cardiologist for the first time for worsening heart failure. If the participants understood the statement, no clarification was made. However, in many cases, the kind of physician was referenced to the body part – for example a cardiologist was explained to be a heart doctor. Also, if the participant did not understand or was not familiar with the procedure in question, it was explained using the standardized script – for example: an echocardiogram was described as ‘an ultrasound of the heart to assess the heart muscle and valves’. It should be noted that the script purposefully stated ‘a’ primary care physician or ‘a’ cardiologist as opposed to ‘your’ physician so that informants were not assigning value based on their personal relationships with their physicians, and patients were so instructed. After all 10 labels were placed; participants were once again reminded that they were free to move the tabs around until they were comfortable with the assigned placements. Once participants told the investigator they had finished, the positions of the tabs were recorded.
Figure 1.
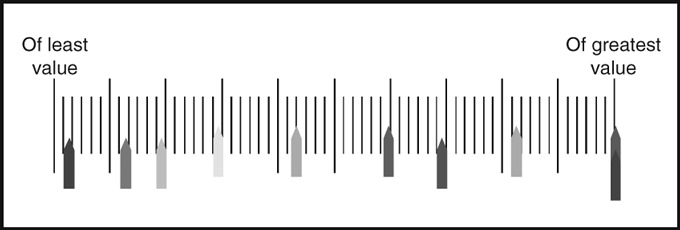
Representation of the visual analog scale upon which study subjects were asked to place 10 labelled tabs representing 10 different physician services.
Participants were then asked to estimate the incomes of several types of physicians – specifically those that perform the services that they had just been asked about. First, participants were asked ‘how much do you think a primary care physician who has completed all of their medical training gets paid each year?’ They were subsequently asked, ‘if a primary care provider makes that amount that you said, how much do you think a radiologist makes?’ This was repeated for the other following specialties: gastroenterology, dermatology, ophthalmology, and cardiology. Participants were not given any reference ranges of incomes.
Statistical analysis
For each variable, we examined frequency of responses to look for irregularities in the distribution of responses. For the continuous variables, distributions and descriptive statistics were examined for evidence of skewness, outliers, and non‐normality to ensure the appropriate use of parametric statistical tests.
The participants’ valuations of services ranging from 0 to 100 (from the visual analog scale) were converted to a ‘patient valuation RVU’. The conversion equation incorporated the minimum and maximum actual Medicare RVUs for the 10 services in the query, and the range of values assigned by the participant on the 100‐point visual analog scale.
To convert from the 0 to 100 scale to the RVU equivalent, the following equation was used:
where tMr is the top value in the Medicare RVU range; bMr is the bottom value in the Medicare RVU range; Pr is the participant’s range of values; and Ps is the participant’s assigned value for the specific service in question.
Comparisons of the ‘patient valuation RVUs’ with actual Medicare RVUs were examined using t‐tests. Similarly, patients’ estimations of physician incomes with actual income data from the Medical Group Management Association (MGMA) 2003 Directory 22 were compared using t‐tests.
Data were analysed using stata 8.0 (STATA Corp., College Station, TX, USA). The study was approved by the Johns Hopkins Institutional Review Board.
Results
Two hundred and eleven adults were approached to participate in this study. After excluding five individuals based on the study’s exclusion criteria, 206 individuals were eligible to participate. Twenty people declined to partake in the study and 186 people consented to be surveyed. Participants’ ages ranged from 21 to 90 years with a mean of 59 years. Fifty‐seven per cent were female and 70% were Caucasian. About half of the participants surveyed received Medicare benefits. Most participants were taking at least two prescriptions drugs per day and had seen at least one specialist in the last year (Table 1).
Table 1.
Characteristics of participants (n = 186)*
| Characteristics | n (%) |
|---|---|
| Age (years) | |
| <45 | 46 (24.7) |
| 45–64 | 60 (32.3) |
| 65+ | 79 (42.5) |
| Female | 106 (57.0) |
| Race | |
| White | 131 (70.8) |
| Black | 48 (25.8) |
| Hispanic | 1 (0.5) |
| Other | 6 (3.2) |
| Method of payment for health‐care services | |
| Fixed fee | 58 (31.2) |
| Percentage of charge | 15 (8.1) |
| Nothing | 96 (51.6) |
| Entire charge | 9 (4.8) |
| Receive medicare benefits | 94 (50.5) |
| Number of medications taken each day | |
| 0 | 26 (14.0) |
| 1–3 | 74 (39.8) |
| 4–6 | 59 (31.7) |
| >6 | 26 (14.0) |
| Number of specialists seen in the last year | |
| 0 | 43 (23.1) |
| 1 | 70 (37.6) |
| 2 | 32 (17.2) |
| 3+ | 40 (21.5) |
| Number of visits to see physicians in the last year | |
| <1 | 35 (18.8) |
| 2 | 40 (21.5) |
| 3 | 36 (19.4) |
| 4+ | 30 (16.1) |
| >4 | 44 (23.7) |
*Due to non‐response, n is less than 186 for select variables.
Example of RVU conversions
One patient assigned the value of ‘40’ on the analogue scale for an uncomplicated visit to a primary care provider (PCP), the value of ‘60’ for removal of a cataract, and she placed the other eight physician services between 100 (her highest assigned value) and 14 (her lowest assigned value). Using the ‘patient valuation RVU’ conversion equation [(tMr− bMr) × (Ps/Pr)] + bMr]; with tMr = 3.79, bMr = 0.17, pr = (100 – 14) = 86 (the participant’s range), the following values are generated:
When Ps = 40 for the uncomplicated visit with PCP, the ‘patient valuation RVU’ for this = [(3.79 – 0.17) × (40/86)] + 0.17 = 1.85.
When Ps = 60 for the cataract surgery, the patient valuation RVU for this = [(3.79 – 0.17) × (60 / 86)] + 0.17 = 2.70.
Comparisons between informants’ value determinations for select services and the Medicare RVU system
Participants assigned a significantly higher mean value to 7 of the 10 services compared with Medicare RVUs (P < 0.001). A cardiology consult was valued similarly by both participants and the Medicare RVU system (3.43 vs. 3.44, p = ns). Cataract removal and colonoscopy were valued by participants at a significantly lower level as compared with Medicare’s system (2.78 vs. 3.88 and 2.70 vs. 3.75 respectively, P < 0.001) (Fig. 2).
Figure 2.

Comparisons between actual Medicare RVUs and patients’ valuation of these same services.
The range in value assigned by the informants across the 10 different services that they were queried about was small – varying in valuation by only a factor of 2 (absolute difference is 1.1 RVUs). In contrast, these same services differ in value in the Medicare RVU system by a factor of 22 (absolute difference is 3.6 RVUs).
Comparisons between informants’ estimations of physician incomes and actual physician incomes
For the six different types of physicians that participants were queried about, they estimated that physicians earn less than their actual incomes (all P < 0.001, except for primary care physicians) (Fig. 3). Participants estimated that cardiologists had the highest incomes (mean: $184 154) and that radiologists had the lowest (mean: $95 929). Participants conjectured that all physicians’ incomes were fairly similar (absolute difference between highest and lowest = $88 225). The MGMA database reveals that the actual discrepancies are much larger [absolute difference between high (radiology: $297 298) and low (internal medicine: $150 529) = $146 769].
Figure 3.

Comparisons between actual physician incomes (average of academic and private practice) and patients’ estimates of incomes.
Discussion
In basic economics principles, value has been conceived to consist in its recognized fitness for attaining an end, or in the recognized utility of the good or service. 19 There are myriad ‘ends’ in the health‐care services rendered by physicians with a breadth that includes disease prevention as well as the delivery of palliative care to the dying patient. Some services are simple and some are more challenging, some can be performed quickly whereas others are time and resource intensive procedures. The assignment of relative value to different health‐care services is complicated. To address the complexities, a ‘resource‐based relative value scale update committee’ (RBRVSUC) composed of physicians from multiple specialties was assembled to help Medicare address the significant variations in fees charged by physicians under the previous ‘usual, customary and reasonable’ reimbursement system in 1992. While it was hoped that this approach in making relative value recommendations would better represent the work (and thus the price to be paid) for services rendered by physicians, the task is fraught with significant challenges. 15 Moreover, the voice of the patients, who are the recipients of health‐care resources, has been and continues to be conspicuously absent. 2
This study is unique in that it directly asks individual health‐care recipients how they value different physician services. This study presents new findings that have not been reported elsewhere: (i) the study population valued physician services quite differently than the Medicare RVU system; (ii) they valued physician services relatively equally; and (iii) they believed that the incomes of specialist physicians and primary care physicians are similar. While of course the costs and clinical utility of services must continue to be major determinants of reimbursement rates, the study’s findings highlighting the discrepancies between how the public vs. the physicians on the RBRVSUC value health‐care services should be noted and the implications considered.
A cynical viewpoint would be that patients ‘just don’t understand’ or that they are ‘not smart enough’ and ‘not informed enough’ to warrant having their perspective included in the RBRVS determinations. Such ‘conventional wisdom’ within the medical community has resulted in there being only health‐care professionals on the RVS Update Committee. Forward thinking economists, like Levitt in his book Freakonomics 23 , urge us to remember that: (i) conventional wisdom is often not correct, and (ii) experts use their informational advantage to serve their own agendas. Thus, as the informational advantage in the 21st century of physician‐experts over the public is diminished by media coverage about health‐care issues (on the internet, television and in print), patients may in fact be adequately informed to weigh in on the issue of ‘value’ in medicine. Certainly, those paying to push information at the American public in the form of direct to consumer health‐care advertising (including pharmaceutical companies and public agencies) believe that patients can assimilate this data, make value judgements, and advocate for their self‐interests.
Whether adjustments should be made to the current methodology for valuing physician services is debatable. Although the RBRVS attempts to take into account true costs (malpractice, office expense, time of service) and opportunity costs (length of training of a specialty), there are elements of value that are completely ignored. Patients’ perspective regarding valuation is one. Although patients are not experienced in assigning value to specific health‐care services, participants in this pilot study seemed comfortable in comparing the services and appeared to have some familiarity with the concept. Some patients explained that they make ‘value judgements’ daily related to the interface between health and costs. For example, in electing to take their blood pressure medication and not their proton pump inhibitor they acknowledge worrying more about their heart than their stomach; they ration limited resources accordingly.
The concept of health‐care costs to the participant vs. costs to ‘society’ was not an explicit part of their evaluation of services in this experiment. Moral hazard suggests that when an individual is not personally responsible for the expense, their perspectives and preferences may be different than if they were more at risk. The answers may have been otherwise had the informants had been asked to rank the services based on how much they would be willing to pay for each of the services. This may represent an area for additional inquiry.
It is known that health‐care costs in the US continue to increase dramatically, especially in comparison with other economic sectors. 24 Thus, another potentially vital component in assigning value is the effectiveness of a particular service in achieving desirable outcomes at an acceptable cost. Along such lines, it may be argued that services that prevent illness may deserve to be weighted based on the long‐term impact on public health. Although patients and patient advocacy groups may not be ready to assess the cost‐utility of health‐care services, they can be invited to participate in discussions and to express their perspectives about that they most highly value.
In our study, informants believed that all physician‐types except primary care physicians earned statistically significantly less than their actual incomes. Although this may be a sign of their lack of familiarity with professional salaries, the uniformity in their assessments may reflect their perceptions that different kinds of doctors all have unique skills and render comparably valuable services and care. The evenhandedness in their perceptions about incomes in medicine is consistent with their assessments of the value of the specific health‐care services rendered by these different physician‐types and this adds evidence for ‘relation to other variables’ validity to the results. 25 The implication of imbalance in physicians’ salaries lies in the continued erosion of the pool of primary care providers. Graduating medical students are concerned that in primary care fields it will take longer to recover the costs of their medical education and pay off their debts. 26 , 27 , 28 , 29 , 30 , 31 , 32 Lifestyle issues and control over the work environment also have made procedural specialties more attractive than primary care. 29 , 30 , 31
Several limitations of this study should be considered. First, it was a pilot study with a small sample size and was performed at a single academic medical centre, thus results may not be generalizable to other settings or patient populations. Second, the valuation scale was designed for this study and was not previously validated. However, the visual analog scale was carefully designed based on published specifications and with input from expert consultants (content validity). Also, evidence for criterion validity is suggested based on the congruence in the relationships between variables – incomes and valuation of services. The relative clustering of respondents’ valuation of services, ‘a floor effect’, compared with Medicare’s RVUs wider range may raise concern about a flaw in the instrument design. However, low variation in scores across items is also common among patient satisfaction surveys (such as Press Ganey with its robust validity evidence), 33 , 34 which are being embraced by the health‐care community and Center for Medicare and Medicaid Services. 35 This clustering of valuation of services towards the higher end may have been related to the instructions that respondents were given to rate the items ‘if they were needed’. If this were the case, this could impact upon the comparison of patents’ valuations to the Medicare RVU system but it would not interfere with the patients’ valuation of services relative to one another. Third, we only evaluated 10 common services in six types of specialties when there are many more services and specialties to choose from. We did, however, choose from a variety of cognitive and procedural services spanning multiple common specialties. A follow‐up study looking at different services delivered by physicians in other medical specialties could be interesting. Fourth, although patients were instructed to disregard their relationships with their personal physicians, it is possible that this element was included in their assignment of value. Finally, it is impossible to know how familiar the informants were with each of the 10 services that were queried about. We tried to explain each procedure to them if they were inexperienced with the service, but future studies may want to educate subjects further about exactly what is involved with each of them.
In conclusion, this pilot study suggests that the public’s valuation of distinct health‐care services delivered by physicians may not be reflected in the current Medicare RVU system. If the findings are replicated on a larger scale, there would be a greater stimulus to revisit the relative valuation of services delivered by physicians, perhaps with more of a focus on value and outcomes. If such an exercise resulted in a lessening of the disparity in remuneration across medical specialties, it could help to stimulate graduating physicians to consider careers in primary care disciplines.
Acknowledgements
Dr Wright is an Arnold P. Gold Foundation Associate Professor of Medicine. Drs Kravet and Wright are Miller‐Coulson Scholars and are grateful for the support from the Miller‐Coulson family and Johns Hopkins Center for Innovative Medicine.
References
- 1. American Academy of Pediatrics Committee on Coding and Nomenclature . Application of the resource‐based relative value scale system to pediatrics. Pediatrics. 2004;113:1437–1440. [DOI] [PubMed] [Google Scholar]
- 2. http://www.ama‐assn.org/ama/pub/category/2292.html, accessed on 14 August 2008.
- 3. Brent RJ, Patel M. Physician rewards for different kinds of service: the RBRVS versus the CPR system. Plastic and Reconstructive Surgery, 1997; 100: 51–57. [DOI] [PubMed] [Google Scholar]
- 4. Hsiao W, Braun P, Yntema D, Becker E. Estimating physicians’ work for a resource‐based relative‐value scale. New England Journal of Medicine, 1988; 319: 835–841. [DOI] [PubMed] [Google Scholar]
- 5. http://www.cms.hhs.gov/apps/pfslookup/step0.asp
- 6. Hsiao W, Braun P, Dunn D, Becker E. Resource‐based relative values: an overview. JAMA, 1988; 260: 2347–2353. [PubMed] [Google Scholar]
- 7. Hsiao W, Braun P, Becker E, Thomas S. The resource‐based relative value scale: toward the development of an alternative physician payment system. JAMA., 1987; 258: 799–802. [PubMed] [Google Scholar]
- 8. Hsiao W, Braun P, Dunn D et al. An overview of the development and refinement of the resource‐based relative value scale: the foundation for reform of U.S Physician Payment. Medical Care, 1992; 30(Suppl.): NS1–NS12. [DOI] [PubMed] [Google Scholar]
- 9. Johnson S, Newton W. Resource‐based relative value units: a primer for academic family physicians. Family Medicine, 2002; 34: 172–176. [PubMed] [Google Scholar]
- 10. Bodenheimer T Primary care – will it survive? New England Journal of Medicine 2006;355:861–864. [DOI] [PubMed] [Google Scholar]
- 11. The Impending Collapse of Primary Care Medicine and Its Implications for the State of the Nation’s Health Care. Washington, D.C.: American College of Physicians, 30 January , 2006. http://www.acponline.org/hpp/statehc06_1.pdf . [Google Scholar]
- 12. Straus SE, Straus C, Tzanetos K. Career choice in academic medicine. Systematic review. Journal of General Internal Medicine, 2006; 21: 1222–1229. [DOI] [PMC free article] [PubMed] [Google Scholar]
- 13. Wood PS, Altmaier EM, Franken JREA et al. Factors influencing choice of academic or practice careers in radiology. Investigative Radiology, 1990; 25: 675–677. [DOI] [PubMed] [Google Scholar]
- 14. Woo B. Primary care – the best job in medicine? New England Journal of Medicine, 2006; 355: 864–866. [DOI] [PubMed] [Google Scholar]
- 15. Bodenheimer T, Berenson R, Rudolf P. The primary care – specialty income gap: why it matters. Annals of Internal Medicine, 2007; 146: 301–306. [DOI] [PubMed] [Google Scholar]
- 16. Dorsey ER, Jarjoura D, Rutecki GW. The influence of controllable lifestyle and sex on the specialty choices of graduating U.S. medical students, 1996–2003. Academic Medicine, 2005; 80: 791–796. [DOI] [PubMed] [Google Scholar]
- 17. Garibaldi RA, Popkave C, Bylsma W. Career plans for trainees in internal medicine residency programs. Academic Medicine, 2005; 80: 507–512. [DOI] [PubMed] [Google Scholar]
- 18. http://www.mises.org/etexts/menger/appendixc.asp, accessed on 14 August 2008.
- 19. http://en.wikipedia.org/wiki/Theory_of_value_%28economics%29, accessed on 14 August 2008.
- 20. http://www.rasch.org/rmt/rmt122s.htm, accessed on 14 August 2008.
- 21. Devellis RF. Scale Development: Theory and Applications. Thousand Oaks, CA: Sage Publications Inc., 2003. [Google Scholar]
- 22. Medical Group Management Association . MGMA Physician Compensation and Production Survey, 2004. Denver, CO: Heggie Enterprises Inc; 2004. [Google Scholar]
- 23. Levitt SD, Dubner SJ. Freakonomics: A Rogue Economist Explores the Hidden Side of Everything. New York: HarperCollins Publishers, 2005. [Google Scholar]
- 24. Henry J. Kaiser Family Foundation Trends and Indicators in the Changing Health Care Marketplace. Menlo Park, CA: Henry J. Kaiser Family Foundation, 2006. Available at: http://www.kff.org/insurance/7031/print‐sec1.cfm, accessed on 14 July 2008. [Google Scholar]
- 25. Downing SM. Validity: on meaningful interpretation of assessment data. Medical Education, 2003; 37: 830–837. [DOI] [PubMed] [Google Scholar]
- 26. American College of Physicians . The Impending Collapse of Primary Care Medicine and Its Implications for the State of the Nation’s Health Care: A Report from the American College of Physicians. Available at: http://www.acponline.org/hpp/statehc06_1.pdf, accessed on 15 May 2006. [Google Scholar]
- 27. Pugno PA, Schmittling GT, Fetter GT Jr, Kahn NB Jr. Results of the 2005 national resident matching program: family medicine. Family Medicine, 2005; 37: 555–564. [PubMed] [Google Scholar]
- 28. American College of Physicians . Internal Medicine Residency Match Results And Survey Of Residents' Future Career Plans Underscore Need For Comprehensive Reforms. East Sussex: MediLexicon International Ltd (Medical News Today), 2006. Available at: http://www.medicalnewstoday.com/articles/39779.php, accessed on 14 July 2008. [Google Scholar]
- 29. Watson DE, Slade S, Buske L, Tepper J. Intergenerational differences in workloads among primary care physicians: a 10‐year, population‐based study. Health Affairs, 2006; 25: 1620–1628. [DOI] [PubMed] [Google Scholar]
- 30. Hauer KE, Alper EJ, Clayton CP, Hershman WY, Whelan AJ, Woolliscroft JO. Educational responses to declining student interest in internal medicine careers. American Journal of Medicine, 2005; 118: 1164–1170. [DOI] [PubMed] [Google Scholar]
- 31. Garibaldi RA, Popkave C, Bylsma W. Career plans for trainees in internal medicine residency programs. Academic Medicine, 2005; 80: 507–512. [DOI] [PubMed] [Google Scholar]
- 32. Levine RB, Mechaber HF. Opting in: part‐time careers in academic medicine. American Journal of Medicine, 2006; 119: 450–453. [DOI] [PubMed] [Google Scholar]
- 33. Clark PA, Drain M, Leddy KM, Wolosin RJ. Patient satisfaction in academic medical centers. Annals of Behavioral Science and Medical Education, 2005; 11: 100–105. [Google Scholar]
- 34. Wolosin RJ, Gesell SB, Taber B, Epting GI. Construct validation of a physician satisfaction survey. Journal for Healthcare Quality, 2006; 28: 10–21. [DOI] [PubMed] [Google Scholar]
- 35. http://www.dmr‐inc.com/news/news_detail.aspx?Pqs=18, accessed on 14 August 2008.