

Abstract
Objective This study established patients’ preferences regarding the facilities in an adjacent centre for ambulatory hospital care. It also identified determinants of patients’ choice to visit this centre instead of the regional hospital.
Methods A questionnaire survey among 1477 elderly and chronically ill people (response 72%) assessed patients’ expectations regarding (a) quality of hospital care, (b) facilities in centres for ambulatory hospital care, and (c) future use of these centres. Additionally, 75 patients participated in discrete choice experiments about their decision to visit a centre for ambulatory hospital care or the regional hospital.
Results Respondents prioritized facilities for examination and medical consultations in the ambulatory care centres. Half of the respondents also valued paramedic care, information desks and pharmacies as centre facilities. Most patients living near a future centre for ambulatory care would rather visit this centre than the regional hospital. However, they favoured seeing their familiar physician, short waiting lists and appointments scheduled consecutively on 1 day. If these aspects were not guaranteed at the adjacent centres, more patients chose to visit the hospital.
Conclusions Although patients value most facilities, they set clear priorities. Furthermore, this study showed three important conditions in the decision to visit an ambulatory care centre; (1) the possibility to see their familiar physician, (2) to have consecutive appointments, and (3) a short waiting list. These three factors were more important to patients than proximity. Thus, when choosing between a hospital and an adjacent centre for ambulatory care, quality aspects matter.
Keywords: chronically ill, discrete choice experiment, elderly, patient preferences, regional health care
Introduction
Hospitals must set priorities in the face of resource constraints. 1 , 2 And although this is of strong public interest, patients are neither systematically involved in the decision‐making process, nor asked about their views and preferences. Whereas in Great Britain and Sweden there is currently much attention to the involvement of citizens in the prioritization of health care, 3 , 4 , 5 , 6 , 7 , 8 the Dutch government nowadays focuses on patients’ choice in the health care market. 9 , 10 , 11 , 12
The Netherlands has a national health insurance system based on regulated competition among both insurers and providers of health care. This system stimulates health care consumers to influence quality by choosing a provider and dissatisfied patients can switch or ‘vote with their feet’. According to Hirschman, this ‘exit’ option is one way to influence the quality of care, whereas ‘voice’ by complaining and consumer involvement is another. 13 In countries with a national health service, such as Britain and Sweden, patients are more designated to voice because they can’t easily switch to another provider.
As Dutch patients can freely choose amongst hospitals, involvement of citizens from the care region seems to be less important. Consequently, there is little experience in the Netherlands with patient participation in priority setting concerning hospitals. However, changes in regional hospital care often meet resistance from local communities. For patients these changes might raise a conflict with their loyalty to the local hospital and their relationship of trust with their physician. And especially if there is a generalized loss of confidence concerning public services, voice can be expected to prevail. 13 Also, exit is not always an option, since visiting another hospital may imply prolonged travelling time and higher costs or burden. People with chronic conditions might experience even higher costs if they lose contact with their familiar specialist and need to build a relation of trust with a new specialist.
Even if patients can freely select a hospital, most patients visit the hospital in their region 9 , 14 and do not make a deliberate choice but simply follow their GP’s advice. 15 For patients who consciously choose a hospital, reputation 16 , 17 , 18 and travelling distance appear to be the dominant features on which this choice is based. 9 , 14 , 19 , 20 , 21 , 22 Distance is even more important for the elderly 23 and patients who do not own a car. 19 Thus, unless the hospital has a poor reputation, patients prefer to visit the nearest hospital. Overall, citizens often appear to be loyal to the regional hospital. Consequently, it seems to be relevant to facilitate their use of voice to consult them on changes in regional hospital care. This article describes a study of the expectations of elderly and chronically ill patients on the redesign of locations of a Dutch hospital.
Background
Recently, a Dutch hospital decided to investigate patients’ opinions regarding a redesign of regional hospital care. This hospital Bernhoven, currently has two locations and delivers basic hospital care to citizens living in the north‐eastern region of the province Noord‐Brabant, in the south of the Netherlands. Both hospital locations have about 200 beds. The hospital Bernhoven serves a rural area with a medium population density. The largest city in the region, Oss, has 65 000 inhabitants. The distance between the two current hospitals is 10.6 miles. Hospital Bernhoven wants to concentrate its facilities on a single location and is therefore building one new hospital at a central location within the catchment area.
The current two hospital locations of Bernhoven will be closed and turned into centres for ambulatory hospital care. 24 These centres will primarily focus on the most vulnerable patient groups; elderly and chronically ill patients, to maintain hospital care in their vicinity. These two groups are the focus because they are most likely to experience the travelling distance as a burden. The ambulatory care centres are to offer outpatient care to patients whose healthcare needs are predictable and whose care can be planned. The future centres for ambulatory care are thus comparable with outreach clinics or Community‐Based Outpatient Clinics. 25 To organize these centres in a patient‐centred way, hospital Bernhoven called for research on the expectations of elderly and chronically ill patients with respect to these centres.
The aim of this study is to assess what elderly and chronically ill patients require in a future setting of hospital care. Research questions are:
-
1
What are patients’ wishes and expectations regarding care facilities and conditions of care in the future centres for ambulatory care?
-
2
What are the determinants of expectations regarding the quality of hospital care?
-
3
What are the determinants of patients’ choice? When will patients decide to visit the adjacent ambulatory care centre instead of the hospital, for which care situations and dependent on which quality aspects?
Methods
Study population
A survey was conducted, in July 2006. A random sample of 2064 elderly and chronically ill patients of hospital Bernhoven were sent a questionnaire. The response of the questionnaire survey was 72%, after using one reminder letter. A total of 1477 patients returned the questionnaire. These respondents did not differ from non‐respondents with respect to sex and travelling distance to the future, regional hospital. However, respondents were on average 5 years older than non‐respondents (60 vs. 55 years; P < 0.01). This article focuses on the subgroup of 1073 respondents who live within the care region of hospital Bernhoven and who have a shorter travelling distance to one of the two current hospital locations, than to the new hospital.
Questionnaire
The questionnaire topics were gathered from literature 9 , 18 , 19 , 21 , 22 , 24 , 25 , 26 , 27 , 28 , 29 , 30 , 31 , 32 , 33 and from results of a focus group discussion, with nine representatives of patients and elderly organizations. 34 The questionnaire assessed the importance patients attach to aspects of hospital care, using the QUOTE format. 29 , 30 In this format, patients rate quality aspects on a 4‐point scale anchored by ‘not important’ and ‘extremely important’. This scale was also used to rate the importance that patients assign to facilities of the future centres. Patients’ expected use of the centres was assessed using three hypothetical situations. In each situation respondents could choose to visit: (1) the ambulatory care centre, (2) the hospital Bernhoven, (3) another hospital and if possible (4) a GP. The questionnaire also assessed background characteristics: sex, age, education, chronic disease or disorder, perceived health (5‐point scale anchored by poor‐excellent), perceived disability (4‐point scale varying from not disabled to severely disabled), specialist contact and transport to the nearest hospital location. Travelling distance and time were estimated with use of respondents’ ZIP codes.
Analysis of questionnaire data
To acquire meaningful quality dimensions for hospital care, a factor analysis (principal component analysis with varimax rotation) was conducted on the total respondent group, with the condition of a minimal factor loading of 0.40. The homogeneity of the factors was tested with Cronbach’s alphas. After an exploratory factor analysis which resulted in five ambiguous factors, the analysis was restricted to a four‐factor solution. This analysis divided the items on expectations of hospital care on the following quality dimensions: continuity and planning of care (α = 0.76), accessibility through out‐of‐hours and walk‐in consultations (α = 0.80), accessibility by phone and e‐mail (α = 0.70) and attainability by transportation (α = 0.63). The items ‘hospital care within a distance of 6.2 miles (10 kilometres, i.e. median distance)’ and ‘possibility to receive all care at the same hospital location’ did not fit in any scale. The first item loaded 0.40 on the factor accessibility through out‐of‐hours and walk‐in consultations, but did not contribute to the homogeneity of the scale. The second item did not load on any of the scales. The proportion of variance accounted for in the 4‐factor solution is 52%. The first scale, continuity and planning, was rather broad and consisted of seven items. Therefore, an exploratory factor analysis was performed on the items of this first scale. This resulted in a 2‐factor solution. The two resulting scales were interpreted as: continuity (α = 0.67) and planning (α = 0.69). Average importance scores for the final five dimensions and the two separate items of quality of care were calculated.
Multivariate analyses were conducted to investigate the relationships of the background characteristics (age, sex, education, chronic disease, perceived health and disability, specialist contact, distance to the hospital and transport to the hospital) with importance ratings for the facilities of the ambulatory care centres. The significance level used is P < 0.05. With linear regression analyses determinants of expectations regarding the quality of hospital care were assessed. The background characteristics are independent variables in the model. Through use of the Enter‐method, all independent variables are controlled for each other in the model.
Discrete choice experiments
Three discrete choice experiments were conducted to answer the third research question. In the questionnaire, willingness to participate in further research was addressed. Two hundred sixty‐two respondents were willing to join a meeting on their future choice for the hospital or ambulatory care centre (25%). These potential participants were representative with respect to sex, age and travelling distance to the future, regional hospital. But the group that was willing to participate consisted of relatively more chronic ill patients (P < 0.01) and higher educated respondents (P < 0.01).
Of 262 invited respondents 75 (29%) participated in one of two meetings. The other respondents were not able to attend the meetings on the appointed dates and time. During these meetings, respondents participated in three discrete choice experiments. Discrete choice analyses are based on the premises that any service can be described by its characteristics and that the extent to which an individual values a service depends upon the nature and level of these characteristics. The scenarios are described in terms of characteristics and associated levels or values. 8 , 35 , 36 In each experiment respondents were presented vignettes, consisting of two hypothetical scenarios. The vignettes in this study included a scenario describing facilities at the centres for ambulatory care and a scenario describing facilities at the hospital. In each vignette, respondents were asked which scenario they would prefer.
The three discrete choice experiments addressed different aspects of hospital care: medical examination, pre‐operative consultations and ambulatory chronic care. For each of these aspects a common health care need was selected to constitute the three discrete choice experiments: (1) a walk‐in visit for an electrocardiogram (ECG), (2) pre‐operative screening consultations for a total hip replacement and (3) consultations for diabetes care, respectively. The vignettes describing these situations were based on six key generic attributes (Table 1), which were selected from literature 9 , 14 , 16 , 17 , 18 , 19 , 20 , 22 , 25 , 27 , 28 , 32 and questionnaire results. 34 Through discussion with hospital management and medical specialists, it was assured that the attribute levels represented realistic options.
Table 1.
Attributes (and their values) in the scenarios of the centres for ambulatory care in the three discrete choice experiments
| Attributes | Discrete choice experiments | |||
|---|---|---|---|---|
| 1 | 2 | 3 | ||
| ECG (eight vignettes) | Pre‐operative screening total hip (eight vignettes) | Consultation for diabetes (16 vignettes) | ||
| 1 | Consultations with same specialist vs. different specialist | x | Yes/no | Yes/no |
| 2 | Consecutive consultations vs. consultations on different days | x | Yes/no | Yes/no |
| 3 | Consultations at the same hospital location vs. at different hospital locations | Yes/no | x | x |
| 4 | Time in waiting room less than 15 minutes vs. 15 to 30 minutes | Yes/no | Yes/no | x |
| 5 | Waiting list shorter than 2 weeks vs. 2 to 6 weeks | x | x | Yes/no |
| 6 | Information desk for questions on health and diseases vs. no such desk | Yes/no | x | Yes/no |
x, not selected attribute for the experiment.
The first two discrete choice experiments each had three relevant attributes with two possible values. Therefore, these experiments each resulted in eight vignettes (23). The third experiment, on consultations for diabetes care, had four attributes with two values and thus resulted in 16 (24) vignettes. Here we used an orthogonal array of eight vignettes as an alternative to the full factorial design to minimize the number of vignettes. The orthogonal array is a random, representative selection of the total 16 vignettes and a subset of all the possible combinations that still allows estimation of the main effects. 35 This orthogonal design was generated by the statistical package spss, (SPSS Inc., Chicago, IL, USA) which automatically guarantees equal distribution of value labels for the attributes within the vignette selection. Thus, in total 24 vignettes (three experiments with each eight vignettes) were presented to all respondents.
For each vignette participants were asked to choose between a visit to the centre for ambulatory care or the hospital, taking into consideration their realistic travel time to these locations. The hospital scenario was a constant comparator in the vignettes, i.e. it did not vary and stated the positive feature for each attribute in all vignettes. This is based on the presumption that the quality attributes are more likely to be realized at a large hospital location, where all staff disciplines and medical equipment are continuously present, than in small, not fully equipped centres for ambulatory care, where each discipline offers outpatient services only 1 day a week. To illustrate the hospital scenario: in all ECG vignettes it stated the possibility to have all consultations scheduled at the same location, to spend <15 min in the waiting room and the availability of an information desk for questions on health and diseases (attributes 3, 4 and 6 in Table 1, see also Appendix I).
Analysis of discrete choice experiment data
To analyse which factors influence the choice between a visit to the ambulatory care centre and the hospital, logistic regression analyses were performed. This actual choice was the dependent variable and the attributes of the vignettes and respondent variables, as stated in Table 5, were the independent variables. The fit of the model was tested with a chi‐square test. The effect of the independent variables on the choice for the ambulatory care centre or the hospital was tested with Wald‐statistics. A correlation table was used to check for multicollinearity. The models percentage of explained variance was estimated by use of the Nagelkerke R 2.
Table 5.
Patients’ expectations on future choice to visit their adjacent centre for ambulatory hospital care, the regional hospital or their general practice for three types of outpatient consultations (N max = 1042)a
| Centre for ambulatory hospital care | Hospital Bernhoven | Other hospital | General practice | |||||
|---|---|---|---|---|---|---|---|---|
| N | % | N | % | N | % | N | % | |
| Consultation with a physician | 741 | 72 | 258 | 25 | 24 | 2 | x | x |
| Consultation with a specialized nurse | 700 | 69 | 173 | 17 | 13 | 1 | 133 | 13 |
| Consultation for pre‐operative screening | 599 | 58 | 443 | 43 | x | x | x | x |
x, non‐existent answer category.
a N max = the maximum number of respondents that answered the items.
Results
Questionnaire study
Table 2 shows the respondents' characteristics. Respondents’ mean age was 59 years. Fifty‐six per cent of the respondents was female. Four‐fifth of the respondents suffered from a chronic disease or disorder. The most common were osteoarthritis (28%), coronary heart diseases (24%), diabetes mellitus (23%) and asthma or chronic obstructive pulmonary disease (COPD) (20%). A majority of patients (88%) had contact with a medical specialist in 2005. On average these patients had four contacts with a medical specialist, either in an outpatient clinic, telephone consultation, medical examination or emergency room.
Table 2.
Background characteristics of respondents (N max = 1066a)
| N | % | |
|---|---|---|
| Sex | ||
| Female | 589 | 56 |
| Male | 464 | 44 |
| Age | ||
| Younger than 65 years | 552 | 53 |
| 65 years or older | 497 | 47 |
| Level of education | ||
| Low | 584 | 56 |
| Middle | 308 | 30 |
| High | 123 | 13 |
| Other | 28 | 3 |
| Perceived health | ||
| Reasonable/poor | 401 | 38 |
| (Very) good/excellent | 659 | 62 |
| Perceived disability | ||
| (Severely) disabled | 300 | 28 |
| Not/little disabled | 766 | 72 |
| Chronic disease or disorder | ||
| Yes | 805 | 78 |
| No | 228 | 22 |
| Transport to the nearest hospital locationb | ||
| With respondent’s own car | 582 | 55 |
| By bike or scooter | 352 | 33 |
| With someone else’s car | 170 | 16 |
| Walking | 106 | 10 |
| Other (taxi, public transport, other) | 116 | 11 |
| Miles | Minutes | |
|---|---|---|
| Travel distance and travel time (by car) | ||
| To nearest location (future centre for ambulant hospital care) | 4.7 | 14.8 |
| To new regional hospital | 8.3 | 18.3 |
aMissing values: sex 2% (n = 20), age 2% (n = 24), level of education 3% (n = 30), perceived health 1% (n = 13), perceived disability 1% (n = 7), chronic disease or disorder 4% (n = 40).
bMore than one answer possible.
The future distance to the new hospital was 8.3 miles on average, whereas the current average travelling distance to the nearest hospital location was 4.7 miles. The future travel time by car to the hospital would be on average 18.3 min, varying from 0 to 38 min. This represents an increase of 3.5 min, since the current travel time to the nearest hospital location was 14.8 min. The current average travelling distance was thus quite short, but would significantly increase in the future situation.
Wishes with respect to facilities at the centres for ambulatory care
Of all optional care facilities at the future centre for ambulatory hospital care (Table 3) the respondents above all wished possibilities for medical examination, like having an ECG or an X‐ray. Table 3 shows the importance scores of these facilities and the percentage of respondents that considered a facility as (extremely) important. The elderly rated the possibility to give blood for examination of higher importance than other respondents (F = 8.2, P < 0.001). Especially elderly and low educated respondents wished for the possibility to have an ECG or lung function examination (F = 10.7–6.9, P < 0.001). Lower educated, chronically ill and elderly respondents stressed the importance of a possibility for screening prior to operative surgery at the centres for ambulatory care (F = 14.8–5.4, P < 0.01). Patients also expected consultations as facilities at the future centres for ambulatory hospital care and favoured those with a medical specialist. Especially lower educated respondents emphasized the importance of medical consultations for all possible diseases (F = 19.1, P < 0.0001). In general, respondents acknowledged more urgency to consultations for the most common diseases (e.g. diabetes) than for other diseases and conditions.
Table 3.
Patients’ wishes with respect to facilities at the centres for ambulatory hospital care (N max = 1053a)
| Facilities | Importance score (1–4) | (Extremely) important | |
|---|---|---|---|
| Mean | N | % | |
| Medical examination | |||
| Possibility to give blood (for examination) | 3.4 | 969 | 92 |
| Possibility to have an X‐ray or ultra‐sound scan made | 3.3 | 944 | 91 |
| Possibility to have an ECG or lung function examination made | 3.3 | 926 | 88 |
| Possibility for screening or consultation prior to operative surgery | 3.1 | 844 | 81 |
| Consultations and treatment | |||
| Medical consultations for the most common diseases (e.g. diabetes) | 3.0 | 784 | 76 |
| Specialized nurses for most common diseases | 2.9 | 742 | 72 |
| Medical consultations for all possible diseases | 2.8 | 707 | 68 |
| Paramedic care (e.g. physical therapists, occupational therapists, dieticians and speech‐trainers) | 2.6 | 608 | 59 |
| Other services | |||
| Loan depot for medical devices and mobility aids (e.g. wheelchairs, crutches) | 2.6 | 591 | 57 |
| Information desk on health and diseases | 2.6 | 585 | 56 |
| Pharmacy | 2.3 | 501 | 48 |
| Information desk on healthcare and housing facilities | 2.2 | 412 | 40 |
| Information desk with leaflets and brochures | 2.2 | 386 | 37 |
Mean importance score (1 = not important; 4 = extremely important) and the number and percentages of respondents that rated a service or facility as (extremely) important (score 3 or 4).
a N max = the maximum number of respondents that answered a question.
Additionally, more than half of the respondents gave high importance ratings to paramedic care, info desks and a loan depot for medical devices and mobility aids (e.g. wheelchairs, crutches) at the centres for ambulatory care. Lower educated respondents stressed the importance of paramedic care (F = 19.1, P < 0.0001). Elderly and low educated respondents had the strongest wish for a loan depot for medical devices and mobility aids (F = 9.2, P < 0.001). Similarly, low educated respondents, elderly, chronically ill and handicapped respondents most valued an info desk for questions on healthcare and housing facilities (F = 13.7–6.1, P < 0.001).
Expectations with respect to quality aspects of outpatient hospital care
The most important aspect of hospital care was continuity, with an average importance score of 3.3. Importance scores and the percentages of respondents that considered an item as (extremely) important for all quality aspects are shown in Table 4. Respondents appreciated communication between their doctors and seeing the same doctor at different visits. They also valued the interpersonal continuity of the specialized nurse. Linear regression on the scale continuity (R 2 = 0.03) showed that women and disabled people valued continuity of care more than other respondents (respectively β = 0.12 and β = 0.13; P < 0.001).
Table 4.
Patients’ expectations of outpatient hospital care (N max = 1063a)
| Dimensions importance items | Mean (SD) | (Extremely) important | |
|---|---|---|---|
| N | % | ||
| Continuity of care | |||
| Communication between health care providers about the services I require | 3.33 (0.57) | 982 | 93 |
| The possibility to see the same physician at every visit | 994 | 94 | |
| The possibility to see the same specialized nurse at every visit | 846 | 80 | |
| Proximity | |||
| Hospital care within a distance of 6.2 miles from home | 3.32 (0.79) | 916 | 87 |
| Planning | |||
| Make sure that I can see a specialist within 2 weeks after being referred to him/her | 3.21 (0.56) | 1009 | 96 |
| Offer the possibility to have appointments scheduled consecutively on 1 day | 936 | 89 | |
| The time in the waiting room should be <15 min | 785 | 74 | |
| Consider my preferences for day and time when scheduling the visit | 774 | 73 | |
| One location | |||
| Possibility to receive all hospital care at one location | 3.12 (0.85) | 864 | 82 |
| Attainability by transportation | |||
| Enough parking space | 3.08 (0.64) | 877 | 84 |
| Good attainability with public transport | 848 | 83 | |
| Good attainability with taxi | 758 | 75 | |
| Accessibility by telephone and e‐mail | |||
| Consultations with physicians by telephone | 2.29 (0.74) | 574 | 55 |
| Consultations with specialized nurses by telephone | 80 | 44 | |
| Possibility to ask my physician or nurse questions by e‐mail | 343 | 34 | |
| Accessibility through out‐of‐hours and walk‐in consultations | |||
| Walk‐in consultations (without need for an appointment) with physician | 2.15 (0.78) | 437 | 42 |
| Walk‐in consultations (without need for an appointment) with nurse | 409 | 40 | |
| Possibility to have a consultation in the evening (after 18.00) | 398 | 39 | |
| Possibility to have a consultation in the weekend (Saturday and Sunday) | 396 | 38 | |
Importance ratings for dimensions of quality of hospital care (1 = not important; 4 = extremely important) and the number and percentages of respondents that considered the items as (extremely) important.
a N max = the maximum number of respondents that answered the items.
Secondly, proximity of care, a distance of <6.2 miles to the hospital, was considered crucial. People aged over 65 years and patients who did not travel by car particularly valued this item. Non‐car owners, women and the elderly appreciated the presence of hospital care in the vicinity (respectively β = 0.08; P < 0.05 and β = 0.1 and β0.09; P < 0.01). Higher educated respondents and respondents who often visited a specialist valued proximity less (respectively β = −0.1; P < 0.001 and β = −0.06; P < 0.05).
Good planning of care was the third dimension of health care quality that patients valued. Respondents valued appropriate scheduling of consultations, defined as having a medical consultation within 2 weeks from referral and scheduling of appointments consecutively on 1 day. Finally, the item ‘the time in the waiting room should be <15 min’ was scored as important by three‐fourth of the respondents. Linear regression on planning (R 2 = 0.014) showed that women and disabled people valued planning of care more highly than other respondents (respectively β = 0.08 and β = 0.13; P < 0.01). However, the elderly valued these items less (β = −0.07, P < 0.05).
Almost half of the respondents considered attainability by transportation as (extremely) important. Age and sex were significant predictors for the scale transport (R 2 = 0.03). Of all respondents, women and elderly considered attainability most crucial (β for both 0.01; P < 0.001).
Patients favoured a good accessibility by phone and e‐mail. Linear regression on the scale accessibility by telephone and e‐mail (R 2 = 0.07) showed that disabled and more educated people valued this more than other respondents (β for both 0.1; P < 0.01). Of all respondents, the elderly appreciated the possibility for telephone and e‐mail contacts and consultations least (β = −0.3; P < 0.001).
Less than half of the respondents regarded the accessibility of care through walk‐in and out‐of‐hours consultations as (extremely) important. Disabled and lower educated respondents appreciated this accessibility more (respectively β = 0.09; P < 0.05 and β = 0.12; P < 0.001; R 2 = 0.02). Overall, sex, age, level of education and perceived disability were the main determinants of patients’ expectations regarding quality of hospital care.
Expectations with respect to future visits to the centres for ambulatory care
Finally, the questionnaire asked for patients’ expectations of their future preferences to visit their adjacent centre for ambulatory hospital care, the regional hospital or their general practice for three types of outpatient consultations. Patients living near a centre for ambulatory care expected to prefer to visit the centre for ambulatory hospital care in their vicinity instead of the regional hospital. Especially for consultations with a medical specialist or a specialized nurse they favoured a visit to the ambulatory care centre (Table 5). For consultations concerning pre‐operative screening, more patients (43%) stated they would rather visit the hospital.
Discrete choice experiment
When confronted with differences in quality of care between the hospital and the nearest centre for ambulatory hospital care, patients seemed to care less about proximity. But their preferences depended on the situation and medical need. When needing an ECG, most of the patients still preferred to visit the adjacent centre for ambulatory care (Fig. 1). However, for consultations concerning diabetes care and especially pre‐operative screening, more patients chose to visit the hospital. Thus, when quality in the centre for ambulatory care was presented as poorer than in the hospital, patients were more likely to decide to visit the distant hospital.
Figure 1.
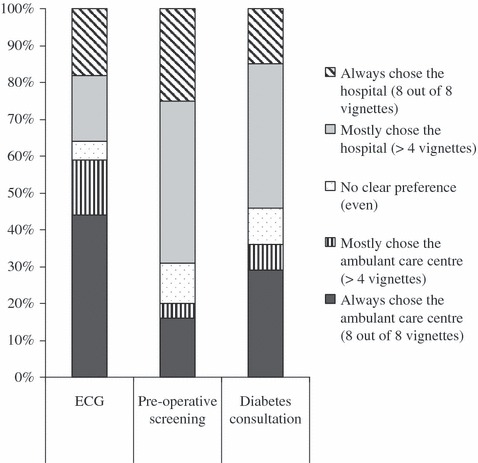
Percentage of respondents (N = 75) who preferred to visit the centre for ambulatory care or the hospital in a discrete choice experiment in three situations (eight vignettes per situation).
The attribute interpersonal continuity in particular influenced patients’ choice for the centre for ambulatory care or the hospital (Table 6). In the discrete choice experiments about pre‐operative screening and diabetes consultation this was the most important determinant. When patients could not see their familiar physician in the centre for ambulatory care, they more often chose to visit the hospital, where this is most likely to be guaranteed. For pre‐operative screening, the presence of a waiting list additionally explained patients’ choice. When the waiting list for a consultation in the ambulatory care centre was longer than 2 weeks, patients would rather visit the hospital were they could be seen earlier. For the diabetes consultation, patients favoured visiting the hospital when different appointments could be scheduled consecutively on 1 day, instead of visiting the ambulatory care centre twice. When needing an ECG examination, the possibility to have all consultations scheduled at the same location and the facility of an information desk for questions on health and diseases at the location determined patients’ choice. The time in the waiting room did not influence patients’ choice in any of the situations. Older people, those with a low education level and disabled respondents more often than other patients chose to visit the hospital instead of the adjacent ambulatory care centre.
Table 6.
Determinants of the choice for a visit to the centre for ambulatory hospital care (instead of the hospital) (N = 75)
| ECG | Pre‐operative screening total hip replacement | Consultation diabetes care | ||||
|---|---|---|---|---|---|---|
| OR | 95% CI | OR | 95% CI | OR | 95% CI | |
| Attributesa | ||||||
| Interpersonal continuity (same specialist or nurse) | x | x | 3.9 | 2.5–6.1 | 3.6 | 2.4–5.5 |
| Waiting list (shorter than two weeks) | x | x | 3 | 1.9–4.6 | x | x |
| Consecutive consultations | x | x | 2.2 | 1.4–3.4 | 2.5 | 1.7–3.8 |
| Consultations at the same location | 1.7 | 1.1–2.5 | x | x | x | x |
| Information desk for questions on health and diseases | 1.5 | 1.0 tot 2.3 | x | x | ns | |
| Time in the waiting room (<15 min) | ns | x | x | ns | ||
| Transport and distance to the hospital | ||||||
| Transport | ||||||
| With respondent’s own carb | (1.0) | (1.0) | (1.0) | |||
| With someone else’s car | ns | 5.6 | 1.4–23.2 | ns | ||
| Other (no car) | 2.8 | 1.7–4.5 | 2.9 | 1.7–4.9 | 2.0 | 1.2–3.3 |
| Distance to the hospital (longer vs. shorterb than the median distance) | 1.9 | 1.2–2.9 | 1.8 | 1.2–2.8 | 1.6 | 1.0–2.4 |
| Respondent features | ||||||
| Sex (female vs. maleb) | 1.9 | 1.2–2.9 | ns | ns | ||
| Education | ||||||
| Highb | (1.0) | (1.0) | (1.0) | |||
| Middle | 0.4 | 0.3–0.8 | 0.4 | 0.2–0.6 | 0.4 | 0.2–0.6 |
| Low | 0.5 | 0.3–0.8 | ns | 0.5 | 0.3–0.8 | |
| Age (65 years or older vs. 65b) | 0.4 | 0.3–0.7 | 0.2 | 0.2–0.4 | ns | |
| Perceived disability (severely disabled – not disabledb) | 0.3 | 0.2–0.6 | ns | ns | ||
OR, odds ratios, CI, confidence intervals.
Results of logistic regression analysis (method enter): OR and 95% CI for the attributes of vignettes and respondent variables.
x, not selected attribute for the experiment.
ns, not significant (P < 0.05).
aThe variable specialist contact and the constant of the model are not shown, both are not significant in any of the three experiments.
bReference category.
The models gave a reasonable percentage of explained variance. By estimation of the Nagelkerke R 2, Twenty‐three per cent of the variance in the discrete choice experiment on the ECG was explained by the model. For the discrete choice experiments on pre‐operative screening and diabetes consultation, this is respectively 34% and 29%. The correlation matrix proved that correlations between the attributes of the vignettes were absent.
Conclusions
Although patients welcomed a broad range of services to be offered in the new centres for ambulatory hospital care, this study showed clear patient priorities regarding future regional ambulatory care centres. Thus, patients seem to be able to prioritize in hospital health care. According to the elderly and chronically ill patients of hospital Bernhoven, possibilities for examination and medical consultations are the most crucial functions of the ambulatory care centres. Paramedic care, info desks, a loan depot for medical devices and mobility aids and a pharmacy are optional and make the centre more appealing especially for the elderly and handicapped.
When quality of care was presented as equal for the ambulatory care centre and the hospital, patients preferred to visit the adjacent centre for ambulatory hospital care. The description of quality of care at the ambulatory care centre varied on interpersonal continuity, length of the waiting list and the possibility to schedule consecutive appointments. For short, non‐scheduled or diagnostic consultations, patients preferred to visit the adjacent centre for ambulatory care. When multidisciplinary care for a chronic condition was needed, most patients preferred interpersonal continuity and consecutive consultations. Additionally, for pre‐operative screening, patients preferred short waiting lists. When the centre for ambulatory hospital care was presented as offering poorer quality on these aspects than the hospital, most patients chose to travel to the hospital. Thus in this setting, with an average travel distance of 8.3 miles to the hospital and 4.7 miles to the nearest centre for ambulatory care, when choosing between the hospital and the adjacent centre, quality appears to matter more than proximity. In case of multidisciplinary care for a chronic condition, the continuity and guaranteed quality level of a hospital setting is preferred, whereas walk‐in examinations predominantly require proximity of care.
Discussion
As one of the major determinants in patients’ choice for a hospital is the proximity, 14 , 21 , 22 consulting patients or citizens on changes in the hospital profile seems relevant. This is true, even in a health care system where patients are supposed to influence quality by switching away from a particular care provider when dissatisfied.
As far as we know, this is the first study on patients’ choice to visit a nearby ambulatory care centre or a more distant hospital. The finding that the outcome of this choice is dependent on medical need (medical examination, pre‐operative screening or consultation) has, to our best knowledge, not been reported previously.
According to the literature, reputation is the most significant determinant of patients’ choice of hospital. However, because reputation is difficult to influence and difficult to measure for a future centre, it was not incorporated in the current study. Other aspects mentioned in the literature indeed proved to be relevant in this study. This research confirmed the role of proximity as one of the most relevant aspect for patients when selecting a hospital, but in accordance with earlier research of Van Rijen 22 the length of the waiting list and the possibility to see the same specialist at each visit are found to be even more important. In the current study, patients prioritized the possibility to visit their familiar specialist above the proximity of care. Longer waiting lists and a lack of possibility to schedule appointments consecutively in the ambulatory care centre also made patients opt more often to visit a hospital where these conditions could be fulfilled. This study thus provides information on the order of determinants in patients’ choice for a visit to a regional hospital or an adjacent centre for ambulatory care.
The additional value of the discrete choice experiment above the questionnaire data is a more realistic simulation of the future situation. The questionnaire assessed the importance of certain aspects. In the choice experiment, respondents chose a situation based on a combination of aspects, in which they needed to make trade‐offs between aspects. 36 Especially in a healthcare system that is regulated by patients’ choice for a care provider, data from realistic simulation of a trade‐off situation seems to be important input for policy makers. Compared with the questionnaire results, results of the discrete choice experiments show more relevance of quality as opposed to proximity of care. The vignette study also shows that patients’ trade‐offs differ across various contexts and health needs.
The vignettes were based on hospital Bernhoven’s quality objectives concerning the future hospital. Whereas the quality levels of the centres for ambulatory care varied in the vignettes, the characteristics of the hospital location did not vary, but were always positively formulated. This quality level offered at the future hospital was an assumption that still has to be realized.
There is evidence that people adopt a conservative response to health service innovations, preferring the service they have previously experienced; the status quo. 37 Because centres for ambulatory care with as many facilities as possible best equal the current hospitals, this could explain the preference for the many functions of the centres for ambulatory care that respondents expressed in the questionnaires. Also, as the respondents in this study did not have experience with the future centres for ambulatory care, this could have influenced the results of the discrete choice experiment towards a preference for the future hospital. Further research is needed to unravel the influence of the status quo and changes in the reputation of a health care provider on the expectations and actual choices of patients.
Acknowledgements
We thank the board of directors of hospital Bernhoven for financing this study. We owe Margreet Janssen, Reina de Bruijn and Cindy Uijen of hospital Bernhoven for the practical help in organizing this study and the ‘Project team patient consultation’ for comments on the research results. The views expressed in the paper are those of the authors alone.
Appendix I. Example vignette
Discrete choice experiment: ECG
Suppose, you need to have an ECG. This is a walk‐in examination.
You can choose between a visit to the hospital or the centre for ambulatory care.
| Hospital The time in the waiting room is <15 min. The next consultation with your physician will be at the same location (in the hospital). In the hospital is an information desk for questions on health and diseases. |
| Centre for ambulatory care The time in the waiting room is < 15 min/15–30 min 1 The next consultation with your physician will be at the same location (in the centre for ambulatory care)/ will be at a different day and not on the same location (but in the hospital) 1 In the centre for ambulatory care is an information desk for questions on health and diseases/is no information desk for questions on health and diseases 1 . |
1Words in italics show the variation in the vignettes for the attributes.
Where do you want to go for this examination?
Hospital.
Centre for ambulatory care.
This work has not been published and is not being considered for publication elsewhere. All authors meet the journal’s criteria for authorship.
References
- 1. Gibson JL, Martin DM, Singer PA. Setting priorities in health care organizations: criteria, processes, and parameters of success. BMC Health Services Research, 2004; 4: 25. [DOI] [PMC free article] [PubMed] [Google Scholar]
- 2. Reeleder D, Martin DM, Keresztes C, Singer PA. What do hospital decision‐makers in Ontaria, Canada, have to say about the fairness of priority setting in their institutions? BMC Health Services Research, 2005; 5: 8. [DOI] [PMC free article] [PubMed] [Google Scholar]
- 3. Moayyedi P, Wardman M, Toner J, Ryan M, Duffett S. Establishing patient preferences for gastroenterology clinic reorganization using conjoint analysis. European Journal of Gastroenterology and Hepatology, 2002; 14: 429–433. [DOI] [PubMed] [Google Scholar]
- 4. Pickard S, Marshall M, Rogers A et al. User involvement in clinical governance. Health Expectations, 2002; 5: 187–198. [DOI] [PMC free article] [PubMed] [Google Scholar]
- 5. South J, Fairfax P, Green E. Developing an assessment tool for evaluating community involvement. Health Expectations, 2005; 8: 64–73. [DOI] [PMC free article] [PubMed] [Google Scholar]
- 6. Rosén P, Karlberg I. Opinions of Swedish citizens, health‐care politicians, administrators and doctors on rationing and health‐care financing. Health Expectations, 2002; 5: 148–155. [DOI] [PMC free article] [PubMed] [Google Scholar]
- 7. Rosén P. Public dialogue on health care prioritisation. Health Policy, 2006; 79: 107–116. [DOI] [PubMed] [Google Scholar]
- 8. Gerard K, Lattimer V, Surridge H et al. The introduction of integrated out‐of‐hours arrangements in England: a discrete choice experiment of public preferences for alternative models of care. Health Expectations, 2006; 9: 60–69. [DOI] [PMC free article] [PubMed] [Google Scholar]
- 9. TNS NIPO . Choosing in Health Care. (Kiezen in de gezondheidszorg). Zoetermeer: Council for Public Health & Health Care (RVZ), 2003. [Google Scholar]
- 10. Groenewoud AS, Kreuger L, Huijsman R. Freedom of Choice, Possibilities to Choose and Decision Support in Health Care. (Keuzevrijheid, keuzemogelijkheden en keuze‐ondersteuning in de Gezondheidszorg). Rotterdam: Instituut Beleid & Management Gezondheidszorg, 2006. [Google Scholar]
- 11. Delnoij D. Demand Driven Health Care in International Perspective, a Study on Patients’ Possibilities to Choose in Different Health Care Systems (Vraaggestuurde zorg in internationaal perspectief, een studie naar keuzemogelijkheden van patiënten in verschillende gezondheidszorgsystemen. Zoetermeer: Council for Public Health & Health Care (RVZ), 2003. [Google Scholar]
- 12. Delnoij D, Bensing J. Demand driven health care in the Netherlands. (Nachfragesteuerung im niederländischen Gesundheitswesen: Wunsch und Praxis). Managed Care, 2004; 8: 36–38. [Google Scholar]
- 13. Hirschman AO. “Exit, Voice, and Loyalty:” further reflections and a survey of recent contributions. Milbank Memorial Fund Quarterly Health and Society, 1980; 58: 430–453. [PubMed] [Google Scholar]
- 14. Leys M. Choices in health care: preference and competences of consumers. (Kiezen in zorg: preferentie en competenties van consumenten: een ‘quick scan’ van aandachtpunten en wetenschappelijke inzichten). Den Haag: the Netherlands Organisation for Health Research and Development (ZonMw; ), 2003. [Google Scholar]
- 15. Coenen CCMG, Konig CJLF. Towards demand driven hospital care?; results of a questionnaire. (Op weg naar vraagsturing in de ziekenhuiszorg?: resultaten van een enquête). TSG: Tijdschrift voor Gezondheidswetenschappen, 2006; 84: 482–487. [Google Scholar]
- 16. Burge P, Devlin N, Appleby J, Rohr C, Grant J. London Patient Choice Project Evaluation. London: RAND, 2005. [DOI] [PubMed] [Google Scholar]
- 17. Schwartz LM, Woloshin S, Birkmeyer JD. How do elderly patients decide where to go for major surgery? Telephone interview survey. British Medical Journal, 2005; 331: 821. [DOI] [PMC free article] [PubMed] [Google Scholar]
- 18. Van der Schee E, Delnoij D, Kerssens J. Choice of hospitals: which considerations are important to consumers? (Keuze van ziekenhuizen: welke overwegingen zijn belangrijk voor consumenten?) TSG: Tijdschrift voor Gezondheidswetenschappen, 2005; 83: 113–115. [Google Scholar]
- 19. Douglas KM, Potter T, Treharne GJ et al. Rheumatology patient preferences for timing and location of out‐patient clinics. Rheumatology (Oxford), 2005; 44: 80–82. [DOI] [PubMed] [Google Scholar]
- 20. Finlayson SRG, Birkmeyer JD, Tosteson ANA, Nease RF. Patient preferences for location of care, implications for regionalization. Medical Care, 2002; 37: 204–209. [DOI] [PubMed] [Google Scholar]
- 21. RVZ . The Preferences of Healthcare Customers in Europe. Zoetermeer: Council for Public Health & Health Care (RVZ), 2003. [Google Scholar]
- 22. Van Rijen AJG. Internet user and choosing care (Internetgebruiker en kiezen van zorg). Zoetermeer: Council for Public Health & Health Care (RVZ), 2003. [Google Scholar]
- 23. Dückers MLA, Bles B, Wagner C. Patient’s choice for a hospital in case of a non urgent knee operation. (De keuze van de patiënt voor een ziekenhuis bij een niet acute knieoperatie). unpublished 2006.
- 24. Ziekenhuis Bernhoven. Hospital Bernhoven Policy Framework 2006–2010 (Bernhoven: ziekenhuis voor de regio Oss‐Uden‐Veghel, Ziekenhuisbeleidskader 2006–2010). Oss/Veghel: Bernhoven, 2005. [Google Scholar]
- 25. Gruen RL, Weermanthri TS, Knight SE, Bailie RS. Specialist outreach clinics in primary care and rural hospital settings (review). The Cochrane Database of Systematic Reviews, 2003; 4: 1–64. [DOI] [PMC free article] [PubMed] [Google Scholar]
- 26. Saultz JW. Defining and measuring interpersonal continuity of care. Annals of Family Medicine, 2003; 1: 134–143. [DOI] [PMC free article] [PubMed] [Google Scholar]
- 27. Love MM, Mainous AG III, Talbert JC, Hager GL. Continuity of care and the physician‐patient relationship: the importance of continuity for adult patients with asthma. Journal of Family Practice, 2000; 49: 998–1004. [PubMed] [Google Scholar]
- 28. Nutting PA, Goodwin MA, Flocke SA, Zyzanski SJ, Stange KC. Continuity of primary care: to whom does it matter and when? Annals of Family Medicine, 2003; 1: 149–155. [DOI] [PMC free article] [PubMed] [Google Scholar]
- 29. Groenewegen PP, Kerssens J, Sixma H, Eijk van der I, Boerma W. What is important in evaluating health care quality? An international comparison of user views. BMC Health Services Research, 2005; 5: 16. [DOI] [PMC free article] [PubMed] [Google Scholar]
- 30. Sixma H, Kerssens J, Campen van C, Peters L. Quality of care from the patients’ perspective: form theoretical concept to a new measuring instrument. Health Expectations, 1998; 1: 82–95. [DOI] [PMC free article] [PubMed] [Google Scholar]
- 31. Feeney CL, Roberts NJ, Partridge MR. Do medical outpatients want ‘out of hours’ clinics? BMC Health Services Research, 2005; 5: 47. [DOI] [PMC free article] [PubMed] [Google Scholar]
- 32. Janse AFC, Hutten JBF, Spreeuwenberg P. Patients judge of hospitals II: patients’ experiences and opinions on 37 Dutch hospitals (Patiënten oordelen over ziekenhuizen II: ervaringen en meningen van patiënten in 37 Nederlandse ziekenhuizen). Utrecht: NIVEL, 2002. [Google Scholar]
- 33. Smit M, Friele R. The patient’s agenda (De agenda van de patiënt). Utrecht: NIVEL, 2005. [Google Scholar]
- 34. Albada A, Triemstra M. Hospital with ambulatory care centres, what do patients of Hospital Bernhoven want. (Ziekenhuis met servicepunten, Wat willen patiënten van ziekenhuis Bernhoven). Utrecht: NIVEL, 2006. [Google Scholar]
- 35. Kerssens JJ, Groenewegen PP. Consumer preferences in social health insurance. European Journal of Health Economics, 2005; 6: 8–15. [DOI] [PubMed] [Google Scholar]
- 36. Ryan M, Bate A, Eastmond CJ, Ludbrook A. Use of discrete choice experiments to elicit preferences. Quality in Health Care, 2001; 10: 55–60. [DOI] [PMC free article] [PubMed] [Google Scholar]
- 37. Salkeld G, Ryan M, Short L. The veil of experience: do consumers prefer what they know best. Health Economics, 2000; 9: 267–270. [DOI] [PubMed] [Google Scholar]