

Abstract
Aim
Patient perception measures are gaining increasing interest among scholars and practitioners. The aim of this study was to empirically examine a conceptual model of patient‐centred care using patient perception survey data.
Background
Patient‐centred care is one of the Institute of Medicine's objectives for improving health care in the 21st century. Patient interviews conducted by the Picker Institute/Commonwealth Fund in the 1980s resulted in a theoretical model and survey questions with dimensions and attributes patients defined as patient‐centered.
Method
The present study used survey data from patients with overnight visits at 142 U.S. hospitals.
Results
Regression analysis found significant support for the theoretical model. Perceptions of emotional support had the strongest relationship with overall care ratings. Coordination of care, and physical comfort were strongly related as well.
Conclusion
Understanding how patients experience their care can help improve understanding of what patients believe is patient‐centred, and of how care processes relate to important patient outcomes.
Keywords: patient experience, patient perceptions, patient‐centred care
Patient‐centred care was put forth by the Institute of Medicine (IOM) as one of its six objectives for improving health care in the 21st century.1 Since then, healthcare organizations have embraced patient‐centred care as central to their strategic missions and values. Davis et al.2 pointed out that we commonly define quality as, ‘the right care in the right way at the right time’, but that patient‐centredness defines quality as, ‘…providing care that the patient needs in the manner the patient desires at the time the patient desires’ (p. 953). The IOM1 indicated that patient‐centred care encompasses providing care that is compassionate, empathetic and responsive to the needs, values and expressed preferences of each individual patient and that patients should be informed decision‐makers in their care. In today's complex healthcare organizations, with their limited resources, it is not surprising that organizations often find it difficult to live up to these standards. Indeed, the IOM pointed out that patient‐centred care is often not well implemented.
Although most hospitals believe they have implemented patient‐centred care, many have not, and care continues to be delivered in a disease‐ or physician‐centred manner.3, 4 For example, some hospital actions directed at enhancing the patient experience (e.g. greeters and appearance) are often erroneously interpreted as patient‐centred care initiatives.5 Additionally, one observational study found that nurses who believed they were patient‐centred were found to mostly be process‐centred when observed during medication administration at the bedside.6 Such examples illustrate the confusion related to defining patient‐centredness.5 Bechel et al.3 distinguished among the concepts of patient‐focused care, patient‐based care and patient‐centred care. They defined patient‐centred care as emphasizing improved outcomes, humanness of care and increasing value by: (i) involving patients in decisions; (ii) increasing patient and provider communication and understanding; and (iii) involving family members as part of the care team. In contrast, they argued that patient‐focused care emphasizes tailoring services to patient needs as opposed to providing generic services; and patient‐based care emphasizes processes at the individual level as opposed to the unit or department level. Distinguishing among these similar concepts can be important as organizations begin the movement towards true patient‐centredness in their care. Current focus among many hospitals on continuous quality improvement (CQI) necessitates that they consider consumer wants and needs in delivery of health care. However, just because an organization collects patient perception data does not mean it is delivering patient‐centred care.
There is a growing body of evidence that providing patient‐centred care can lead to positive clinical outcomes for patients, as well as increasing their satisfaction.3, 7, 8, 9, 10 Our study contributes to this evidence by empirically testing a model based on the seven theoretical dimensions of patient‐centred care put forth by the Picker Institute11 and the IOM.1 This theoretical model has received attention in the literature and has formed the basis for data collected for quality improvement and public reporting purposes. However, to our knowledge, the model has not been tested as a unified construct. Our study tested a commonly used set of patient perception measures to examine how dimensions of patient‐centred care are related to patients' overall ratings of their care. In this way, we make an empirical contribution to future research and practice.
Background
Patient feedback often plays an important role in decisions for quality improvement efforts, and additionally, many managers are held accountable for patient satisfaction results.12 The IOM and the Joint Commission have asserted that, in addition to typical clinical indicators, patient evaluations of their care are important tools for assessing quality. Patient perceptions of patient‐centred care have often been used for this purpose. There is evidence that patient‐centred care may have effects long after the clinical visit.7, 8, 13 A study of U.S. Veterans Affairs (VA) outpatient clinics found that clinics where patients reported higher levels of patient‐centred care also provided more preventive services as recommended by the U.S. Preventive Services Task Force. However, evidence suggests that to be most effective, patient evaluation measures must go beyond traditional satisfaction measures and capture aspects of patient‐centred care.
Traditional patient satisfaction measures were modelled after hotel industry satisfaction measures. However, in recent years, research has demonstrated that patient satisfaction is but one aspect of the full patient experience.3, 15, 16 Research using patient perceptions has demonstrated that typical ‘satisfaction’ measures often do not capture the elements of health care that patients have said are most important to them,15, 17 and thus, these measures have had limited utility for actually improving the quality of care delivery. For example, empirical research has found that, although respondents rate their satisfaction as high, when asked specifically about whether certain important patient‐centred processes did or did not occur, they report problems.18 Starfield19 argued that quality assessment research should start with ‘patient‐defined problems’ (p. 1006) as a complement to clinical quality improvement efforts. Patients should be engaged to share power in their care experience.20 Thus, in recent years, measures of patient‐centred care from the patient perspective have been developed and utilized.
Development and validation of measures
The Picker Institute conducted extensive research starting in the late 1980s to better understand the patient experience.11, 17 The researchers began by conducting focus groups with several hundred patients with recent hospital visits in U.S. cities to learn about their experiences and characteristics of care delivery that were important to them. This was followed by telephone interviews with 6455 patients with recent visits to 62 hospitals across the United States.21 The research resulted in identification of theoretical dimensions of patient‐centred care as well as survey measures of these dimensions.22
Patient‐centred care has often been conceptualized as consisting of eight dimensions.11, 12 The dimensions are as follows: (i) Respect for patients preferences, values and expressed needs; (ii) Coordination and integration of care and services; (iii) Information, education and communication; (iv) Physical comfort; (v) Emotional support; (vi) Involvement of family and close others; (vii) Continuity and transition from hospital to home; and (viii) Access to care and services. Following development of survey measures, Cleary et al.22 used multivariate statistics to tease apart a number of potential predictors of patient satisfaction, including patient demographics, health status, income, preferences for being more or less involved in care decisions and problems with specific processes of care. The researchers found that reported problems with specific care processes were the only meaningful predictors of patients' overall evaluations of their care.
The dimensions of care and relevant measures have been used in quality improvement initiatives in acute care settings.22, 23, 24 One such initiative used patient reports of problems with discharge planning to help drive an improvement plan that increased patient discharge throughput and satisfaction with the discharge process.24 In addition to their use in quality improvement, several large hospital public reporting projects in the United States, Canada and Europe have used the dimensions of patient‐centred care as the metric for evaluating and comparing the quality of the patient experience, and this information is publicly available for consumer review.25, 26, 27 Increasingly, patient‐centred care is becoming recognized as a quality indicator on which healthcare organizations should be evaluated.
Patient‐centred care and effectiveness
Research has demonstrated that patient perceptions of patient‐centred care can be linked to clinical and long‐term outcomes in addition to being a useful metric for quality improvement efforts.7, 15, 28 One study audio‐taped and scored interactions between patients and their physicians during 315 visits. The study found that patient‐centred communications, in particular, were associated with better physical and emotional recovery following physician visits. In addition, those who had been recipients of more patient‐centred practice had fewer diagnostic tests and referrals two months after the visit.29
In another example, acute myocardial infarction (AMI) patients who enrolled in the study prior to their hospital discharge were interviewed 1, 3 and 12 months later.13 Following discharge, among the 726 patients who remained in the study, those who reported more problems during their hospital stay at month 1 had more problems with their physical health 12 months later. They were more likely to have chest pain than those who reported more patient‐centred care in the hospital. Interestingly, these differences were not as drastic for patients who reported that their ambulatory follow‐up care was more patient‐centred. Another longitudinal study found that AMI patients who reported higher levels of patient‐centred care while hospitalized had significantly better survival rates 6 months and 1 year later.28 Such studies find encouraging evidence for the validity of patient perception measures.
The present study
Patient‐centred care has wide intuitive appeal, and empirical studies have linked patient perceptions of patient‐centred care with desirable outcomes. Patient perceptions have been measured in a variety of ways. As noted previously, a commonly used framework for patient‐centred care has been conceptualized as consisting of eight dimensions.1, 2 The present study tested relationships among seven dimensions and overall quality of care ratings, as depicted in Fig. 1.
Figure 1.
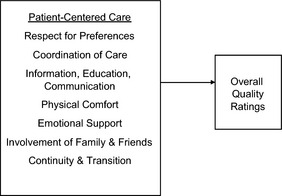
Theoretical model patient‐centred care and overall quality perceptions.
Although data using these measures have been collected and used for quality improvement purposes, an understanding of the nature of the dimensions and their relationships to overall quality perceptions could help in an effort to identify and benchmark care delivery practices that can be generalized across settings. Thus, we set out to explore the following research questions:
Research question 1: Are the theoretical dimensions of patient‐centred care predictive of overall quality of care ratings?
Research question 2: Is each of the theoretical dimensions equally predictive of overall quality of care ratings?
Method
Study design
The study used previously collected cross‐sectional survey data. Data had been collected using a paper‐and‐pencil questionnaire mailed to patient homes. Surveys were returned to the survey vendor and responses compiled in a data set (n = 68 447). Hospitals and patients were de‐identified prior to our analysis.
Participants
Patients who had a 24‐h or longer acute care stay at one of 142 U.S. hospitals had been randomly selected within 6 months of their visit and mailed a survey packet that included a cover letter, questionnaire and postage‐paid return envelope. Three weeks following the initial survey, sampled patients who had not responded were mailed a reminder cover letter, questionnaire and postage‐paid return envelope. Response rates varied by hospital and ranged from 35 to 65%, averaging 47% overall.
Measures
Measures consisted of the Picker Inpatient Survey,11, 17, 21, 22, 30 which has been shown to be a reliable measure, particularly for hospital care, and has been adapted and used in many settings.31 Seven dimensions of care were measured in the present study using 3–4 items each (see Appendix 1). The patient experience items were generally measured on a frequency scale, where 1 = yes always; 2 = yes, sometimes and 3 = no. This approach is known as patient ‘reports’ of ‘events that did or did not happen during a clinical encounter’32 (p. 1608). Some items asked about information or medication patients received, and these items used a categorical response scale where 1 = too much, 2 = right amount and 3 = not enough. These items were recoded into two categories for the analysis, where ‘too much’ and ‘not enough’ were considered a ‘problem’ and ‘right amount’ was considered ‘not a problem.’ Data from these measures often have been recoded in this way and have become known as ‘problem scores.’ Problem scores were designed as a useful way to report these data back to managers. As opposed to reporting means and standard deviations, results from these surveys often have been reported to managers in terms of the percentage of patients who reported problems with certain aspects of care.17 Dimensions measured were as follows:
Respect for patient preferences, values and expressed needs: Central to individualized, patient‐centred care is whether patient preferences, values and/or culture are embraced by those who provide care to them. An example from this dimension is ‘Did care providers treat you with respect and dignity during your stay?’
Coordination of care: This dimension covers whether or not the care patients received flowed smoothly across the many care providers and departments they encountered. One example item is ‘Sometimes in the hospital, one doctor or nurse will say one thing, and another will say something else. Did this happen to you?’
Information, education and communication: This measure includes four items that ask about the timeliness of information and whether or not information was presented in understandable language. An example item is ‘When you had important questions to ask a nurse, did you get answers you could understand?’
Physical comfort: Pain and other discomforts are experienced by most hospitalized patients; thus, how these needs are attended to should be important in patient experiences. Example items included ‘Do you think the hospital staff did everything they could to help you with your pain?’ and ‘When you needed help getting to the bathroom, did you get it in time?’
Emotional support. Patients are often distressed during an episode of acute care, so consideration of their mental as well as their physical being is important. An example item includes ‘If you had any anxieties or fears about your treatment or condition, did a nurse discuss them with you?’
Involvement of family and friends. Timely information to family is important in the acute care environment. An example item for this measure is ‘Did your family or someone close to you have enough opportunity to talk to your doctor?’
Continuity and transition. This dimension covers topics patients need to transition from hospital to home, such as medicines and when to resume normal activities. An example item is ‘Did someone tell you about medication side effects to watch for when you went home?’
Overall ratings of care
Several satisfaction items were asked at the end of the survey to capture respondent attitudes of their overall experiences. These items are similar to those that many hospitals use in surveying and for which unit managers are often held accountable. One example item is ‘Overall, how would you rate the care you received at the hospital?’ This item was rated on a 1–5 scale where 1 = poor and 5 = excellent. These items were recoded prior to analysis so that lower scores represented more positive ratings, to keep the items consistent with the patient‐centred care items.
Demographic items
Respondent health status was measured using self‐report survey items. Age and length of stay were included in the data obtained from the hospitals. These variables were selected as control variables for their potential impact on overall satisfaction, as other research has found them to be consistent predictors of overall satisfaction.33
Analysis
To separate the independent effects of the control variables and dimensions, a two‐stage regression model was utilized. Model one accounted for the effects of our three control variables, while the second model added the seven dimension variables to the equation. Standardized regression coefficients are reported in both models to facilitate comparison of the relative effect sizes of each variable.
Results
Means, standard deviations and Pearson correlations among the study variables are presented in Table 1. Given the large sample size, it is not surprising that virtually all the correlations were significant.
Table 1.
Means, standard deviations, intercorrelations and reliabilities
| Mean | SD | 1 | 2 | 3 | 4 | 5 | 6 | 7 | 8 | 9 | 10 | 11 | |
|---|---|---|---|---|---|---|---|---|---|---|---|---|---|
| 1 Self‐rated health | 2.84 | 1.13 | – | ||||||||||
| 2 Age | 57.79 | 21.8 | 0.45 | – | |||||||||
| 3 Length of stay | 6.32 | 16.1 | 0.09 | 0.10 | – | ||||||||
| 4 Respect for patient preferences | 1.2 | 0.36 | 0.09 | −0.04 | 0.03 | 0.59 | |||||||
| 5 Coordination of care | 1.3 | 0.38 | 0.13 | −0.09 | 0.04 | 0.37 | 0.60 | ||||||
| 6 Information, communication, education | 1.44 | 0.58 | 0.14 | 0.09 | 0.02 | 0.25 | 0.29 | 0.62 | |||||
| 7 Physical comfort | 1.49 | 0.59 | 0.07 | −0.11 | 0.03 | 0.34 | 0.37 | 0.30 | 0.60 | ||||
| 8 Emotional support | 1.36 | 0.43 | 0.16 | −0.02 | 0.04 | 0.44 | 0.52 | 0.52 | 0.48 | 0.80 | |||
| 9 Involvement of family and friends | 1.42 | 0.54 | 0.08 | −0.05 | −0.01 | 0.27 | 0.35 | 0.39 | 0.32 | 0.53 | 0.70 | ||
| 10 Continuity and transition | 1.63 | 0.67 | 0.15 | 0.09 | 0.04 | 0.22 | 0.30 | 0.39 | 0.31 | 0.46 | 0.51 | 0.83 | |
| 11 Overall | 2.07 | 0.71 | 0.21 | 0.00 | 0.04 | 0.44 | 0.56 | 0.46 | 0.49 | 0.72 | 0.50 | 0.46 | 0.91 |
Reliabilities are reported on the diagonal.
The regression‐labelled model one (Table 2) shows that the control variables accounted for 5.5% of the variance in overall satisfaction with each of the variables being significant. Model two added the seven dimension measures. The adjusted R 2 for model two was 0.638, which is a highly significant increase of 0.583 from model one. In other words, the patient‐centred care model explained approximately 58% of the variance in overall satisfaction, above and beyond the control variables. Because of the statistical power inherent in such a large sample, we chose to focus on the Beta weights for each dimension score, as Beta weights illustrate the relative contribution of each of the models' variables. In model two, the contribution of the control variables was reduced and, in the case of age, became non‐significant. Examination of the Beta weights revealed that among the patient‐centred care dimensions, while all were significantly related to overall satisfaction, emotional support appears to have the greatest influence (β = 0.390). This was followed by coordination of care (β = 0.190) and physical comfort (β = 0.118).
Table 2.
Standardized regression results for overall satisfaction
| Model 1 | Model 2 | |
|---|---|---|
| Control variables | ||
| Self‐rated health | 0.258 | 0.075 |
| Age | −0.122 | 0.001 |
| Length of stay | 0.023 | −0.008 |
| Patient‐centred care factors | ||
| Respect for patient preferences | 0.093 | |
| Coordination of care | 0.190 | |
| Information, communication, education | 0.085 | |
| Physical comfort | 0.118 | |
| Emotional support | 0.390 | |
| Involvement of family and friends | 0.090 | |
| Continuity and transition | 0.071 | |
| Adjusted R 2 | 0.055 | 0.638 |
| ∆R 2 | 0.583 | |
| F‐Statistic | 1129.73 | 7441.28 |
Discussion
Our analysis found several interesting results. Most importantly, analysis found that the theoretical model of patient‐centred care fits the data moderately well as a model predictive of patients' overall quality ratings. Secondly, emotional support had the strongest relationship with overall quality ratings. This was followed by coordination of care and physical comfort. Implications for these relationships will be discussed, for both research and practice.
Emotional support had the strongest relation to patients' overall ratings of care. This is an important finding, because, although some previous research has suggested that emotional support may play a role in patient outcomes,8, 14 little research has directly examined this dimension. For many patients, spending time in the hospital is likely to be a distressing experience; thus, if care providers do what they can to relieve patient distress, this could influence patient perceptions of their overall care. Further, emotional support could play a role in patient variables that have been shown to be related to important outcomes. For example, Kahn et al.8 found that patients with breast cancer who felt patient‐centred support in various ways compared with those who did not feel supported were more likely to stick with their tamoxifen treatment protocol 4 years after starting the treatment. Studies with chronic disease patients in primary care have found that patient‐centred care, particularly support, is related to patient self‐management activities that influence clinical outcomes.9 Emotional support could be a mediating variable in the patient care and outcomes relationship in a variety of healthcare settings. Additionally, emotional support may lower distress levels in patients, which could facilitate more rapid healing.
Coordination of care had the second strongest relationship with overall care ratings. Recall that this dimension included items that asked about organization of the admission process, doctors and nurses telling the patient the same thing and having tests and procedures conducted on time. Patient perceptions of coordination have been shown to be related to perceptions of patient safety.33, 34 When it appears to patients that no individual care provider has the full story of the patient's condition and treatment plan, they may become concerned about errors. One recent study found that patient safety concerns mediated the relationship between acute care patient experiences and overall ratings of care.34 Thus, our findings suggest that it may be wise to examine care processes for coordination from the patient perspective. It could be that a process that is efficient from the organization's perspective appears chaotic or disorganized from the patient perspective.
Physical comfort was the third strongest predictor of overall satisfaction. This is not surprising given that hospitalized patients are normally experiencing some kind of physical symptoms of discomfort. Measures in this dimension capture perceptions about the extent to which patients believe care providers did everything they could to help control pain, not specifically how much pain the patient experienced. This suggests that even if patients do have more pain, if it appears to them the staff is doing everything they can to help, patients will have a better overall experience. In addition, this dimension captures perceptions of getting help going to the bathroom. Getting help to use the bathroom may be important for not only patients' physical comfort, but also their dignity. Many patients feel vulnerable in the hospital as it is and may feel less dignified if they cannot get themselves to the bathroom.
Future research
Future research should examine relationships among the specific dimensions of patient‐centred care and various outcome measures, particularly clinical and long‐term outcomes. Our study explored only the overall quality ratings of patients. It could be that different dimensions of care are predictive of different outcomes or that different dimensions are more salient depending on healthcare service type. For example, chronically ill patients may need more assistance with navigating the broader healthcare system,35 and varying patient disease prognoses may reveal greater patient‐centred care needs.16, 36 Family involvement may be more important for patients whose families live nearby. Our objective here was to test the model in a randomly drawn sample of patients to obtain broader understanding of the general model. However, given that we found some support for the model, a next step could be to compare the model fit among various specific patient populations.
Our study found support for a patient‐centred care model in an inpatient setting, but future research should explore different domains that are relevant for other care contexts, such as nursing homes or ambulatory settings. In this way, gaps can be identified and more comprehensive models can be developed. For example, patient safety is absent from the present model of patient‐centred care, and access to care, although considered an important dimension of patient‐centred care for ambulatory settings, is also absent from the present model for acute care. Future research could develop a comprehensive model that may include additional dimensions, mediators or covariates.
Implications for practice
Our findings suggest support for much of the theoretical foundations underlying current conceptualizations of patient‐centred care, and this should strengthen the evidence in support of investing resources to improve care processes that patients find lacking.7 Evidence‐based medicine has become standard for developing medical and clinical processes whenever evidence is available. The accumulating evidence in support of patient‐centred processes of care can be utilized for evidence‐based management. For example, providing training and incentives for care providers to attend to the emotional needs of patients could be very important in the provision of patient‐centred care. Patients can be psychologically vulnerable during their care, even when everything goes according to plan.37 If care providers are insensitive, patients may feel abandoned or violated.38 There could be a few simple behaviours that care providers could be encouraged to display that might help to alleviate patient fears and anxieties. Reassuring emotional support from care providers could have an important impact on overall experiences or other outcomes.7 An expectation that care providers will pay attention to the emotional and informational needs of patients could play a role in alleviating patient fears of medical errors as well.
Teasing apart relationships among the dimensions and between dimensions and outcomes could provide valuable advice for managers who must decide how to allocate scare resources. It also is important to note that so far, many of the studies linking patient‐centred care to outcomes have done so using a summary score that combines all of the dimensions of care into one ‘patient‐centredness’ score. It is possible that if research finds evidence for differential predictive relationships among specific dimensions and outcomes, lower cost improvements could be made that would then influence specific outcomes of interest.
Study limitations
As with all studies, the present study has limitations. Primarily, it is important to remember that our data were cross‐sectional, and therefore, causal inferences cannot be drawn based on this analysis. Future studies employing longitudinal designs would help address this limitation. Next, the measures posed some limitations in response variance, and this could have attenuated some of the relationships in our model. Further, the measures in this study were developed for quality improvement purposes and designed to be easily interpreted and actionable for healthcare managers. Several of the dimension scales did not attain typically acceptable levels of reliability. This could have attenuated statistical relationships as well. Future research should develop items that tap into the same content and latent constructs, but should include a response scale that would provide more robust response options for testing theoretical models. The CAHPS® Hospital Survey39 currently being used widely in the United States shows promise for tapping into some of these domains; however, the questionnaire does not include all dimensions in the model. Finally, because our measures were obtained using a survey methodology, it is possible that some relationships could be inflated due to common method variance. One advantage to our measures, however, is that asking patients to think about the frequency with which specific processes occurred may make common method variance less of a concern.
Conclusion
This study attempted to add to the understanding of patient‐centred care by testing a theoretical model using a large, randomly selected sample. Enhanced understanding of the relationships among the dimensions of care and overall quality ratings can help further our understanding of how patient‐centred care influences important outcomes. A better understanding of patient‐centred care from the patient perspective will help advance research and practice. By developing solid theory, measures can be improved, and specific outcomes of care can be better predicted. Practice may thereby be improved because the research will provide evidence organizational leaders can use to justify changes for improvement.
Appendix 1.
List of Specific Indicators Included in the Regression Analysis
Respect for Patient Preferences, Values and Expressed needs
Doctors talked in front of patient as if patient wasn't there
Nurses talked in front of patient as if patient wasn't there
Patient was treated with respect and dignity
Coordination of Care
Organization of admission process
Had to wait for a long time to go to room
Sometimes a doctor or nurse said something, and another said something different
Scheduled tests and procedures performed on time
Information, Education, Communication
If patient had to wait, someone explained the reason for the delay
Patient got answers patient could understand from doctors
Patient got answers patient could understand from nurses
Doctor or a nurse explain the results in a way patient could understand
Physical Comfort
Got help getting to the bathroom in time
Length of time to get help after pressing call button
Length of time waited to get medicine
Staff did everything it could to help control pain
Emotional Support
A nurse discussed anxieties and fears
A doctor discussed anxieties and fears
Patient had confidence and trust in the nurses and doctors
Easy to find someone on the hospital staff to talk to about concerns
Involvement of Family and Friends
Family had enough opportunity to talk to doctor
Information about condition or treatment given to family
Doctors and nurses gave family all the information they needed
Continuity and Transition
Staff explained purpose of medicines to take at home
Staff explained possible side‐effects
Staff explained danger signals to watch for
Staff explained when you could resume normal activities
Knew who to call if had questions after leaving
Overall Quality of Care Ratings
Availability of nurses
Availability of doctors
Care received from nurses
Care received from the doctors
Care received at the hospital
References
- 1. Institute of Medicine . Crossing the Quality Chasm: A New Health System for the 21st Century. Washington, DC: National Academy Press, 2001. [PubMed] [Google Scholar]
- 2. Davis K, Schoenbaum SC, Audet AM. A 2020 vision of patient‐centered primary care. Journal of General Internal Medicine, 2005; 20: 953–957. [DOI] [PMC free article] [PubMed] [Google Scholar]
- 3. Bechel DL, Myers WA, Smith DG. Does patient‐centered care pay off? The Joint Commission Journal on Quality Improvement, 2000; 26: 400–409. [DOI] [PubMed] [Google Scholar]
- 4. Laine C, Davidoff F. Patient‐centered medicine: a professional evolution. Journal of the American Medical Association, 1996; 275: 152–156. [PubMed] [Google Scholar]
- 5. Epstein RM, Street RL. The values and value of patient‐centered care. The Annals of Family Medicine, 2011; 9: 100–103. [DOI] [PMC free article] [PubMed] [Google Scholar]
- 6. Bolster D, Manias E. Person‐centred interactions between nurses and patients during medication activities in an acute hospital setting: qualitative observation and interview study. International Journal of Nursing Studies, 2010; 47: 154–165. [DOI] [PubMed] [Google Scholar]
- 7. Epstein RM, Fiscella K, Lesser CS, Stange KC. Why the nation needs a policy push on patient‐centered health care. Health Affairs, 2010; 29: 1–7. [DOI] [PubMed] [Google Scholar]
- 8. Kahn KL, Schneider EC, Malin JL, Adams JL, Epstein AM. Patient centered experiences in breast cancer: predicting long‐term adherence to Tamoxifen use. Medical Care, 2007; 45: 431–439. [DOI] [PubMed] [Google Scholar]
- 9. Lemmens KMM, Nieboer AP, Huijsman R. Designing patient‐related interventions in COPD care: empirical test of a theoretical model. Patient Education & Counseling, 2008; 72: 223–231. [DOI] [PubMed] [Google Scholar]
- 10. Little P, Everitt H, Williamson I et al Preferences of patients for patient‐centred approach to consultation in primary care: observational study. British Medical Journal, 2001; 322: 468–472. [DOI] [PMC free article] [PubMed] [Google Scholar]
- 11. Gerteis M, Edgman‐Levitan S, Daley J, Delbanco TL. Through the Patients' Eyes: Understanding and Promoting Patient‐Centered Care. San Francisco, CA: Jossey‐Bass, 1993. [Google Scholar]
- 12. Cleary PD, Edgeman‐Levitan S, Walker JD, Gerteis M, Delbanco TL. Using patient reports to improve medical care: a preliminary report from 10 hospitals. Quality Management in Health Care, 1993; 2: 31–38. [PubMed] [Google Scholar]
- 13. Fremont AM, Cleary PD, Hargraves JL, Rowe RM, Jacobson NB, Ayanian JZ. Patient‐centered processes of care and long‐term outcomes of myocardial infarction. Journal of General Internal Medicine, 2001; 16: 800–808. [DOI] [PMC free article] [PubMed] [Google Scholar]
- 14. Flach SD, McCoy KD, Vaughn TE, Ward MM, BootsMiller BJ, Doebbeling BN. Does patient‐centered care improve provision of preventive services? Journal of General Internal Medicine, 2004; 19: 1019–1026. [DOI] [PMC free article] [PubMed] [Google Scholar]
- 15. Cleary PD. Satisfaction may not suffice! International Journal of Technology Assessment in Health Care, 1998; 14: 35–37. [DOI] [PubMed] [Google Scholar]
- 16. Dowsett SM, Saul JL, Butow PN et al Communication styles in the cancer consultation: preferences for a patient‐centred approach. Psychooncology, 2000; 9: 147–156. [DOI] [PubMed] [Google Scholar]
- 17. Gerteis M, Edgman‐Levitan S, Walker JD, Stokes DM, Cleary PD, Delbanco TL. What patients really want. Health Management Quarterly, 1993; 15: 2–6. [PubMed] [Google Scholar]
- 18. Bruster S, Jarman B, Bosanquet N, Weston D, Erens B, Delbanco TL. National survey of hospital patients. British Medical Journal, 1994; 309: 1542–1549. [DOI] [PMC free article] [PubMed] [Google Scholar]
- 19. Stewart M. Effective physician‐patient communication and health outcomes: a review. Canadian Medical Association Journal, 1995; 152: 1423–1433. [PMC free article] [PubMed] [Google Scholar]
- 20. Starfield B. Quality of care research. Journal of the American Medical Association, 1998; 280: 1006–1008. [DOI] [PubMed] [Google Scholar]
- 21. Cleary PD, Edgeman‐Levitan S, Roberts M et al Patients evaluate their hospital care: a national survey. Health Affairs, 1991; 10: 254–267. [DOI] [PubMed] [Google Scholar]
- 22. Cleary PD, Edgeman‐Levitan S, McMullen W, Delbanco TL. The relationship between reported problems and patient summary evaluations of hospital care. Quality Review Bulletin, 1992; 18: 53–59. [DOI] [PubMed] [Google Scholar]
- 23. Davies E, Shaller D, Edgman‐Levitan S et al Evaluating the use of a modified CAHPS® survey to support improvements in patient‐centred care: lessons from a quality improvement collaborative. Health Expectations, 2008; 11: 160–176. [DOI] [PMC free article] [PubMed] [Google Scholar]
- 24. Reilly P, Pike A, Phipps M et al Learning from patients: a discharge planning improvement project. The Joint Commission Journal on Quality Improvement, 1996; 22: 311–322. [DOI] [PubMed] [Google Scholar]
- 25. California Healthcare Foundation . Patients evaluate performance – California, 2011. Available at: http://www.chcf.org/media/press-releases/2001/patients-evaluate-california-hospitals-in-groundbreaking-report, accessed 29 September 2011.
- 26. Hospital Report Research Collaborative . Hospital Report, 2011. Available at: http://www.hospitalreport.ca/, accessed 29 September 2011.
- 27. NHS . National Survey, Acute Patients, 2004. Available at: http://www.dh.gov.uk/en/Publicationsandstatistics/PublishedSurvey/NationalsurveyofNHSpatients/Nationalsurveyinpatients/DH_4016444, accessed September 29, 2011.
- 28. Meterko M, Wright S, Lin H, Lowy E, Cleary PD. Mortality among patients with acute myocardial infarction: the influences of patient‐centered care and evidence‐based medicine. Health Services Research, 2010; 45 (5 Pt 1): 1188–1204. [DOI] [PMC free article] [PubMed] [Google Scholar]
- 29. Stewart M, Brown JB, Donner A et al The impact of patient‐centered care on outcomes. Journal of Family Practice, 2000; 49: 796–804. [PubMed] [Google Scholar]
- 30. Cleary P. The increasing importance of patient surveys. British Medical Journal, 1999; 319: 720–721. [DOI] [PMC free article] [PubMed] [Google Scholar]
- 31. Castle NG, Brown J, Hepner K, Hays RD. Review of the literature on survey instruments used to collect data on hospital patients' perceptions of care. Health Services Research, 2005; 40(6 part II): 1996–2017. [DOI] [PMC free article] [PubMed] [Google Scholar]
- 32. Cleary PD, Edgeman‐Levitan S. Health care quality: incorporating consumer perspectives. Journal of the American Medical Association, 1997; 278: 1608–1612. [PubMed] [Google Scholar]
- 33. Rathert C, Brandt J, Williams ES. Putting the “Patient” in patient safety: a qualitative study of consumer experiences. Health Expectations, 2011a; published on‐line June 1, doi: 10.1111/j.1369‐7625.2011.00685.x [DOI] [PMC free article] [PubMed] [Google Scholar]
- 34. Rathert C, May DR, Williams ES. Beyond service quality: the mediating role of patient safety perceptions in the patient experience – satisfaction relationship. Health Care Management Review, 2011b; 36: 359–368. [DOI] [PubMed] [Google Scholar]
- 35. Bokhour BG, Pugh MJ, Rao JK, Avetisyan R, Berlowitz DR, Kazis LE. Improving methods for measuring quality of care: a patient‐centered approach in chronic disease. Medical Care Research and Review, 2009; 66: 147–166. [DOI] [PubMed] [Google Scholar]
- 36. Montgomery K, Little M. Enriching patient‐centered care in serious illness: a focus on patients' experiences of agency. The Milbank Quarterly, 2011; 89: 381–398. [DOI] [PMC free article] [PubMed] [Google Scholar]
- 37. Vincent C. Understanding and responding to adverse events. New England Journal of Medicine, 2003; 348: 1051–1056. [DOI] [PubMed] [Google Scholar]
- 38. Delbanco T, Bell SK. Guilty, afraid, and alone – struggling with medical error. New England Journal of Medicine, 2007; 357: 1682–1683. [DOI] [PubMed] [Google Scholar]
- 39. HCAHPS Fact Sheet (CAHPS® Hospital Survey). CAHPS® Hospital Survey 2012. Available at: http://www.hcahpsonline.org/facts.aspx, accessed 24 May 2012.