Abstract
Background
The literature shows that the quality of communication is usually determined from a professional perspective. Patients or lay people are seldom involved in the development of quality indicators or communication.
Objective
To give voice to the lay people perspective on what constitutes ‘good communication’ by evoking their reactions to variations in physician communication.
Design
Lay people from four different countries watched the same videotaped standardized medical encounters and discussed their preferences in gender‐specific focus groups who were balanced in age groups.
Setting and participants
Two hundred and fifty‐nine lay people (64 NL, 72 IT, 75 UK and 48 BE) distributed over 35 focus groups of 6–8 persons each.
Main variables studied
Comments on doctors' behaviours were classified by the GULiVer framework in terms of contents and preferences.
Results
Participants prevalently discussed ‘task‐oriented expressions’ (39%: competency, self‐confident, providing solutions), ‘affective oriented/emotional expressions' (25%: empathy, listening, reassuring) and ‘process‐oriented expressions' (23%: flexibility, summarizing, verifying). ‘Showing an affective attitude’ was most appreciated (positive percentage within category: 93%, particularly facilitations and inviting attitude), followed by ‘providing solution’ (85%). Among disfavoured behaviour, repetitions (88%), ‘writing and reading’ (54%) and asking permission (42%) were found.
Conclusions
Although an affective attitude is appreciated by nearly everybody, people may vary widely in their communication needs and preferences: what is ‘good communication’ for one person may be disliked or even a source of irritation for another. A physician should be flexible and capable of adapting the consultation to the different needs of different patients. This challenges the idea of general communication guidelines.
Keywords: focus groups, patient perspective, physician communication, qualitative and quantitative analyses, videotaped consultations
Introduction
Good communication is a core competence for physicians in all provision of health care.1, 2, 3 But who is to determine what constitutes good communication? Much of the literature has focused on defining the communication skills that are necessary to develop a satisfying and effective dialogue with patients from a professional perspective,4, 5, 6 thereby largely neglecting the views of the potential beneficiaries of health care: the patients. It is true that clinicians, researchers and medical educators have made efforts to bestow the patients a central position in their own health care,7, 8 but, to date, patients still have seldom been given the opportunity to evaluate physicians' communication skills.9, 10, 11 The only patient‐based sources for quality assessment are global patient satisfaction surveys, which are hardly used to improve clinical practice and often are methodologically limited.12, 13 The problem with this one‐sided approach is that professional and patient views on what constitutes ‘good communication’ do not always match and may reveal different priorities and preferences.14, 15, 16, 17, 18, 19 Moreover, physicians have been found to be poor judges of patients' actual preferences.20, 21 There is now a growing consensus that involving patients in defining the essential elements of good communication might help to improve everyday clinical practice9 and that the patient's perspective should be taken into greater consideration in the assessment of the quality of care.12, 22, 23, 24
Putting the spotlights on patients or potential patients as assessors of the quality of care immediately raises another issue that is largely overlooked in the literature: patient variability. In our modern, guideline‐driven health‐care systems, there is a tendency to define the quality of care in standardized terms, setting golden standards for optimal care, from which doctors may deviate if necessary according to a ‘comply or explain’ principle. This gives room for tailored care, but is no stimulus for it. Yet, knowing that in health care, diversity among patients is the norm and not the exception,19, 25 it seems reasonable to ask whether a one‐size‐fits‐all approach to patient care is the best one,17 as ‘The’ patient simply does not exist. People may vary widely in their communication needs and preferences, and what is ‘good communication’ for one person may be disliked or even a source of irritation for another.
The aim of this paper is to describe the quality assessments on clinical communication of people from 4 different countries (Belgium, the Netherlands, UK and Italy). The study participants watched the same set of videotaped medical consultations and discussed in focus group the arguments for their positive and negative quality. To synthesize the large amount of gathered information, a quantitative approach to qualitative data was used26, 27 Indeed, the quantitative methodology offers tools that grounding the analysis on the coded transcripts may well summarize the focus group conversations. This technique may properly assist the qualitative research to investigate the following two research questions:
What are the prevalent topics discussed by the participants?
What are the most frequent positive and negative statements on the quality of physicians' communicative behaviour?
Methods
Study sample
This study is part of an international multicenter study which draws its name (GULiVer) from the four centres involved: Ghent University (Belgium), Utrecht University/NIVEL (the Netherlands), Liverpool University (United Kingdom) and the University of Verona (Italy). In all four countries, the same procedures were followed according to a detailed protocol.28 Briefly, a total of 259 lay people participated in the study (64 in the Netherlands, 72 in Italy, 75 in UK and 48 in Belgium), evenly distributed over 35 focus groups, comprising 6–8 persons per group, with at least two persons in the classes 18–30, 31–49 and ≥50 years of age to guarantee a heterogeneous age distribution. Each centre organized nine focus group meetings (except Belgium with 8). As gender is likely to influence the type of concerns disclosed by participants, focus groups were gender specific.
Focus group materials
The groups watched the same set of videotaped OSCE simulated doctor–patient consultations (objective structured clinical examinations29) provided by the Liverpool Medical. The videotapes had been recorded in a station designed to test the quality of students' interviewing skills during 4th year summative finals and had been selected to provide a maximum variation in the examiner rated quality of communication. The videos regarded gynaecological problems associated with high levels of emotional distress, presented by simulated patients. The doctor's task was to collect patient symptoms and to recognize and manage potential distress.
The videos were either dubbed (Italy) or subtitled (the Netherlands and Belgium) to conform to the accepted practice of displaying English language television in different countries. The transcripts of the consultations were also provided in the language of the participants.
After watching each video, participants individually rated the quality of doctor's communication on a 10‐point scale. Subsequently, the group discussion started, which lasted 1 h. The participants were asked to discuss the communication of the observed student doctors and provide reasons for their negative or positive evaluations. The facilitators gave the following instruction to the participants:
We are interested in understanding what is your opinion about the quality of doctor's communication in the shown videotaped medical consultations.
Please feel free to express any idea or thought!
Don't be afraid to express your opinion: today you are the ‘experts’!
We welcome positive as well as negative comments!
Feel free to respond to any observation of another participant, but don't interrupt the other person.
The video registrations of the focus group discussions were fully transcribed and recorded in an excel file, both in the country's and in the English language, so that the sets of all focus groups were accessible by researchers from all countries. An inductive content analysis was then performed; a detailed description was given by Moretti et al.30 The focus group findings of the present study are based on this content analysis.
Units of analysis and measures
Researchers of each centre coded each participant's verbal turns of the focus group transcriptions. Turns were split in more than one statement (from now called units of analysis) when regarding different aspects of doctors' performances. The focus groups contributions were classified according to five main dimensions; a detailed description of methodological procedures and intercoder reliability were shown in Moretti et al.30 The analyses performed in the present paper were based on results from the following three dimensions:
Content of statement: different types of information were identified. They were classified in six communication areas, divided into 12 main categories and 41 subcategories, here synthesized in Fig. 1.
Positive or negative statement regarding the general communication style or attitude: a distinction was made between statements expressing a positive (liking/agreement) or negative (disliking/disagreement) value on doctors' communicative performance. A neutral value is assigned when the value is neither positive nor negative.
Explanation: presence of statements for which positive or negative preferences are also explained and motivated.
Figure 1.
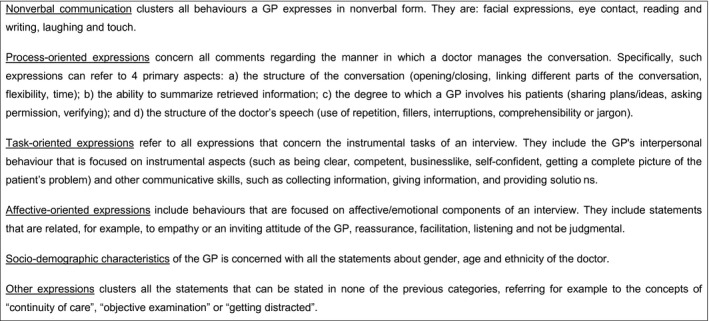
Thematic areas of GULiVer framework related to doctor verbal behaviour performance.
By counting the frequencies of the coded units of analysis, it is possible to obtain a list of the most commented topics. Moreover, by separating the comments in positive, neutral and negative statements, an indication is obtained which kind of communication is appreciated or disliked.
Statistical analyses
A preliminary exploration, using a multinomial logit model, was applied to check the homogeneous frequency distribution of the six communication areas by different focus groups.
To evidence differences in the distribution of participants' preferences within the 12 GULiVer categories of doctor behaviours, a chi‐squared test was performed and followed by a residual analyses.31
The analyses were performed using Stata 11.2.32
Results
Each participant made at least one statement (mean = 27; SD = 18.4, range: 1–110), the level of participation ranging from passive (<10 statements by 10% of participants) to very ‘active’ (>50 statements by 9% of participants). In total participants, expressed 7067 statements of which 1598 were unrelated to the doctors' communicative behaviours and therefore not considered for analysis. The mean number of pertinent statements was 156 per focus group (range: 77–350).
Overall picture
All coefficients of the multinomial logit model proved to be not significant (P > 0.10) and confirmed that the statements were equally distributed among the six areas and independent of gender and country, that is, all 35 focus groups dedicated similar space to each area. This ‘shared list’ of communication topics allowed to perform the analyses on the whole sample of 35 focus groups.
Among the six areas, ‘task‐oriented expressions’ were most extensively discussed (39%, range per focus group: 19–53%), followed by ‘affective oriented/emotional expressions’ (25%, range: 11–39%), ‘process‐oriented expressions’ (23%, range: 12–36%) and ‘non‐verbal communication’ (8%: range: 0–21%). Doctor characteristics such as ethnicity, gender, outfit, were rarely discussed (2%: range: 0–7%) as well as issues regarding examinations and continuity of care (‘other’ 3%: range: 0–12%).
What are the most frequently discussed arguments?
Table 1 shows the frequencies of discussed arguments within the six communication areas, and some examples of the most frequent ones are displayed in Fig. 2. About half of all statements centre around the attitude of the doctors in terms of both Affective/emotional behaviour and task‐oriented/professional behaviour (25 and 22%, respectively). Most comments within ‘process‐oriented expressions’ regard how the doctor structures the conversation (12%), while collecting and giving information, within ‘task‐oriented expressions’, collect 14% of the statements (9 and 5%, respectively). Finally statements on ‘non‐verbal behaviours’ are also quite frequent (8%).
Table 1.
Frequency distribution of focus‐group comments regarding different doctor behaviours by participants' judgments
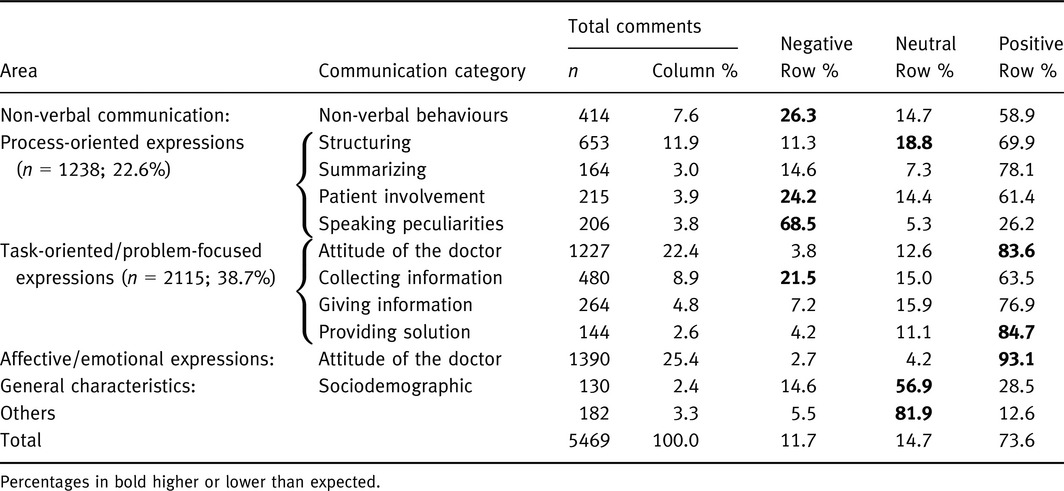
Figure 2.
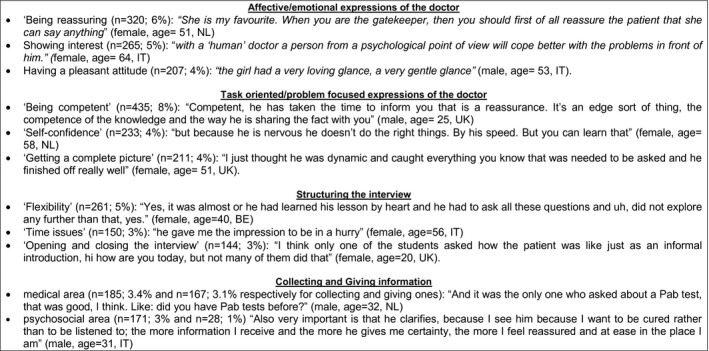
Examples of quotations of most frequent topics.
Positive and negative statements
The majority of participants' statements was positive (74%), with a range from 13% for ‘other statements’ (mainly ‘neutral’) to 93% for ‘showing an affective attitude’ (see Table 1). The residual analysis, exploring the significant differences tested by chi‐square test (see the three rightmost columns of Table 1, showing the percentage of judgements within each communication category; the observed frequencies in bold are apart from the expected ones), showed that the negative comments were focused primary on the structure of the doctor speech (69% of speaking peculiarities statements were negative), followed by non‐verbal behaviour (in which 26% of the observed statements were negative, compared to 12% of the expected ones), for instance lack of eye contact, doctor expressions aimed to involve the patient into conversation (24%) or to collect information (22%). The participants appreciated doctors' attitudes, both in terms of emotional‐oriented and task‐oriented expressions (93 and 84%, respectively), followed by ‘providing solution’ (85%). In particular, as shown in Table 2, the most appreciated behaviours (positive judgments >90%) regarding the affective/emotional attitudes were ‘facilitating’, ‘inviting attitude’, ‘giving reassurance’, ‘showing interest to patient’, ‘listening’, ‘pleasant attitude’ and ‘being empathic’. Concerning the ‘task‐oriented attitudes’, the preferences were so listed: clarity of interview, showing self‐confidence, providing a complete picture and competency. Figure 3 shows some examples of how the participants phrased their positive judgments regarding doctor attitudes.
Table 2.
Frequency of specific behaviours (subcategories) regarding affective/emotional and task‐oriented attitudes of the doctor by participants' judgments
| Communication category | Communication subcategory | Negative Row % | Neutral Row % | Positive Row % | Total count |
|---|---|---|---|---|---|
| Affective/emotional attitudes of the doctor | Facilitating | 0.9 | 0.0 | 99.1 | 109 |
| Inviting attitude | 0.7 | 2.0 | 97.3 | 149 | |
| Reassurance/trust | 2.5 | 2.5 | 95.0 | 320 | |
| Showing interest in patient | 1.9 | 3.4 | 94.7 | 265 | |
| Listening | 0.0 | 6.6 | 93.4 | 91 | |
| Pleasant attitude | 3.4 | 4.3 | 92.3 | 207 | |
| Empathic | 0.0 | 10.0 | 90.0 | 110 | |
| Neutral/no personal remark | 10.8 | 9.3 | 79.9 | 139 | |
| Task‐oriented/problem‐focused attitudes of the doctor | Clarity of the interview | 1.3 | 6.4 | 92.3 | 78 |
| Self confident | 1.7 | 8.2 | 90.1 | 233 | |
| Complete picture | 2.8 | 7.6 | 89.6 | 211 | |
| Competency | 2.8 | 8.0 | 89.2 | 435 | |
| Businesslike/straight to the point | 9.0 | 10.9 | 80.1 | 156 | |
| Other/general | 8.8 | 54.4 | 36.8 | 114 |
Figure 3.
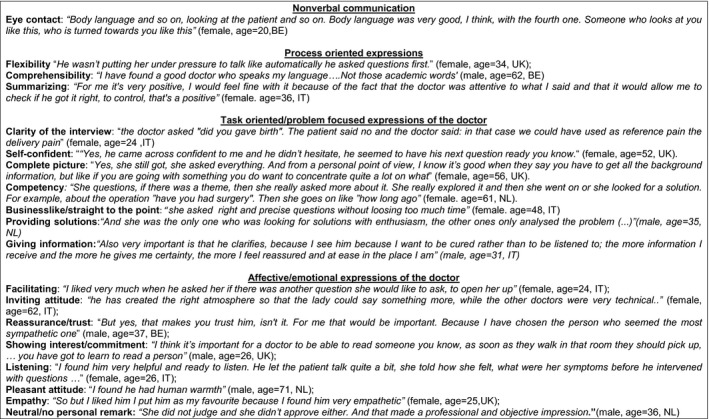
Examples of quotations of positive statements (frequency >75%) per communication area.
Table 3 examines the comments focused on non‐verbal communication and process‐oriented expressions. It can be seen that within subcategories ‘eye contact’, ‘flexibility’ and ‘comprehensibility’, nearly all comments are positive (94, 83 and 79%, respectively).
Table 3.
Frequency of specific behaviours (subcategories) regarding process‐oriented expressions and non‐verbal communication
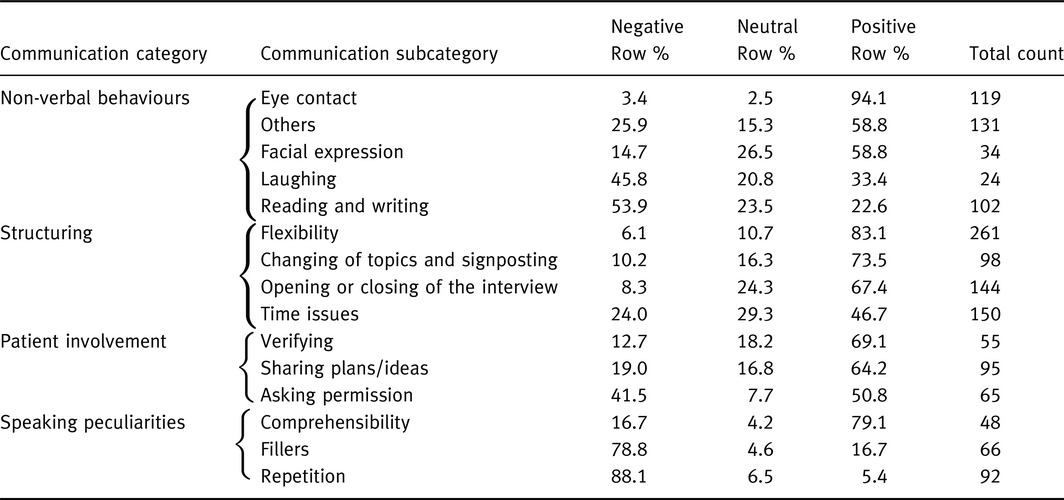
On the other hand, the subcategories that were prevalently coded as negative highlighted that participants did not like interruptions of the normal fluent speech, such as ‘repetitions’ (88%: ‘Some of them were repeating questions, that they had already, the patient had already told them. I thought that was quite negative; it means that you haven't listened in the first place’ (male, age = 59, UK) and ‘fillers’ (79%: ‘I did not like all these “ok, ok,” which made me nervous’. (female, age = 68, IT), ‘To say, “right, right” showed some insecurity’ (male, age = 35, IT). For some participants, this behaviour influenced the level of trust negatively [‘It doesn't inspire confidence in the patient, does it?’ (female, age = 44, UK)]. Among non‐verbal behaviours also ‘reading and writing’ received many negative comments (54%), because doctors who took notes did not look at their patients and appeared uninterested in trying to understand their suffering: ‘A doctor who is writing all the time, that would irritate me enormously’ (male, age = 42, BE).
It is interesting to note that some behaviours received conflicting opinions, in particular laughing (46 vs. 33%, respectively, negative and positive values), asking permission (42 vs. 51%), time issues (24 vs. 47%) and sharing plans/ideas (19 vs. 64%). Figure 4 shows some of these different and opposing views.
Figure 4.
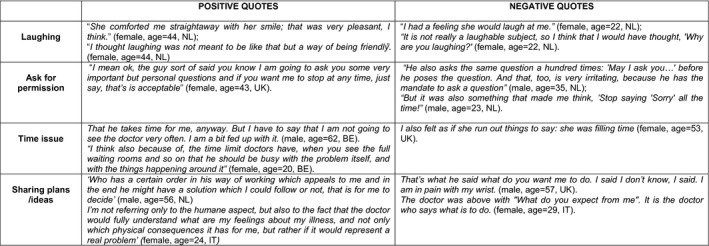
Examples of quotations of controversial topics.
Discussion
This study has provided some interesting results, both with regard to the content and to the applied methodology. Thanks to the detailed study protocol and the intensive collaboration of researchers in each of the four participating countries, the chosen methodology proved to be feasible to conduct an international multicenter study, with the unique result that qualitative as well as quantitative data could be reported about what (lay) people in different countries think about the quality of communication, based on their assessment of the same set of videotaped consultations. The aim of this study was to give voice to the patient perspective on what constitutes ‘good communication’ by letting lay people watch videotaped medical consultations and let them discuss their likes and dislikes, as well as the reasons for these positive and negative judgments.
Focus groups were used, because this is the preferred technique for eliciting subtle or sensitive opinions from people on topics which are not discussed on a daily basis.33 By choosing this approach, we comply with recommendations to involve patients in quality assessments on clinical communication.34 Our participants confirmed to be highly interested in doctor–patient communication: they were easily recruited, became immediately involved in the project, and the discussions in the focus groups were very lively. The similarities in the content of the focus group discussions over countries and gender were striking. The majority of the comments made in the focus groups were about the doctor's task‐oriented communication, in particular about biomedical exchanges. This is in line with what could be expected as the literature shows that between 57 and 75% of the doctor's expressions in general practice can be characterized as ‘task‐oriented’ and only a small part of it devoted to psychosocial exchanges.35, 36, 37, 38 More interesting is the proportion of negative, positive and mixed evaluations of specific doctor behaviours, because these highlight the critical communication aspects to which clinicians should pay attention.
A relatively high number of positive comments referred to ‘affective/emotional expressions’, and this confirms what is already consolidated in the literature: patients value and appreciate doctors' expressing empathy, support, interest and active listening.39, 40, 41 In the eyes of our sample, an emphatic doctor seems to be characterized by an open, inviting and compassionate attitude, and the participants are quite consistent in the positive value they give to this type of communication. Our study adds three important observations to this general picture.
First, affective communication should always remain at a professional level. Indeed, personal remarks or self disclosure are not always valued positively, nor is the use of humour. For example, some participants reported doctor's jokes observed in the video consultations, as indicators of intimacy and partnership, while others perceived the same behaviour as highly insensitive and offensive. This confirms that therapeutic effects of humour in medicine are guaranteed only by an appropriate and patient‐centred use of such interventions that takes into account emotional,42 cultural43 and contextual variables.44
Second, some ‘process‐oriented expressions’ which were intended to create a pleasant and open atmosphere were sometimes experienced as problematic and controversial. For example, asking permission or apologizing for doing something sometimes seems to convey doctor's insecurity or indifference to what have been said by the patient. Also, back channel responses, such as ‘ok, mh mh.’, if used too often or with no connection with previous patients' statements, seem to be seen as annoying or as a lack of attention. The importance of physicians' genuine listening attitude during the consultation is confirmed by participants' comments pertaining to ‘non‐verbal expressions’. Writing and reading during the consultation and Keeping eye contact received, respectively, highly negative and highly positive comments, underlying how the congruence between verbal and non‐verbal behaviour affects how a message is received. To nod and saying ‘ok’ while writing or reading a note is disliked and considered a sign of distraction or indifference. Such passive listening expressions should be congruent with non‐verbal behaviours and also counterbalanced by active listening interventions which better structure the interview, show attention and increase the identification and accuracy of clinically relevant information.45
A third interesting and somewhat unexpected result regards patients' involvement in the decision‐making process. Few participants seem to consider the task of making decisions as doctor's sole responsibility; most people want to be involved in medical decision making. However, a considerable percentage of negative comments in our study referred to doctor interventions aimed to share plans and ideas with patients. Some participants saw the doctor as responsible for making decisions (‘that is why I came to see the doctor’), others felt at a loss and abandoned when the doctor left the final decision to the patient. Similar results have been reported elsewhere.46, 47 Our study confirms again that tailoring to patients' needs is essential for performing a satisfactory consultation6 and ‘informed flexibility’, as expressed by the degree to which an individual physician can adapt the consultation to the changing needs of one patient or to different needs of different patients7 is a key aspect of a truly patient‐centred consultation.
Strength and weaknesses
The study design has some clear strengths: balanced study sample, standardized stimuli for the quality assessment and discussion, mixed techniques for synthesize the focus groups' data. In more detail, the sampling strategy was to create comparable groups by gender and country, while stratified by age within each focus group to represent different patient profiles. The discussion guide was previously agreed by facilitators and was based on standardized stimuli (a set of four videotaped medical interviews, showing the same type of medical problem but for different doctors).
Another strength is the application of a quantitative approach to qualitative data, the ‘quantitizing’ of qualitative data.48 This approach combines the best of two worlds: the content analysis allowed a systematic classification of the expressed concepts by defragmenting the text of transcripts, the quantitative analysis to identify the most frequently discussed issues, revealing their level of importance attributed by the participants.
Some limitations of the study have to be noted. The videos used to collect panel perspectives might be considered as being not representative of real general practice consultations: clinicians were 4th‐year students, performing a consultation with a simulated patient within an OSCE setting. Moreover, the disorders presented by the simulated patients were two very specific gynaecological problems. Actually a juxtaposition of methodological and practical evaluations leads to the selection of this set of interviews. Although we were aware of a potential reduced generalizability of the results, we considered the advantages of the selected videotaped medical consultations to outweigh the disadvantages, because our selection guaranteed a higher control of the variability related to the phenomenon observed. Simulated consultations based on the same scenario allowed the participants to compare different approaches applied by clinicians in the same standardized setting. The available external evaluations of OSCE examiners and simulated patients made it possible to select and show to the panels a wide range of communication performances, ranging from excellent to very poor. The specific gynaecological problems of the consultations let us opt for separate focus groups for males and females to put participants at ease and let them free to express their opinions and concerns. Finally, not to be personally involved as a patient does not seem to be a problem as evidences from the literature indicate that feedback given in simulated interactions maintain an acceptable validity and reliability.49
Conclusion
Affective communication is highly valued by nearly everybody, as long as it stays at a professional level and is perceived as genuine. Non‐verbal communication plays a significant role in people's quality assessment, in particular the consistency between verbal and non‐verbal communication. Doctors' shown competency and self‐confidence is also highly appreciated and the opposite demeanour criticized. Negative assessments are also given to superfluous repetitions and routinous backchanneling (‘ok’, ‘hmm’, ‘yes’) if not accompanied by adequate non‐verbal communication. Hardly any other types of communication evokes either positive either negative quality assessments, and these mixed reactions make clear that there is no such thing as ‘one size fits all’. Tailored approaches are always needed in the medical consultation room. This challenges the idea of general communication guidelines.
Source of funding
This study was made possible through a grant of The Dutch Ministry of Health, Welfare and Sports (National Fund for Patient‐Oriented Research).
Conflict of interest
The authors have no potential conflict of interest related to the subject of the paper.
Acknowledgements
We would like to thank the Clinical Skills Team at the Medical School in University of Liverpool for supporting the study and assisting the recruitment and videoing of the summative examinations; the lay panels in Ghent, Utrecht, Liverpool and Verona for their committed participation in the study; the Dutch Ministry of Health, Welfare and Sports [National Fund for Patient‐Oriented Research] for their financial support of the study; Corinne Geurtz and Marjolein van Bogaert for their help in study preparation and data collection.
References
- 1. British Medical Association Board of Medical Education . Communication Skills Education for Doctors: An Update. London: BMA, 2004. Available at: http://bmaopac.hosted.exlibrisgroup.com/exlibris/aleph/a21_1/apache_media/AARUJBSGPV2N6P4LGSRMKYY39IFVPF.pdf. [Google Scholar]
- 2. General Medical Council . Tomorrow's Doctors: Recommendations on Undergraduate Medical Education. London: GMC, 2009. Available at: http://www.gmc-uk.org/TomorrowsDoctors_2009.pdf_39260971.pdf. [Google Scholar]
- 3. General Medical Council . Good Medical Practice. London: GMC, 2006. Available at: http://www.gmc-uk.org/static/documents/content/GMP_0910.pdf. [Google Scholar]
- 4. Cohen‐Cole S. The Medical Interview: The Three Function Approach. St Louis, MO: Mosby‐Year Book, 1991. [Google Scholar]
- 5. De Haes H, Bensing J. Endpoints in medical communication research, proposing a framework of functions and outcomes. Patient Education & Counseling, 2009; 74: 287–294. [DOI] [PubMed] [Google Scholar]
- 6. Brunett PH, Campbell TL, Cole‐Kelly K et al Participants in the Bayer–Fetzer Conference on Patient–Physician Communication in Medical Education. Essential elements of communication in medical encounters: the Kalamazoo Consensus Statement. Academic Medicine, 2001; 76: 390–393. [DOI] [PubMed] [Google Scholar]
- 7. Epstein RM, Franks P, Fiscella K et al Measuring patient‐centered communication in patient‐physician consultations: theoretical and practical issues. Social Science & Medicine, 2005; 61: 1516–1528. [DOI] [PubMed] [Google Scholar]
- 8. Cegala DJ, Post DM. The impact of patients' participation on physicians' patient‐centered communication. Patient Education & Counseling, 2009; 77: 202–220. [DOI] [PubMed] [Google Scholar]
- 9. Swenson SL, Buell S, Zettler P, White M, Ruston DC, Lo B. Patient‐centered communication: do patients really prefer it? Journal of General Internal Medicine, 2004; 19: 1069–1079. [DOI] [PMC free article] [PubMed] [Google Scholar]
- 10. Swenson SL, Zettler P, Lo B. She gave it her best shot right away: patient experiences of biomedical and patient‐centered communication. Patient Education & Counseling, 2006; 61: 200–211. [DOI] [PubMed] [Google Scholar]
- 11. Krupat E, Rosenkranz SL, Yeager CM, Barnard K, Putnam SM, Inui TS. The practice orientations of physicians and patients: the effect of doctor‐patient congruence on satisfaction. Patient Education & Counseling, 2000; 39: 49–59. [DOI] [PubMed] [Google Scholar]
- 12. Grol R. Improving the quality of medical care: building bridges among professional pride, payer profit, and patient satisfaction. Journal of American Medical Association, 2001; 286: 2578–2585. [DOI] [PubMed] [Google Scholar]
- 13. Jung HP, Baerveldt C, Olesen F, Grol R, Wensing M. Patient characteristics as predictors of primary health care preferences: a systematic literature analysis. Health Expectations, 2003; 6: 160–181. [DOI] [PMC free article] [PubMed] [Google Scholar]
- 14. Laine C, Davidoff F. Patient‐centered medicine. A professional evolution. Journal of American Medical Association, 1996; 275: 152–156. [PubMed] [Google Scholar]
- 15. Laine C, Davidoff F, Lewis CE et al Important elements of outpatient care: a comparison of patients' and physicians' opinions. Annals of Internal Medicine, 1996; 125: 640–645. [DOI] [PubMed] [Google Scholar]
- 16. Jung HP, Wensing M, Grol R. What makes a good general practitioner: do patients and doctors have different views? British Journal of General Practice, 1997; 47: 805–809. [PMC free article] [PubMed] [Google Scholar]
- 17. Krupat E, Bell RA, Kravitz RL, Thom D, Azari R. When physician and patients think alike: patient‐centered beliefs and their impact on satisfaction and trust. Journal of Family Practice, 2001; 50: 1057–1062. [PubMed] [Google Scholar]
- 18. Durieux P, Bissery A, Dubois S, Gasquet I, Coste J. Comparison of health care professionals' self‐assessments of standards of care and patients' opinions on the care they received in hospital: observational study. Quality & Safety in Health Care, 2004; 13: 198–202. [DOI] [PMC free article] [PubMed] [Google Scholar]
- 19. Kiesler DJ, Auerbach SM. Optimal matches of patient preferences for information, decision‐making and interpersonal behavior: evidence, models and interventions. Patient Education & Counseling, 2006; 61: 319–341. [DOI] [PubMed] [Google Scholar]
- 20. Hooper R, Rona RJ, French C, Jones M, Wessely S. Unmet expectations in primary care and the agreement between doctor and patient: a questionnaire study. Health Expectations, 2005; 8: 26–33. [DOI] [PMC free article] [PubMed] [Google Scholar]
- 21. Kenten C, Bowling A, Lambert N, Howe A, Rowe G. A study of patient expectations in a Norfolk general practice. Health Expectations, 2010; 13: 273–284. [DOI] [PMC free article] [PubMed] [Google Scholar]
- 22. Stewart M. Towards a global definition of patient centred care. British Medical Journal, 2001; 322: 444–445. [DOI] [PMC free article] [PubMed] [Google Scholar]
- 23. Sequist TD, Schneider EC, Anastario M et al Quality monitoring of physicians: linking patients' experiences of care to clinical quality and outcomes. Journal of General Internal Medicine, 2008; 23: 1784–1790. [DOI] [PMC free article] [PubMed] [Google Scholar]
- 24. Elberse JE, Caron‐Flinterman JF, Broerse JE. Patient‐expert partnerships in research: how to stimulate inclusion of patient perspectives. Health Expectations, 2011; 14: 225–239. [DOI] [PMC free article] [PubMed] [Google Scholar]
- 25. Bensing JM, Verhaak PF, Van Dulmen AM, Visser AP. Communication: the royal pathway to patient‐centered medicine. Patient Education & Counseling, 2000; 39: 1–3. [DOI] [PubMed] [Google Scholar]
- 26. Creswell JW, Tashakkori A. Differing perspective on mixed methods research. Journal of Mixed Methods Research, 2007; 1: 303–308. [Google Scholar]
- 27. Bernard HR, Ryan G. Analysing Qualitative Data. Systematic Approaches. Thousand Oaks, CA: SAGE Publications, 2010. [Google Scholar]
- 28. Moretti F, Fletcher I, Mazzi MA et al GULiVer ‐ travelling into the heart of good doctor‐patient communication from a patient perspective. Study protocol of an international multicentre study. European Journal of Public Health, 2012; 22: 464–469. [DOI] [PubMed] [Google Scholar]
- 29. Smee S. Skill based assessment. British Medical Journal, 2003; 326: 703–706. [DOI] [PMC free article] [PubMed] [Google Scholar]
- 30. Moretti F, Van Vliet L, Bensing J et al A standardized approach to qualitative content analysis of focus group discussions from different countries. Patient Education & Counseling, 2011; 82: 420–428. [DOI] [PubMed] [Google Scholar]
- 31. Agresti A. An Introduction to Categorical Data Analysis. New York, NY: John Wiley & Sons, 1996. [Google Scholar]
- 32. StataCorp . Stata Statistical Software: Release 11.2. College Station, TX: StataCorp LP, 2011. [Google Scholar]
- 33. Lehoux P, Poland B, Daudelin G. Focus group research and “the patient's view”. Social Science & Medicine, 2006; 63: 2091–2104. [DOI] [PubMed] [Google Scholar]
- 34. Salmon P, Young B. Core assumptions and research opportunities in clinical communication. Patient Education & Counseling, 2005; 58: 225–234. [DOI] [PubMed] [Google Scholar]
- 35. Paasche‐Orlow M, Roter D. The communication patterns of internal medicine and family practice physicians. Journal of American Board Family Practice, 2003; 16: 485–493. [DOI] [PubMed] [Google Scholar]
- 36. Levinson W, Roter DL, Mullooly JP, Dull VT, Frankel RM. Physician‐patient communication. The relationship with malpractice claims among primary care physicians and surgeons. Journal of American Medical Association, 1997; 277: 553–559. [DOI] [PubMed] [Google Scholar]
- 37. Bensing JM, Roter DL, Hulsman RL. Six minutes more: communication patterns in the US and the Netherlands. Journal of General Internal Medicine, 2003; 18: 335–342. [DOI] [PMC free article] [PubMed] [Google Scholar]
- 38. Roter D, Hall J. Doctors Talking with Patients/Patients Talking with Doctors: Improving Communication in Medical Visits. Westport Connecticut/London: Praeger, 2006. [Google Scholar]
- 39. Grol R, Wensing M, Mainz J et al Patients' priorities with respect to general practice care: an international comparison. Family Practice, 1999; 16: 4–11. [DOI] [PubMed] [Google Scholar]
- 40. Little P, Everitt H, Williamson I et al Preferences of patients for patient centred approach to consultation in primary care: observational study. British Medical Journal, 2001; 322: 468–472. [DOI] [PMC free article] [PubMed] [Google Scholar]
- 41. Bensing JM, Deveugele M, Moretti F et al How to make the medical consultation more successful from a patient's perspective? Tips for doctors and patients from lay people in the United Kingdom, Italy, Belgium and the Netherlands. Patient Education & Counseling, 2011; 84: 287–293. [DOI] [PubMed] [Google Scholar]
- 42. Rosenheim E, Golan G. Patients' reactions to humorous interventions in psychotherapy. American Journal of Psychotherapy, 1986; 40: 110–124. [DOI] [PubMed] [Google Scholar]
- 43. Granek‐Catarivas M, Goldstein‐Ferber S, Azuri Y, Vinker S, Kahan E. Use of humour in primary care: different perceptions among patients and physicians. Postgraduate Medical Journal, 2005; 81: 126–130. [DOI] [PMC free article] [PubMed] [Google Scholar]
- 44. McCreaddie M, Wiggins S. The purpose and function of humour in health, health care and nursing: a narrative review. Journal of Advanced Nursing, 2008; 61: 584–595. [DOI] [PubMed] [Google Scholar]
- 45. Rimondini M, Del Piccolo L, Goss C, Mazzi MA, Paccaloni M, Zimmermann C. Communication skills in psychiatry residents. How do they handle patient concerns? Psychotheraphy and Psychosomatics, 2006; 75: 161–169. [DOI] [PubMed] [Google Scholar]
- 46. Arora NK, McHorney CA. Patient preferences for medical decision making: who really wants to participate? Medical Care, 2000; 38: 335–341. [DOI] [PubMed] [Google Scholar]
- 47. McKinstry B. Do patients wish to be involved in decision making in the consultation? A cross sectional survey with video vignettes. British Medical Journal, 2000; 321: 867–871. [DOI] [PMC free article] [PubMed] [Google Scholar]
- 48. O'Cathain A, Murphy E, Nicholl J. Three techniques for integrating data in mixed methods studies. British Medical Journal, 2010; 341: 1147–1150. [DOI] [PubMed] [Google Scholar]
- 49. Hoppe RB. Standardised (simulated) patients and the medical interview. In: Lipkin M, Putnam SM, Lazare A. (eds) The Medical Interview. New York, NY: Springer, 1995: 397–404 [Google Scholar]


