Abstract
The estimation of the mean glandular dose to the breast (MGD) for x-ray based imaging modalities forms an essential part of quality control and is needed for risk estimation and for system design and optimisation. This review considers the development of methods for estimating the MGD for mammography, digital breast tomosynthesis (DBT) and dedicated breast CT (DBCT). Almost all of the methodology used employs Monte Carlo calculated conversion factors to relate the measurable quantity, generally the incident air kerma, to the MGD. After a review of the size and composition of the female breast, the various mathematical models used are discussed, with particular emphasis on models for mammography. These range from simple geometrical shapes, to the more recent complex models based on patient DBCT examinations. The possibility of patient-specific dose estimates is considered as well as special diagnostic views and the effect of breast implants. Calculations using the complex models show that the MGD for mammography is overestimated by about 30% when the simple models are used. The design and uses of breast-simulating test phantoms for measuring incident air kerma are outlined and comparisons made between patient and phantom-based dose estimates. The most widely used national and international dosimetry protocols for mammography are based on different simple geometrical models of the breast, and harmonisation of these protocols using more complex breast models is desirable.
1. Introduction
The estimation of the absorbed dose to the breast during x-ray based imaging is a long-established part of quality control procedures for breast imaging systems and is also necessary for risk estimation. Because of the high incidence of breast cancer, the use of mammography for screening, and the development of new x-ray based breast imaging modalities, methods of breast dosimetry have attracted considerable interest over many years and there is a large published literature on dosimetric methodology and the values of the breast dose. In a survey of the United Kingdom screening programme, Young and Oduko (2016) found that the average value of the dose to the breast for a two view digital mammography examination was 3.0 mGy. There is of course a risk of radiation induced carcinogenesis associated with the examination. This risk, though small, should be understood. For a dose to both breasts of 3 mGy, and using data given by Yaffe and Mainprize (2011), we estimate that the lifetime risk of radiation induced breast cancer per mGy for a 50 year old woman would be 3 in 100,000. The paper by Yaffe and Mainprize also provides estimates of the lifetime risk of radiation induced breast cancer for women attending various breast screening regimes.
In this review, after consideration of the historical development of breast dosimetry and the properties of the female breast, we discuss the various computational models which have been used to relate the measured quantity (usually the incident air kerma) to dose. Most attention is given to conventional projection mammography, but we also consider digital breast tomosynthesis (DBT), dedicated breast CT (DBCT), special diagnostic views and the effect of breast implants. In addition, we discuss other important issues in dosimetry, such as the design and use of breast phantoms and the comparison between phantom and patient dose estimates.
2. The development of mammographic dosimetry
In 1976 a survey was made of the dose from mammography in five US states (BENT, 1978). The results showed that the entrance exposure to a medium sized, medium density breast measured free-in-air ranged from “immeasurable” for the use of a screen-film image receptor to 16.6 R for the use of direct exposure film. A similar survey in the United Kingdom (Fitzgerald et al, 1981) used TLDs placed on top of a 5 cm thick breast phantom and reported values of the entrance surface dose ranging from 0.9 to 45 mGy. The corresponding values of the half value layer of the X-ray spectrum ranged from 0.2 to 1.7 mm Al and the peak tube voltage from 24 to 49kV.
A wide range of X-ray spectra was used for mammography at that time and it was realised that the entrance exposure at the top of the breast was a poor measure of risk as the dose within the breast decreases rapidly with increasing depth. Various alternative risk-related measures of dose were suggested including mid-breast dose (NCI, 1977) and total energy imparted (Boag et al, 1976) but it was Karlsson et al (1976) who suggested that the mean dose to the glandular tissues within the breast would be a better measure of risk as these tissues have the highest risk of carcinogenesis. The glandular tissue includes the acinar and ductal epithelium and associated stroma (NCRP, 1986) and Karlsson’s suggestion is generally supported. The use of the mean glandular dose (MGD, also known as the average glandular dose, AGD) for breast dosimetry was recommended by the ICRP in 1987 (ICRP, 1987) and indeed the estimation of this quantity forms the basis of most if not all national and international breast dosimetry protocols. Notwithstanding this, there is still some interest in estimating the energy imparted to the glandular tissues within the breast (Geeraert et al, 2015).
It is not possible of course to measure the MGD dose directly, so conversion factors are used which relate measurable dosimetric quantities to the MGD. These conversion factors depend upon the breast size and composition and the X-ray spectrum used for the examination. Therefore, it has not been practical to base them on measurements using phantoms to simulate the breast and instead they have been derived using Monte Carlo simulations. For this purpose, simple geometrical models of the breast have been developed and used to calculate conversion factors which relate the measurable quantity, the incident air kerma in mGy (originally the exposure, measured in R) to the MGD. Several authors have published values of these conversion factors, but the need for standardised national dosimetry systems was quickly recognised. The most widely used dosimetry systems for conventional projection mammography have been developed following the publications of Dance and colleagues (1990 and 2000) in the United Kingdom and Wu and colleagues (1991 and 1994) in the USA, which provide factors for the cranio-caudal (CC) projection. Subsequent extensions have allowed the calculation of conversion factors for a wide range of X-ray spectra, the medio-lateral oblique (MLO) projection, for contrast enhanced digital mammography (CEDM) and for digital breast tomosynthesis. Simple models of the breast have also been developed for the dosimetry of dedicated breast CT.
The limitations of using simple models of the breast have long been realised, and subsequently more complex models of the breast have also been used for dosimetry. Advances have included more realistic and detailed geometrical models, and more recently, models based on DBCT images of patients. Calculations using these models show important differences from those using simple models, but they have yet to be adopted for standard dosimetry protocols.
Although it is essential to estimate the MGD for patient exposures, it is also helpful to estimate the MGD based on exposures of test phantoms which simulate the breast. Such measurements are invaluable for quality control (QC) and inter-system comparison. They require a phantom or set of phantoms which provide an adequate simulation of the breast, and the development and modelling of such phantoms is still an active area of development.
3. Breast size and composition
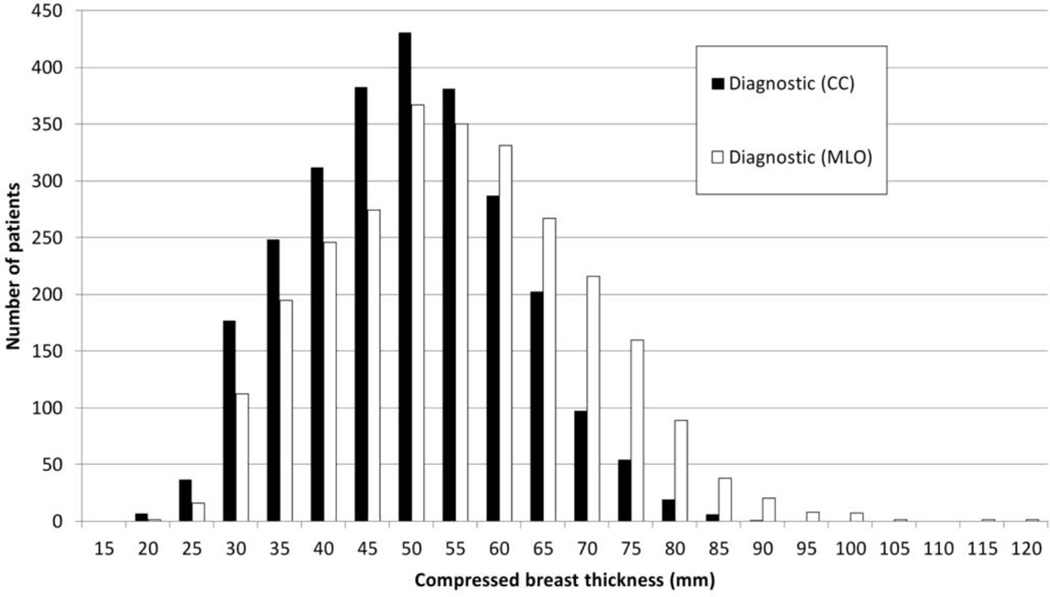
The development of models of the female breast requires knowledge of the breast size, breast composition and the chemical composition and density of each type of tissue. A review of data for projection mammography from 13 countries (Kelaranta et al, 2015), found that the compressed breast thickness varied from less than 5mm to 117 mm, with a mean thickness in the range 37–63 mm depending on population. Figure 1 shows typical distributions of compressed breast thickness for MLO and CC projections, taken from Kelaranta et al. As can be seen, the breast compressed for the MLO view tends to be thicker than when compressed for the CC view.
Figure 1.
Typical distributions of compressed breast thickness for CC and MLO views. The data are for women attending for a diagnostic examination. Figure from Kelaranta et al (2015) and reproduced by permission of Oxford University Press.
The area of the compressed breast in the image will tend to increase as the breast thickness increases. Dance et al (1980) give the typical area for a small compressed breast as 35 cm2. Boone et al (2000) analysed 82 mammograms for which the breast was fully imaged in a single view and found 5% and 95% percentile areas of 76.5 cm2 and 263.8 cm2 respectively. However, the area of a very thick compressed breast may be so large that more than one exposure is required to image the whole breast. Young and Oduko (2016) in a survey of data from the UK national breast screening programme found that 0.4% and 1.9% of women required additional views of each breast in the MLO projection for digital radiography (DR) systems and for screen-film systems respectively.
For the purposes of breast dosimetry, four major tissue types need to be considered, the skin, adipose and fibro-glandular tissues and the pectoralis muscle, although not all tissues are included in all models. At the time of the development of the simple models described here, assumptions had to be made about the skin thickness, but detailed measurements are now available from DBCT. Using this new modality, Huang et al (2008) found an average skin thickness for individual women ranging from 0.9 to 2.3 mm with an overall average of 1.45 mm and Vedantham et al (2012a) found an average thickness of 1.44 mm. Earlier estimates of the thickness range from screen-film mammography, were slightly larger, for example 0.7 to 3.0 mm (Pope et al, 1984 and Willson et al, 1982).
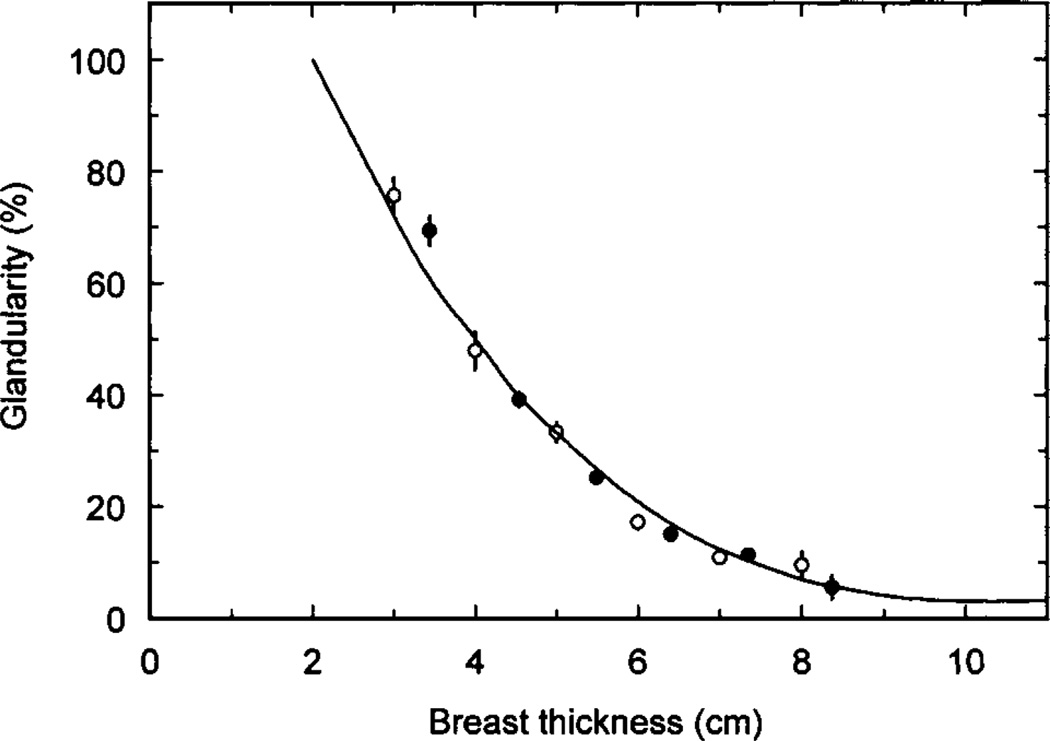
The amount of fibro-glandular tissue present is called the glandularity. Unfortunately, this can be expressed as a percentage volume or percentage mass glandularity. Also the region used to calculate the glandularity can be the whole breast or the compartment of the breast which contains the glandular tissue. The distribution of the adipose and fibro-glandular tissues within the breast is very important, as this will have a major influence on the magnitude of the MGD. In general the simple models assume that these tissues are uniformly distributed within a defined region of the breast, whereas the most realistic breast models are based on data from DBCT. Figure 2 shows the percentage mass glandularity of the central region of the breast model used by Dance et al (2000). The data are for use with women aged 50–64 attending the United Kingdom breast screening programme, and were obtained by comparing patient exposures for screen-film mammography obtained under automatic exposure control (AEC) with exposures using blocks of tissue simulating materials. Similar data were also provided for women in the age range 40–49. More recently, Yaffe et al (2009) have estimated volume glandularity using data for four cohorts of women, using data from an experimental DBCT scanner, and analysis of breast density from digitised screen-film mammograms. If the assumed skin thickness of 1.5 is mm omitted, the average volume glandularity, expressed as a proportion of the remaining breast volume was found to be 14.3%. More recently, two other groups of authors have calculated volume glandularities (excluding skin) based on analysis of DBCT images. Huang et al (2011), presented their results in terms of bra cup size and give average values of 17.7%, 19.2%, 13.2% and 13.2% for cup sizes A, B, C and D respectively. Vedanthan et al (2012b) found values of 17.2%, 6.7% and 24% for the mean, first and third quartile respectively of the volume glandularity. Very similar values were used in Monte Carlo calculations by Hernandez et al (2015). For a medium sized breast they used volume glandularities of 7.3%, 12.6% and 19.1% corresponding to the 25th, 50th and 75th percentiles of the distribution of glandularities. It is interesting to note that the equivalent volume glandularities for 50 and 60 mm thick compressed breasts calculated for the whole breast volume using the mass glandularities of Dance et al (2000) are 22% and 14%. This can be considered good agreement with above-reported values given the differences in methodology and patient cohorts. It is, however, clear that careful specification is required when comparing values of glandularity from different sources.
Figure 2.
Estimates of average breast composition for different compressed breast thickness from two United Kingdom centres for women in the age range 50 to 64. The error bars correspond to ±1 standard error on the mean. In some cases the error bars are too small to show. Figure from (Dance et al, 2000).
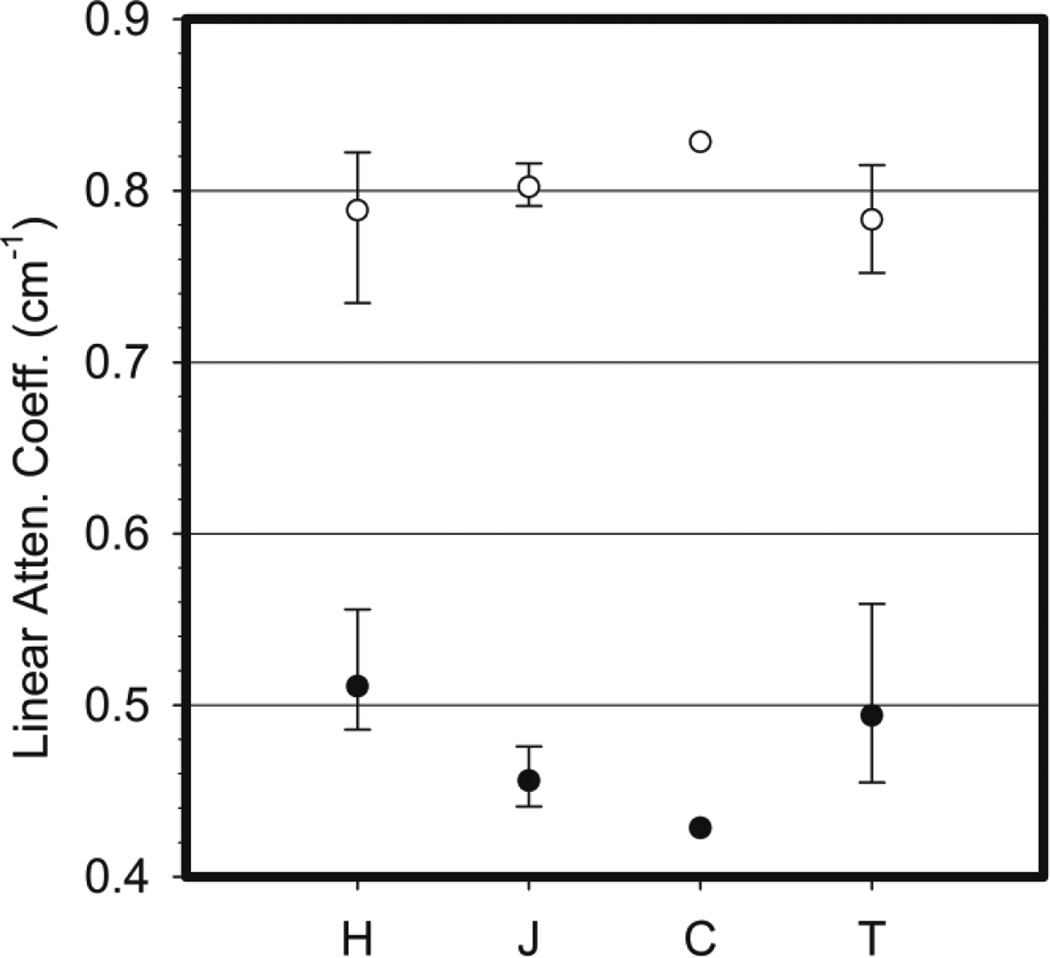
Data on the density and composition of breast tissues are very limited. Most Monte Carlo calculations use the measurements of Hammerstein et al (1979) based on measurements from 5 samples of glandular tissue, 8 samples of adipose tissue and 6 samples of skin. Figure 3 shows the linear attenuation coefficient at 20 keV calculated from the Hammerstein data for adipose and glandular tissue and also values of these coefficients taken from or deduced from measurements of three other groups (Johns and Yaffe, 1987, Tomal et al, 2010 and Chen et al, 2010). Where available the range and average value for each tissue type is shown. It can be seen that there is quite good agreement for glandular tissue, but there are differences for adipose tissue and therefore further measurements are desirable. Preliminary results for adipose and glandular tissue using spectral mammography have recently been presented by Fredenberg et al (2015) and it is anticipated that more extensive data will be available in due course.
Figure 3.
Linear attenuation coefficients for adipose (closed circles) and glandular breast tissues (open circles) at 20 keV. Data compiled from H Hammerstein et al (1979), J Johns and Yaffe (1987), C Chen et al (2010) and T Tomal et al (2010).
4. Monte Carlo modelling
Various Monte Carlo codes have been used for modelling mammography, including the standard codes MCNP or MCNPX (for example Wu et al 1990, 1992, Ma et al, 2008, Nosratieh et al 2015, Hernandez et al, 2015) and Geant4 (for example Sechopoulos et al 2007a, 2012, Sechopoulos and D’Orsi 2008), and the bespoke codes developed by Dance and colleagues (Dance 1980, 1990, Dance et al 2000, 2009, 2011, Dance and Young 2014) and by Boone and colleagues (Boone 1999, 2002). There are two important features to note. The first is the need to allow for photon scattering from bound electrons which comprises coherent (Rayleigh) scattering (with zero energy transfer) and incoherent scattering (with energy transfer to an electron). Because of the low energy used in mammography such energy transfers from incoherent scattering are quite small (even when the photon is backscattered) so that most of the absorbed dose to breast tissues arises from photoelectric interactions. Unfortunately, because of lack of appropriate data, it is necessary to assume that these scattering processes arise from free atoms, whereas in reality the atoms themselves are bound into molecules and the molecules themselves interlinked into more complex structures. The second important feature to note is that the range of electrons in soft tissue is sufficiently small at mammographic energies that kinetic energy of electrons released in photon interactions can be assumed to be locally absorbed. A similar comment applies to the characteristic X-rays which may be emitted (albeit with a low probability) following interactions with the low atomic number atoms which make up breast tissue.
5 Conversion factors for projection mammography using simple geometrical models of the breast
5.1 Model developed by Dance and colleagues
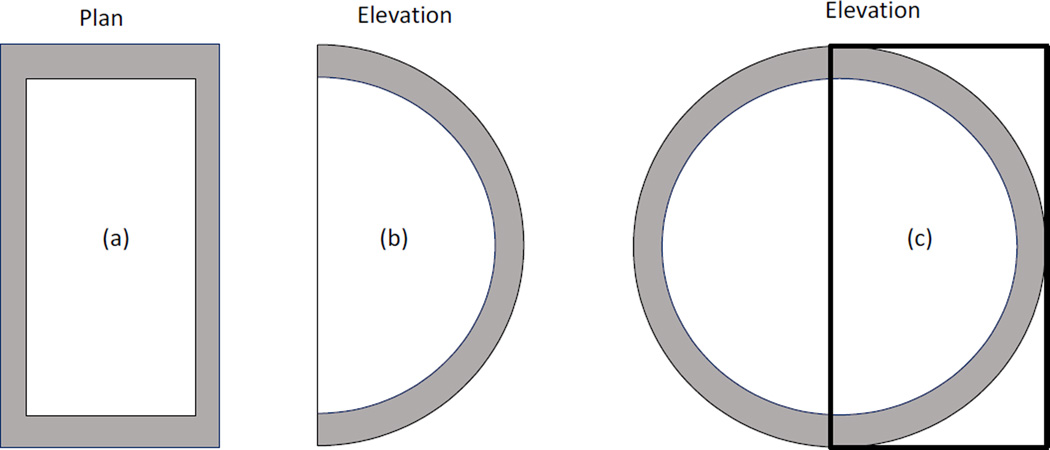
Conversion factors used in the United Kingdom (IPEM, 2005), European (EC, 2013) and IAEA (2006) breast dosimetry protocols are all based on the simple breast model used by Dance and colleagues. Their model breast is based on the suggestion of Hammerstein et al (1979) and in its most recent version comprises a cylinder of fixed semi-circular cross section of diameter 160 mm and of variable height between 20 and 110 mm. The breast has a central region which is composed of a specified homogeneous mixture of adipose and glandular tissues, and an outer ‘shield region’ 5mm thick (figure 4). The skin is ignored in this model and no glandular tissue is closer than 5 mm to the breast surface. The percentage by weight of glandular tissue in the central region is called the glandularity. In its first implementation, this model breast (Dance, 1980, 1990) followed Hammerstein et al (1979) and used a glandularity of 50%. Subsequently it was realised that this was too simplistic and the model was extended to provide factors at different glandularities. In order to give guidance, typical glandularities to use for women of age groups 40–49 and 50–64 (figure 2) were provided (Dance et al, 2000).
Figure 4.
Simple geometrical models used by Dance (1990) (a,b), Wu et al (1991) (a,b) and Boone (1999) (a,c) to model the breast in the CC projection. All three models have a central region which is a homogeneous mixture of adipose and glandular tissues surrounded by an outer layer. In the Dance model this layer is adipose tissue whereas in the other two models it is skin. In the Dance model the breast is a cylinder of semi-circular cross section, whereas in the Wu model it has semi-elliptical cross section. The Boone model (a, c) uses a phantom of circular cross section, only half of which is irradiated (the thick line shows the position of the radiation field.
The conversion factors calculated in Dance (1990), were thus for a model breast of 50% glandularity and were tabulated as a function of the half value layer of the X-ray beam and breast thickness. The table was intended for use with a limited range of X-ray spectra with systematic errors associated with the choice of spectrum of 5% or less. By 2000, further spectra were being used for projection mammography (Dance et al, 2000) and data for additional spectra were added then and in 2009 and 2011 (Dance et al, 2009, 2011). Data for contrast mammography were added in 2014 (Dance and Young, 2014). The formalism used to calculate the mean glandular dose, D, allowing for these variations, is given in the following equation:
| (1) |
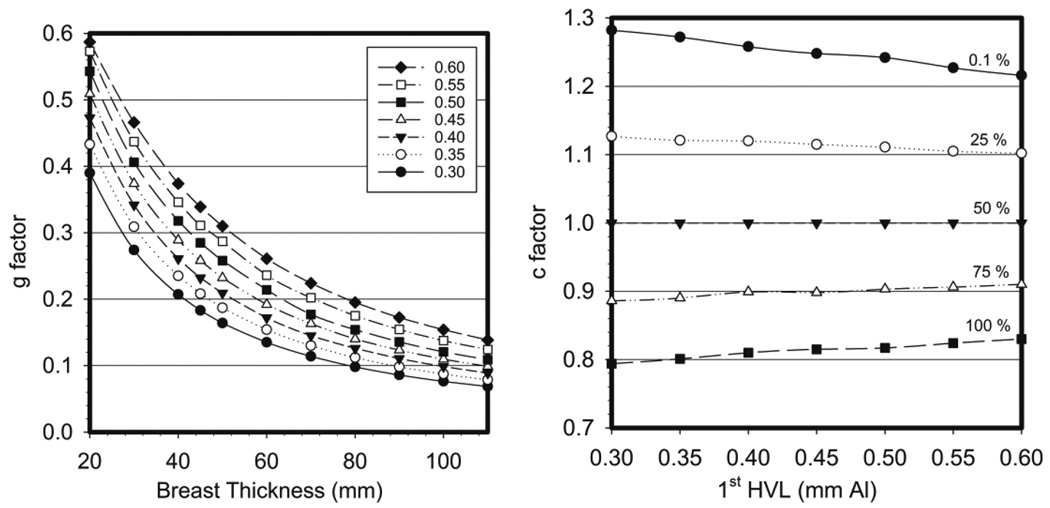
where K is the incident air kerma (without backscatter) at the upper surface of the breast, g is the conversion factor for a breast of 50% glandularity at the specified HVL (figure 5 left) and the factors c and s correct for breast composition (glandularity) and choice of X-ray spectrum (target/filter combination), respectively. The factor c is 1 for a 50% glandularity breast. It is more than 1 and less than 1 for less and more glandular breasts and is tabulated against HVL and breast thickness (figure 5 right). Whenever possible, a single value of s was given for each target/filter combination, but in a few cases a more detailed tabulation was necessary. With this formalism, the systematic errors associated with the choice of spectrum remained at 5% or less. For most of the spectra considered (Mo/Mo, Mo/Rh, Rh/Rh, W/Rh, W/Ag, W/Cu, Mo/Cu and Rh/Cu), the s-factor was in the range 1.000–1.062 but higher values were required for some W/Al spectra.
Figure 5.
(left) The g factor for varying breast thickness and 1st HVL. (right) c factors for a 5 cm compressed breast thickness for varying breast glandularity and 1st HVL. Data taken from Dance et al (2000).
During the development of this model, the calculation of the incident air kerma has gradually been refined. In Dance et al (2009 and 2014) a 30 mm diameter air-filled ionisation chamber was used placed immediately under the compression paddle to allow estimation of the contribution of forward scattered radiation from the paddle to the air kerma measurement. This was found to be 7.6% in reasonable agreement with measurements of Hemdal et al (2011) and Toroi et al (2013). It was thus important to make clear how air kerma was calculated and how it should be measured to avoid unnecessary systematic errors.
In view of the variation in the composition of breast tissues measured by Hammerstein et al (1979), the Dance model has also been used to investigate the effect of using different elemental compositions for glandular and adipose tissues on the calculated conversion coefficients. It was found that using the extreme ranges of the compositions given by Hammerstein et al changed the conversion coefficients by 5–7% depending upon breast thickness (Alm Carlsson and Dance, 1992).
5.2 Models developed in the USA
5.2.1 Model developed by Wu and colleagues
In the United States, breast dosimetry is usually performed using the Monte Carlo model of Wu et al (1991, 1994). In this model, the breast shape was also defined as a cylinder, but with a semi-elliptical cross-section, with a long axis of 180 mm and a short axis of 160 mm. The composition of the breast was defined as an outer 4 mm thick layer of skin surrounding an inner core of a homogeneous mixture of adipose and glandular tissue (figure 4). The relative amounts of adipose and glandular tissue were varied from 0% adipose/100% glandular to 100% adipose/0% glandular, including a single intermediate mixture of 50%/50%. The compositions of the three breast tissue types were based on the work of Hammerstein et al (1979).
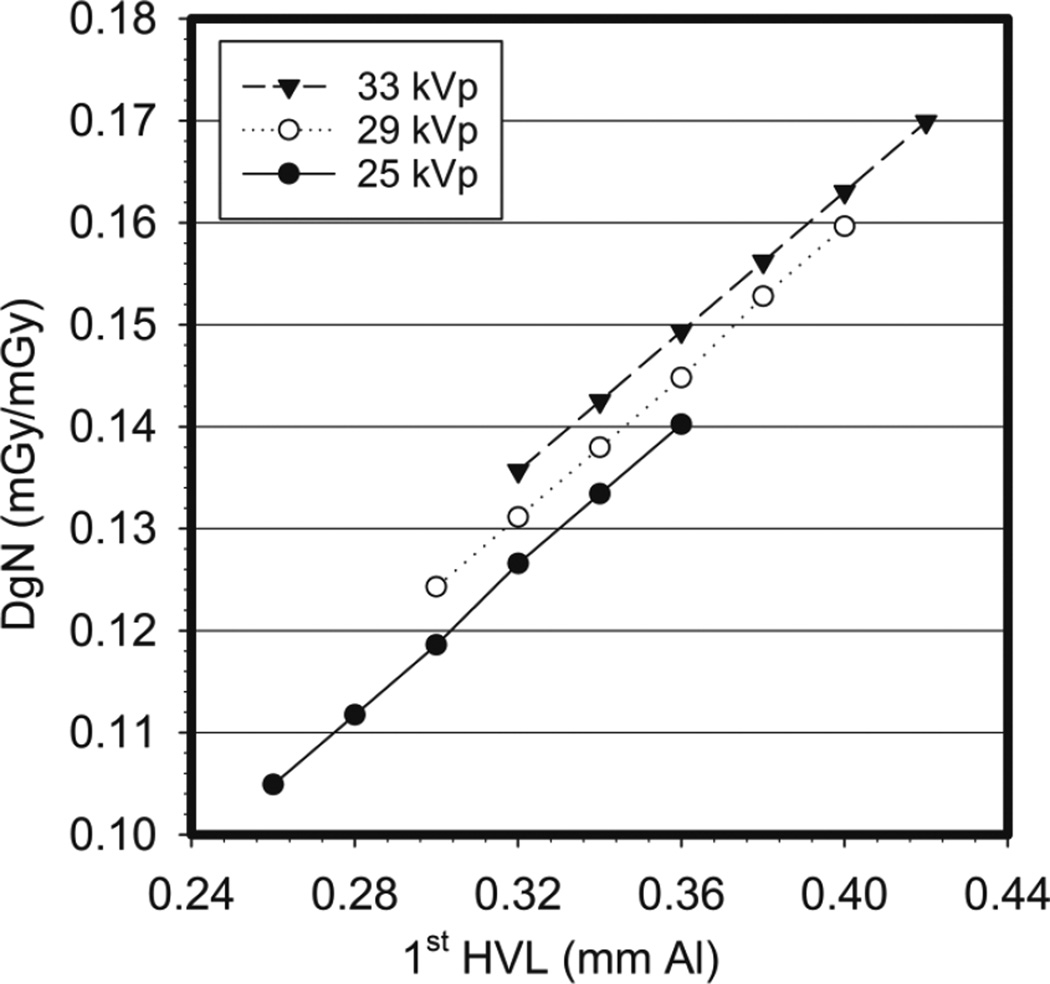
In this model, the mean glandular dose, denoted by Wu et al as Dg, is obtained by multiplying the incident air kerma1 by a factor denoted the normalized average glandular dose (DgN). Using Monte Carlo simulations, Wu et al (1991) tabulated values for DgN for the breast as defined above for x-ray spectra for a molybdenum target/molybdenum filter source, for a range of tube voltages and first half value layers (HVL), while varying the compressed breast thickness from 3 to 8 cm. Figure 6 shows an example of the variation in DgN that Wu et al found with tube voltage, motivating the inclusion of this parameter in their tabulated values. In this model, the reference entrance skin exposure is defined as the exposure measured with no backscatter, 4 cm from the chest wall edge of the detector and at the centre line, just below the compression paddle with a field size slightly larger than the chamber. Of course, in practice this measurement is performed at one height from the support plate and the exposure at the entrance height is obtained by the inverse square relationship. Wu et al determined in this work that due to the heel effect, which is ignored when measuring the incident air kerma at just one point, for the modelled breast the incident air kerma varies by up to 7% while the beam hardens by 2% in terms of 1st HVL.
Figure 6.
Variation of the DgN with tube voltage and 1st half value layer as determined by Wu et al (1991).
In follow-up work, Wu et al published additional values for DgN for sources with Mo targets and Rh filtration and for Rh/Rh target/filter combinations (Wu et al., 1994). As opposed to adding adjustment factors to the original exposure-to-dose conversion coefficient as in the Dance model, Wu and colleagues decided to publish additional tables for DgN for these different x-ray spectra. As expected, the DgN for the same breast characteristics, tube voltage and 1st HVL for Rh/Rh spectra is higher than that for Mo/Rh spectra, which is also higher than that of Mo/Mo spectra. This corresponds with the same trend in mean energy of the spectra. The tables published by Wu et al were later parameterized by Sobol and Wu (1997) to facilitate the estimation of DgN values for intermediate imaging conditions not listed in the published tables.
5.2.2 Model developed by Boone
Boone extended the model of Wu et al by performing Monte Carlo simulations for a larger range of compressed breast thicknesses and reporting data on DgN for mono-energetic x-rays up to 120 keV (Boone, 1999). In addition to providing graphs with the mono-energetic data, Boone combined the Monte Carlo results to obtain normalized glandular dose coefficients for various target/filter sources. These included not only the then “traditional” Mo/Mo, Mo/Rh and Rh/Rh, but also other target/filter combinations, specifically W/Rh, W/Pd and W/Ag. In this work, the definition of the breast was modified slightly from that of Wu et al, with the major modification being the inclusion of additional tissue posterior to the breast to allow for backscatter from the chest (figure 4).
The previous publications (Dance, 1990; Wu et al., 1991) did not explain in detail how the energy absorbed in the central homogeneous region of the breast was apportioned between the adipose and glandular tissues present. In his 1999 paper (Boone, 1999), Boone describes how he used a factor G to make this apportionment. The factor G was given by:
| (2) |
where fg is the glandularity of the breast, and the µen/ρ terms are the mass energy absorption coefficients for glandular and adipose tissue, as denoted by the g and a subscripts, respectively. However, the G factor used by Boone was that corresponding to the initial photon energy and was only applied at the end of each Monte Carlo simulation. As pointed out by Wilkinson and Heggie (2000) this can potentially introduce inaccuracy in the results, especially for higher energy x-rays. Specifically, after a photon undergoes a Compton scatter event, its energy decreases, and therefore any subsequent dose deposition event undergone by that photon at this new energy requires that it be weighed by the G factor that corresponds to this lower energy, not that of the original x-ray. As discussed by Wilkinson and Heggie and computed by Boone in his reply, this effect is negligible for typical mammographic spectra, but it becomes substantial at higher energies (e.g. >10% above 45 keV), with a maximum error of up to 32% at 80–90 keV for an adipose breast. Therefore, for standard mammography conditions and for most other advanced modalities (breast tomosynthesis, contrast-enhanced mammography, etc.), this effect is minor.
In a follow-up study, Boone determined the mono-energetic DgN(E) values for x-ray energies ranging from 8 keV to 50 keV for breasts of 0%, 50% and 100% glandularity, and compressed breast thicknesses of 2 to 9 cm (Boone, 2002). To aid the use of all these data, Boone provided fit equations for the results, allowing the reader to obtain values for all interested energies within this range, which can then be combined using:
| (3) |
to obtain the DgN for a specific spectrum. In Equation 3, Φ(E) is the fluence at each energy bin E, ϑ(E) is the conversion from fluence to exposure. Making these fit equations available for mono-energetic data removed the need to keep generating tables of spectral DgN coefficients as new target/filter combinations or higher tube voltages, up to 50 kVp become available. It should be noted, however, that the fit equation provided by Boone for ϑ(E), the exposure per photon/mm2 in Appendix D of his work, is incorrect and should not be used (Dance and Young, 2014, Nosratieh et al, 2015).
In their 2015 paper (Nosratieh et al, 2015), Boone’s group present the calculation of DgN values for a very wide range of X-ray spectra, for breast thicknesses in the range 30–80 mm and for five different glandularities. Thus there appears to be no data published using this model for small or very large breasts.
6. Conversion factors for DBT using simple geometrical models of the breast
The introduction of digital breast tomosynthesis (DBT) by Niklason et al (1997) resulted in extensive medical physics and eventually clinical research, which, although now DBT is present in the clinic, continues to this day. Especially given its potential for use as a screening modality, the mammographic models for breast dosimetry had to be extended for DBT. Sechopoulos et al (2007a) proposed to extend the mammography model by adding a term, denoted the Relative Glandular Dose (RGD(α)), which accounts for the variation in the DgN, as defined in the Wu and Boone models, when the x-ray source is positioned at non-zero projection angles (i.e. not at the usual mammography position). Therefore, to estimate the mean glandular dose in tomosynthesis with this method, the equation to be used is:
| (4) |
where XCR is the incident air kerma at the intersection of the central ray and the detector support plate for the 0° DBT projection, DgN0 is the normalized glandular dose for mammography (0° DBT projection) and RGD(α) is the relative glandular dose for the DBT projection at α degrees. For a given set of projections, e.g. for a DBT system of a given manufacturer, if the total tube output for the entire DBT projection set is divided equally among all the projections, then equation 4 above can be simplified by replacing the sum by the average RGD(α) of the entire projection set, denoted µRGD.
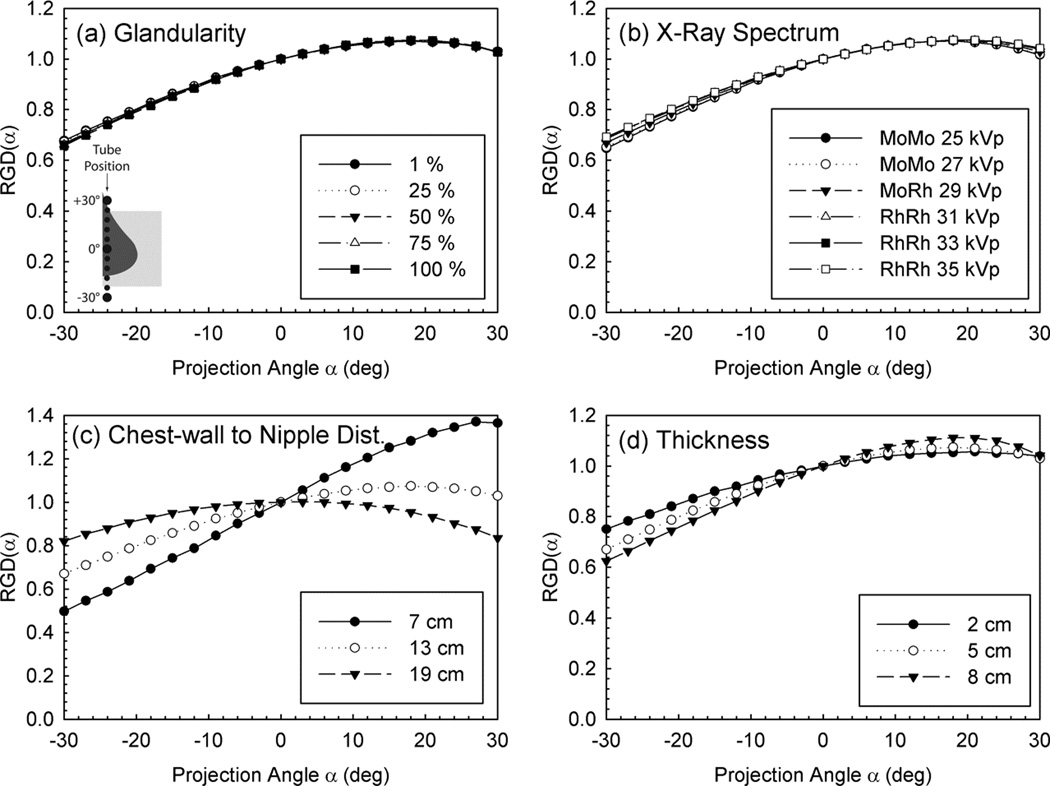
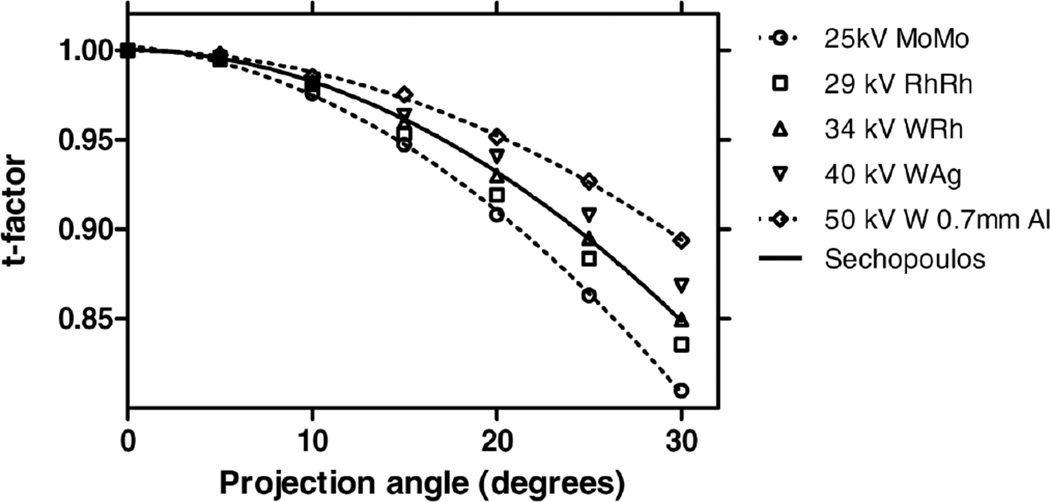
Maintaining the DgN separate from the projection angle variation allowed the values of DgN to be tabulated without the additional variable of projection angle, and the reporting of the RGD(α) values using fit equations as a function of only breast thickness and size and DBT projection angle. This is due to the fact that RGD(α) appears to be mostly affected by geometry, and not other factors such as x-ray energy or breast glandularity (figure 7).
Figure 7.
Variation of RGD(α) with DBT projection angle for various simulation factors, showing its independence with glandularity and x-ray spectrum. Figure from Sechopoulos et al (2007a). Copyright (c) 2007, American Association of Physicists in Medicine (AAPM).
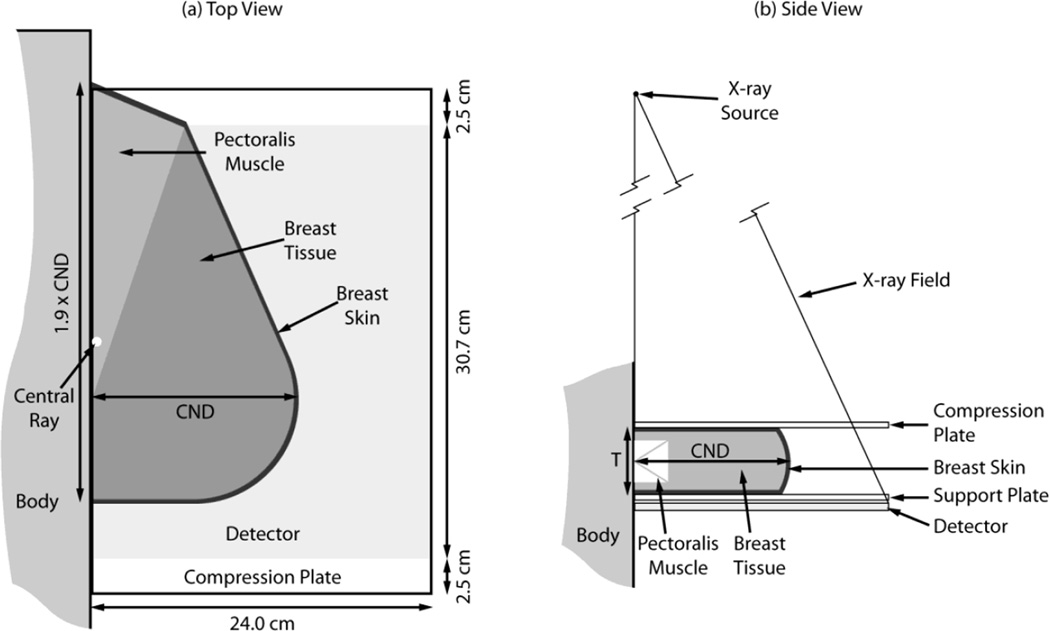
Given that at the time it was believed that DBT might possibly be performed only in the medio-lateral oblique (MLO) view, Sechopoulos et al also created a geometrical model for this view, which included a more complex solid representing the compressed breast (figure 8). For realism, this model included a portion of the pectoralis muscle within the breast tissue, as is the case in MLO views positioned adequately. Interestingly, this allowed for the comparison of DgN between CC and MLO acquisitions. It could be seen that since the dose to the pectoralis muscle is excluded from the mean glandular dose, the DgN for the MLO view is lower than that for the CC view, with all other parameters being equal. This difference is quite consistent; on average the DgN for the MLO is 10.3% lower than that for the CC view, with the range of variations being 8.5 – 11.3 %, depending on the spectrum and breast thickness and glandularity. It should be noted that in this work, a different reference point was used for the calculation and measurement of air kerma. The reference point was positioned on the surface of the breast support plate closest to the chest wall edge of the detector and at the midline along the chest wall. No backscatter was included in the calculation. One other variation in this work from previous dose models was the inclusion of the heel effect in the Monte Carlo simulations. To gauge the impact of this change on the resulting dose estimates, one set of Monte Carlo simulations was repeated without the heel effect. For the breast considered, this resulted in a 7% increase in DgN0 coefficients, with no real impact on the RGD(α).
Figure 8.
Model of the MLO view breast as developed by Sechopoulos et al. Figure from Sechopoulos et al (2007a). Copyright (c) 2007, American Association of Physicists in Medicine (AAPM).
To extend the utility of their previous work to systems with tungsten target sources, Sechopoulos and D’Orsi (2008) published additional DgN0 values for spectra emitted by x-ray sources with W/Al and W/Rh target filter combinations. To accommodate other x-ray sources, Ma et al (2008) performed Monte Carlo simulations and published DgN results (denoted MGD in their work) for W/Al and W/Al+Ag target filter combinations for both the CC and MLO views. As opposed to the works by Sechopoulos et al, Ma and colleagues tabulated DgN for different angles, without separating the effect of projection angle into the RGD(α) term.
The addition of the effect of the tomosynthesis angle as an extra parameter to the mammography model was adopted by Dance et al (2011) for the UK, European and IAEA dosimetry protocols. In this work, the equivalent to the RGD(α) is denoted the t(θ) factor, while the system-specific µRGD is denoted the T factor. Therefore, t factors for a range of thicknesses and projection angles are provided in that work, along with T factors for both generic systems with assumed scan ranges and for two specific manufacturer DBT systems: the Hologic Selenia Dimensions and the Siemens Inspiration. Given their similar definition, Dance et al compared their resulting t factors with the RGD(α) values of Sechopoulos et al and found good agreement (figure 9). Factors for equipment manufactured by four other companies are given in van Engen et al (2015). Dance and colleagues determined that using the same t factors for different x-ray spectra introduces a maximum error of 5.7% for the conditions studied. However, when a complete DBT scan is considered, the maximum error in the T factor is reduced to 2.4%
Figure 9.
Comparison of Dance et al’s t factors with Sechopoulos et al’s RGD(α), showing the expected similarity given their equivalent definition. Figure from Dance et al (2011).
In the work by Dance et al, the DBT prototype developed by Philips (formerly Sectra, as denoted in that work) is considered separately given its major differences in acquisition geometry compared to other DBT systems. However, Dance and colleagues were able to maintain the form of the equation to obtain the MGD for tomosynthesis acquisitions, by defining the T factor somewhat differently and denoting it TS. Due to the continuous nature of the slot scan acquisition and the dependency on the slot width, no associated t factors were provided. Therefore, a single table with TS factors is provided by Dance et al to accommodate other target/filter combinations now introduced in clinical systems for tomosynthesis, this work also includes a table of s factors for a W target with a 0.7 mm Al filter, as is used by the Hologic Selenia Dimensions system for DBT imaging.
In work similar to that performed by Sobol and Wu (1997), Li et al (2013) parameterized the data published for mammography and breast tomosynthesis dosimetry by various authors using singular value decomposition, resulting in a set of Excel (Microsoft, Redmond, Washington, USA) spreadsheets that can be used to obtain the different relevant factors of each dose model
In 2014, the American Association of Physicists in Medicine (AAPM) published Task Group Report #223 on radiation dosimetry in DBT in which the Wu et al model for mammography was extended for breast tomosynthesis (Sechopoulos et al., 2014). For this, the concept of the RGD(α) and system-specific mean RGD (denoted ) were used and the values for a generic system and for five commercial and prototype systems are provided. For the Philips (former Sectra) slot scan system, the report provides DgNTOMO conversion coefficients to convert incident air kerma directly to MGD, without the use of DgN0 and RGD values.
7. Conversion factors for breast CT using simple geometrical models of the breast
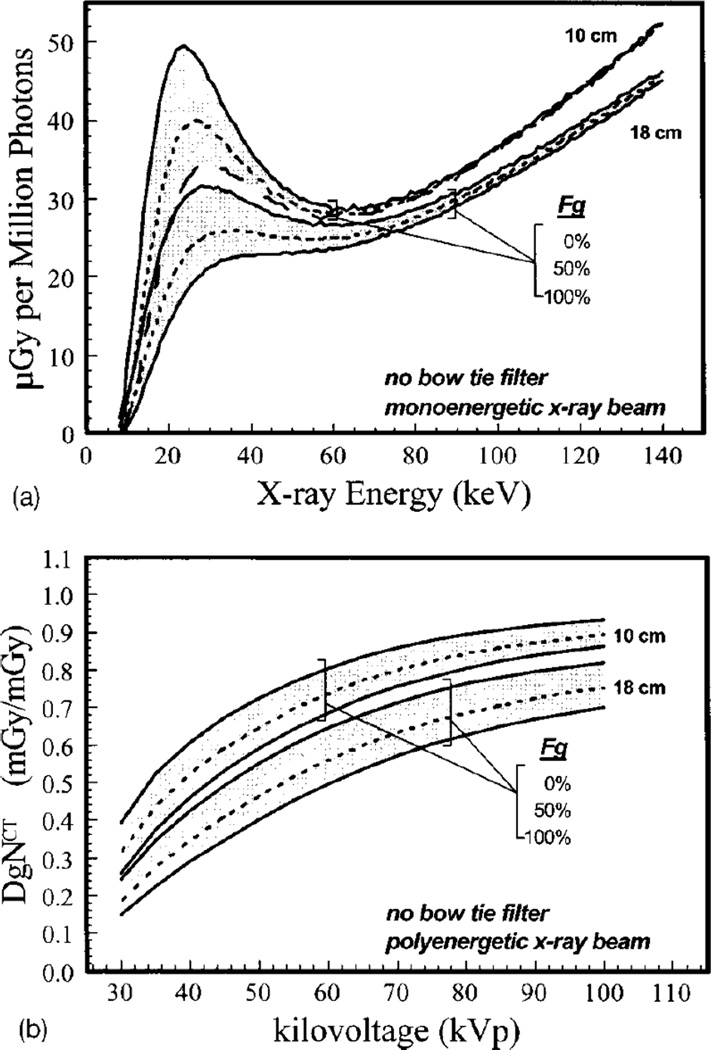
Although the development of DBT introduced limited tomographic imaging in x-ray based breast imaging, true tomographic imaging can only be achieved with full rotation imaging around the breast. To achieve this, dedicated breast CT has been developed by various groups around the world (Boone et al, 2001; Ning et al, 2004; Tornai et al., 2005; Kalender et al, 2012). Boone et al developed a model for DBCT dosimetry that resembles the mammography dose model used in the USA. Specifically, Boone et al defined DgNCT as the conversion factor from air kerma at the DBCT iso-center to the MGD to the imaged breast. The reference air kerma was defined as that measured by a 10 cm CT pencil chamber positioned vertically (in the direction from the chestwall to the nipple) from the central ray downwards. Boone et al provided graphs of both mono-energetic and spectral DgNCT for a range of spectra, breast sizes and glandularity, in addition to investigating its variation under different conditions, such as the presence or absence of a bow-tie filter and a change in source-to-isocentre distance (figure 10).
Figure 10.
(top) Monoenergetic Monte Carlo results of MGD per million photons simulated for DBCT acquisitions for breasts of two sizes (defined as the diameter at the chest wall), three glandularities and a range of x-ray energies. (bottom) Result of combining the monoenergetic results to obtain spectral DgNCT coefficients for the same breasts for a range of tube voltages. Figures from Boone et al (2004). Copyright (c) 2004, American Association of Physicists in Medicine (AAPM).
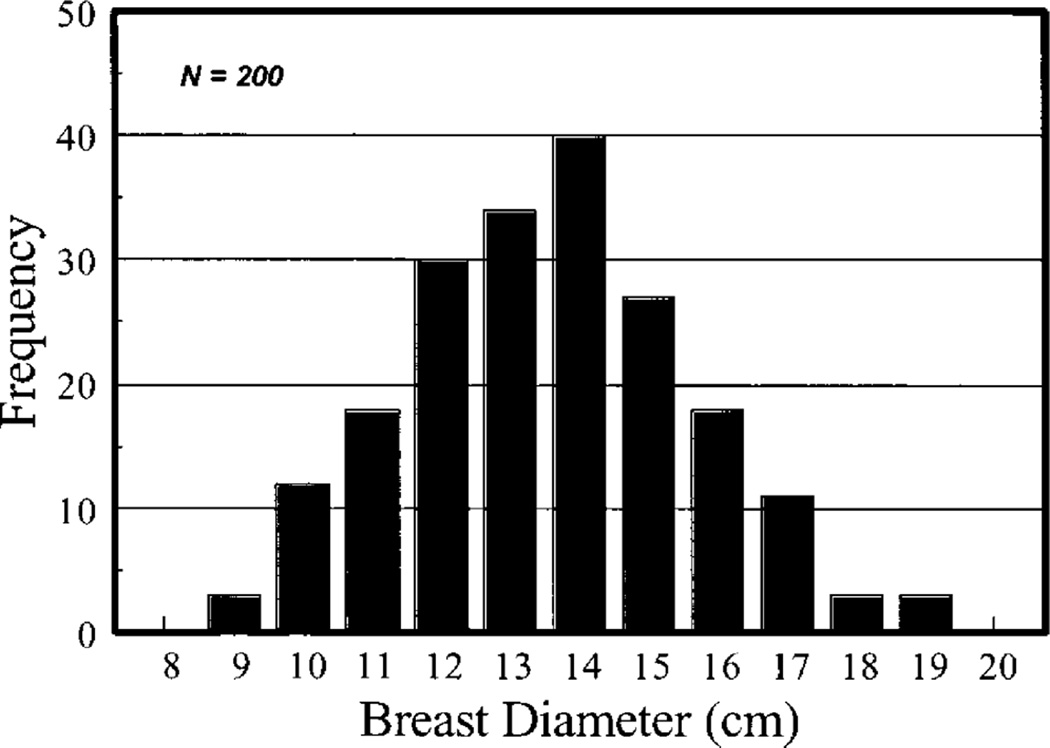
Since during DBCT acquisition the breast is uncompressed and pendant through a hole in the table where the patient lies prone, Boone et al defined the breast as a cylinder of homogeneous adipose and glandular tissue mixture surrounded by skin, with the long axis in the chestwall to nipple direction. A study of 200 patients determined that the average diameter of the breast at the chestwall is 140 mm with a 95% range of 100 to 180 mm (figure 11). Comparisons of DgNCT for varying relationship between the length of the cylinder and its diameter showed a small variation in DgNCT with the former, so most results were provided for a cylinder with the length being 1.5 times the radius. Thacker and Glick (2004) provided additional graphs of mono-energetic DgNCT and also compared one set of DgNCT coefficients when simulating the breast as a hemi-ellipsoid as opposed to a cylinder, finding small differences, of the order of 5%, depending on the x-ray energy. Sechopoulos et al (2010) simulated a DBCT commercial system (Koning Corp., West Henrietta, NY) using Monte Carlo simulations and a hemi-ellipsoidal representation of the breast of varying sizes and compositions and provided the DgNCT coefficients for the x-ray spectrum used by this specific DBCT system. For possible DBCT acquisitions that involve a circle-plus-line trajectory, Vedantham et al (2012c) introduced the relative normalized glandular dose coefficient (RDgN(y)) which provides the MGD resulting from the projection acquired when the x-ray source is at position y below the line of the circular scan.
Figure 11.
Distribution of breast diameters at the chest wall over 200 patients, measured for the modelling of the uncompressed breast during DBCT acquisition. Figure from Boone et al (2004). Copyright (c) 2004, American Association of Physicists in Medicine (AAPM).
Given their intention that DBCT be used as a screening technology, and therefore imposing the limit that a single DBCT scan be performed at the same dose as a two view mammogram, in a subsequent study, Boone et al provided tables of the air kerma at the isocentre that results in this dose level for breast of varying sizes and compositions (Boone et al., 2005).
8. Estimation of the mean glandular dose using more realistic breast models
Although several breast representations are in use in the dosimetry models described in Sections 5–7, it should be noted that these models are only appropriate for specific applications. All use a representation of the breast that assumes that the interior tissue of the breast consists of a homogeneous mixture of adipose and glandular tissue. In addition, simplifications and assumptions have been made regarding the shape of the compressed breast, the thickness of the skin, and the range of clinically encountered breast glandularities.
Of course these simple geometry models involve a simplification of the true breast anatomy, but they can be, and are, adequate for comparisons, optimization, quality control, and other applications in which the relationship between two or more MGD values is more important than the actual magnitude of MGD. In addition, and more importantly, the MGD values estimated from these models should not be regarded as the dose to the patient’s breast. Even with new image analysis techniques in which, e.g. the actual glandularity of the breast can be estimated in an objective fashion (e.g. Highnam et al, 2010) and therefore the appropriate c factor of Dance’s model can be used, this estimation still includes the other simplifications and assumptions of the breast model. The introduction of dedicated breast CT allowed for the first time to obtain high contrast, high spatial resolution 3D images of patient breast tissue in vivo. As noted in Section 3 above, DBCT patient images have provided a lot of new information on the true characteristics of patient breasts relevant to breast dosimetry including breast glandularity, skin thickness and a large amount of anatomical information on breast size, volume and glandular tissue distribution (Huang et al, 2008, 2011; Yaffe et al, 2009; Vedantham et al, 2012a, 2012b). An early application was a study by Huang et al (2011) who found that using the DBCT measured breast skin thickness of 1.45 mm in the breast model rather than the commonly used 4 mm when calculating mammography dose conversion factors resulted in an increase in the MGD of 10% to 20%. This result demonstrates the important influence that the breast model has on the calculated breast dose, but it is still based on the assumption that there is a homogeneous mixture of adipose and glandular tissues extending throughout the breast and right up to the skin boundary.
Although this new knowledge obtained from DBCT may help in refining the breast models used for dosimetry, the MGD is especially influenced by the position of the glandular tissue within the breast. This is especially true for the vertical location (in the direction between the x-ray source and the detector) of the tissue during compression. The impact of vertical location was first investigated by Boone. In reply to a comment by Wilkinson and Heggie on his 1999 work, Boone determined that varying the vertical position of a slab of 5 mm of glandular tissue inside an adipose breast model can result in a variation in the MGD of up to 84% (Wilkinson and Heggie, 2000). In a study using an anthropomorphic breast phantom, Dance et al (2005) evaluated the difference in conversion coefficient g obtained for the simple homogeneous model of breasts of different thickness and glandularity to that of structured breasts of equivalent thickness and overall glandularity. A difference of up to 43% was found between the estimates of g.
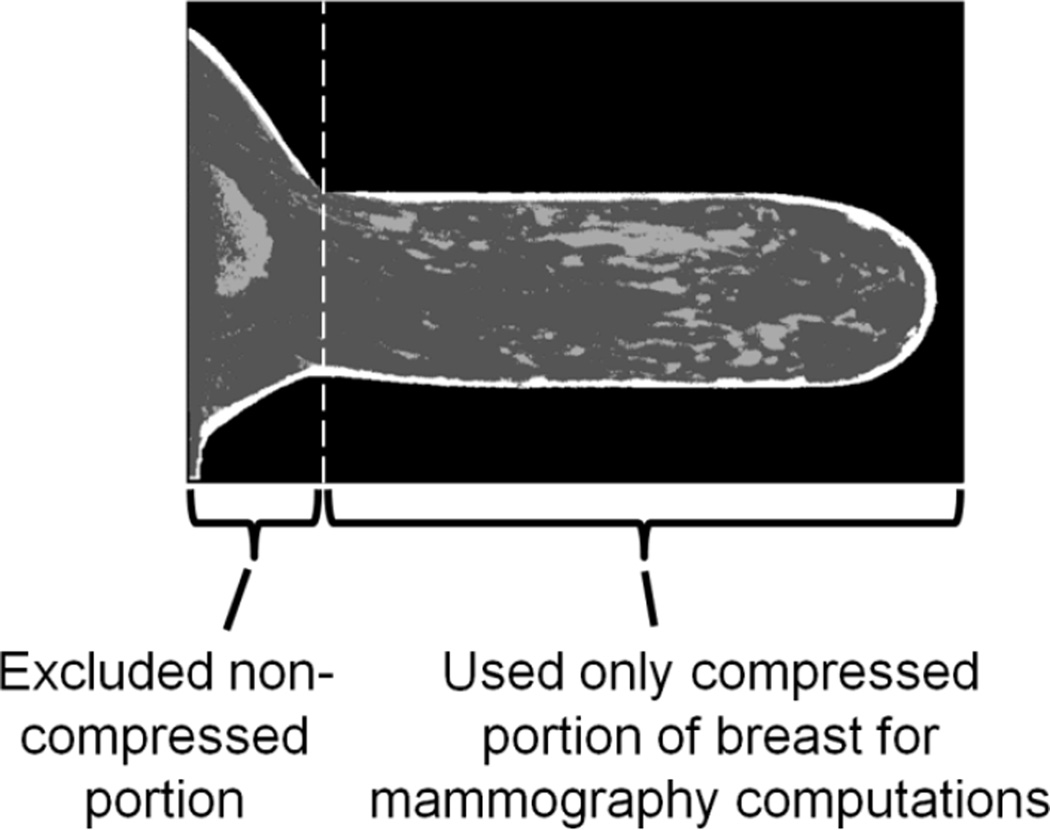
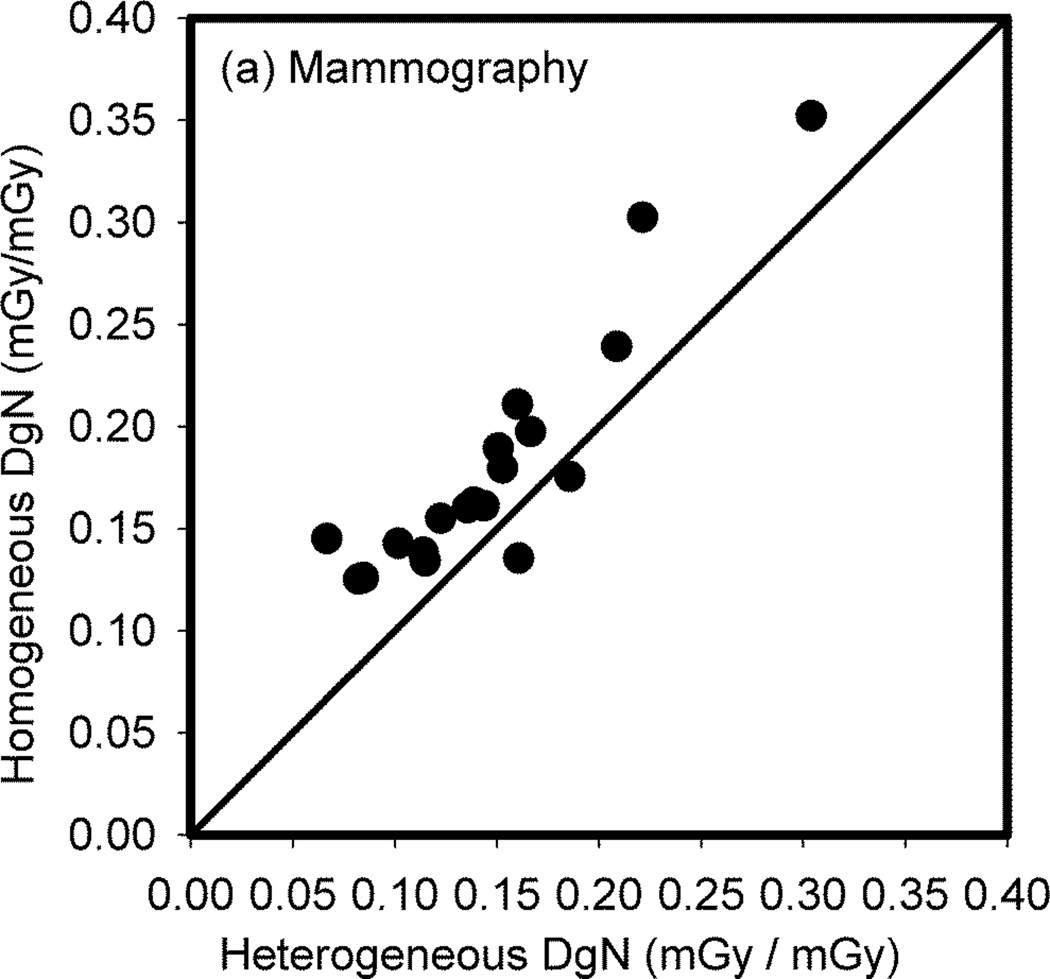
The impact on the estimate of MGD in actual patient breasts when the internal adipose/glandular tissue structure is homogenized was studied by Sechopoulos et al using DBCT images of 19 patient breasts (Sechopoulos et al, 2012). To simulate the acquisition of mammograms, the DBCT images were first automatically classified (Yang et al, 2011) and the mechanical compression as for mammography simulated (Zyganitidis et al, 2007) (figure 12). The resulting compressed breast representations were homogenized maintaining the glandularity of each breast. Finally, Monte Carlo simulations of mammography were performed of both the original (heterogeneous) compressed breast and their homogeneous equivalents, and DgN values obtained in each case. Comparison of the DgN values showed an over-estimation of dose due to homogenization of 27%, with 2 underestimated and 17 overestimated dose values (figure 13). Interestingly, the maximum error in the dose estimate for these 19 cases was 117%, showing that in certain specific cases the homogeneous approximation can introduce large inaccuracies. Of importance, this study with limited number of cases showed that the homogeneous tissue approximation does not result in over-and under-estimations equally and therefore it can be considered not to average out over a large enough sample. In other words, a bias is introduced by the tissue mixture simplification.
Figure 12.
Sagittal slice of one of the DBCT patient images that was classified and compressed to represent a breast with its real patient tissue structure undergoing mammography in the study by Sechopoulos et al (2012). Figure from Sechopoulos et al (2012). Copyright (c) 2012, American Association of Physicists in Medicine (AAPM).
Figure 13.
Scatter plot of the normalized glandular dose coefficients for the actual patient breast glandular tissue structure compared to that resulting when assuming a homogeneous tissue mixture. Figure from Sechopoulos et al (2012). Copyright (c) 2012, American Association of Physicists in Medicine (AAPM).
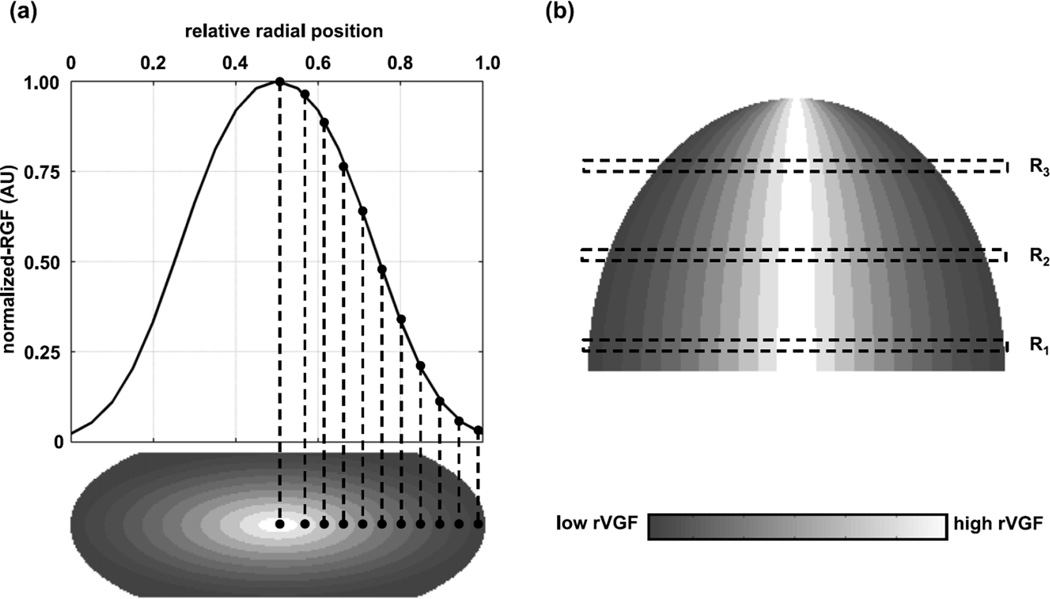
This bias was confirmed by follow-up work by Hernandez et al (2015), in which 219 patient breast CT examinations were used to study this effect. An important difference between this study and that of Sechopoulos et al is that although they were both based on breast CT patient images, Hernandez et al used the patient data to develop a more accurate model of glandular tissue distribution (figure 14) and then used this model to compare to the homogeneous model dose estimates. On the other hand, Sechopoulos et al compared directly the dose to the actual glandular structure of each patient to the corresponding breast (same thickness, shape, skin thickness) but with the homogeneous approximation for the internal tissue. Notably, the work by Hernandez et al determined that the bias introduced due to the homogeneous approximation is about a 30% over-estimation, confirming the value determined previously. It was further found that the mean bias due to the homogeneous approximation depends on the x-ray source target/filter combination (Mo/Mo: mean overestimation of 35.3%; W/Rh: mean overestimation of 24.2%), and that the MGD varied by up to a further 15.6% with slight (10%) variation in the position of the centre of the glandular tissue distribution. This last set of estimates showed once again the sensitivity of the dose estimates to the position of the glandular tissue in the vertical direction.
Figure 14.
Model of the glandular tissue distribution inside a new model of the breast compressed for mammography developed by Hernandez et al (2015) based on analysis of DBCT patient data. This model was used to compare the resulting MGD to that of the homogeneous model estimates. Figure from Hernandez et al (2015). Copyright (c) 2015, American Association of Physicists in Medicine (AAPM). Part (a) of the figure shows at the top the radial glandular fraction (RGF) and at the bottom in shaded form the regional volumetric glandular fraction (rVGF) in a coronal plane through the breast. Part (b) (top) shows in shaded form the rVGF in a transverse section through the breast. The scale used for shading is shown at the bottom of part (b). The reader is referred to the original paper for a detailed explanation of these quantities and how they have been used.
Clearly, new information is available that may allow a refinement of even the simpler dosimetry models so as to arrive at more accurate estimates of patient dose. Although in mammography the vertical position of the glandular tissue in each patient will not be known and therefore this source of uncertainty in a case-by-case basis cannot be eliminated, refining the breast model so that this and all other simplifications and assumptions average out to zero over a large sample size would be desirable.
9. Patient specific dose estimates
If the refinements to the breast model used for breast dosimetry discussed above are performed, it might be possible that a model is achieved in which the average (and spread) of the breast model MGD estimates reflects the average (and spread) of the true patient breast MGD distribution. However, as long as a model of the breast is used in which characteristics such as shape, size, position on the breast support plate, and especially glandular tissue distribution, are standardized, then there will always be inaccuracy introduced into the MGD estimate for each acquisition. Nevertheless, for analysis of the dose distribution for a large series of patients the use of such a model would be appropriate. Invariably however, some MGD estimates will result in large errors. As discussed above, Sechopoulos et al found one case out of only 19 in which an error in MGD of 117% was obtained due to the homogeneous tissue assumption (Sechopoulos et al, 2012). It should be noted that for this case, all other breast and image acquisition parameters were accurate: breast shape, breast thickness, skin thickness, position in the image, and x-ray technique. It seems therefore that to truly achieve accurate patient dosimetry, then the specific characteristics of the breast of each patient would need to be taken into account in the estimation of the MGD.
The introduction of DBT and DBCT provides images that have at least partial tomographic information on the internal structure of the breast. Therefore, with the use of automated tissue classification algorithms (Nelson et al, 2008; Pike et al, 2015; Yang et al, 2012; Qin et al, 2014), and perhaps 3D breast shape scanning capabilities (Agasthya and Sechopoulos, 2015), combined with Monte Carlo methods, it is feasible to obtain patient specific MGD estimates for each DBT and DBCT (and their contrast-enhanced alternatives) acquisition. Of course, given the expected more common widespread use of DBT than DBCT, at least in the foreseeable future, further work needs to be performed on tissue classification algorithms for DBT.
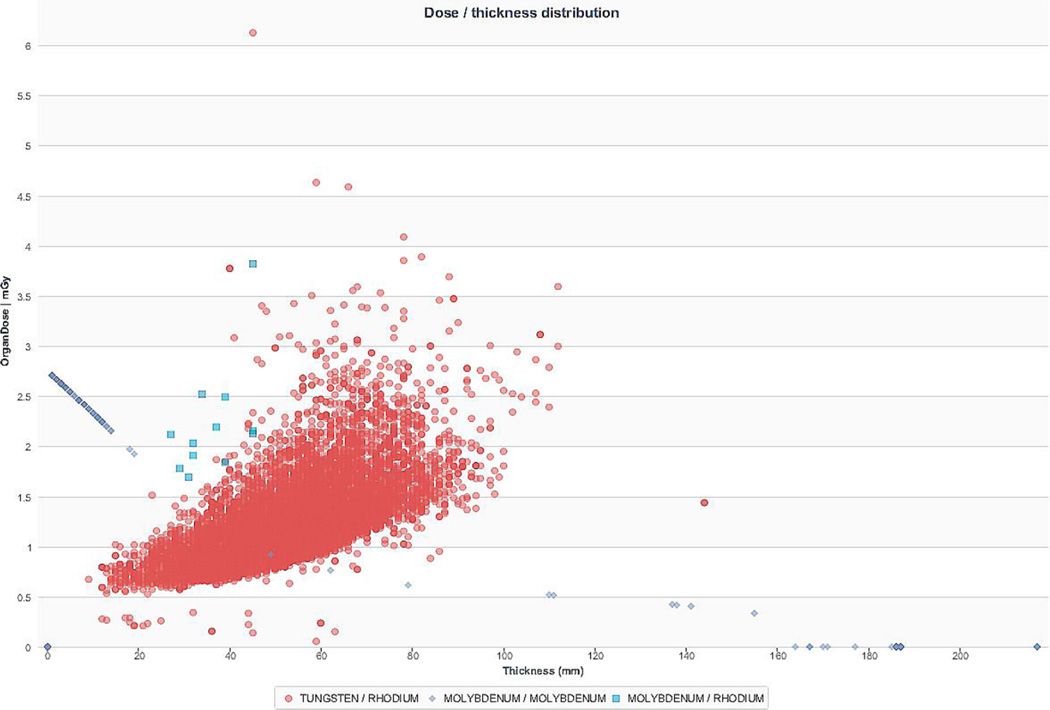
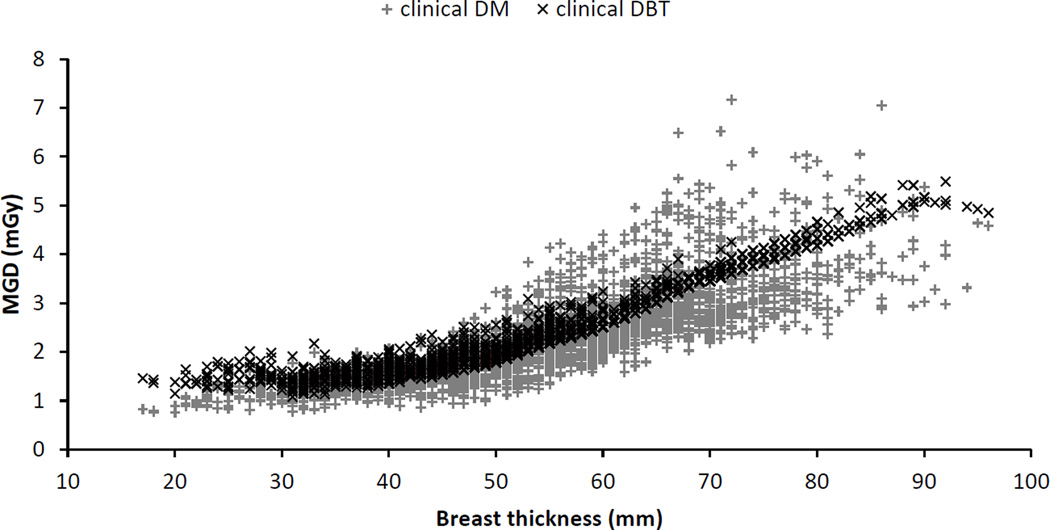
If patient specific breast dosimetry is achieved, it is important however that it is used in the appropriate manner. Obtaining automatically the correct MGD for each breast could be used for the same purpose for which retrospective patient dosimetry evaluations are currently performed, namely, to ensure adequate behaviour of each imaging system. At present, some screening programmes and individual institutions where screening is performed involve the automated capture and monitoring of all MGD estimates resulting from screening mammography (figure 15). These could be powerful tools to ensure the continuing correct behaviour of clinical systems. As can be seen from Figures 15 and 18, MGD values, even for the same compressed breast thickness, vary considerably. The assumptions and simplifications related to the breast model used for dosimetry currently introduce some variance and error in these values which are challenging to determine. If imaging modalities such as DBT or DBCT become common, as DBT is becoming, and especially if DBT is used as a screening technology then this level of monitoring but with patient-specific dose estimates would be feasible.
Figure 15.
Screen capture of mammographic patient dose monitoring using TQM software (Qaelum NV, Leuven, Belgium) at the University of Leuven. Image courtesy of Hilde Bosmans.
Figure 18.
Patient MGD as function of compressed breast thickness for a particular mammography system operating in mammography and DBT modes. Figure based on Bouwman et al (2015a).
10. Breast dosimetry for special situations
10.1 Diagnostic views
Most work performed in breast dosimetry has been focused on the aspects relevant to screening mammography and has thus concentrated on the acquisition of CC and MLO views of the whole breast under compression. Therefore, fewer studies have been reported on dosimetry involving diagnostic views (magnification, spot, etc.). One of the still remaining issues in dosimetry of diagnostic views such as magnification or spot compressions, as in other modalities in which the breast is partially irradiated, is that it is not clear what the right metric to use for breast dose is. If the MGD to the entire breast glandular tissue is calculated for an acquisition in which the field of view does not cover the whole breast, then the MGD value will be quite low, since the energy deposited in the entire breast, which will consist mostly of that in the directly irradiated portion, will be low, while this value will be divided by the total mass of the glandular tissue of the entire breast. Although this would be the equivalent of the total organ dose if the glandular tissue of the breast is considered an “organ”, this value would not necessarily be comparable to the MGD of whole breast images, but it could be estimated using Monte Carlo simulations. An alternative approach to estimating this MGD metric is to weight the MGD calculated for whole breast irradiation by the ratio of the area of the compressed breast exposed to that for whole compressed breast (IPEM, 2005).
A different metric was used by Liu et al (1995), in which only the energy deposited and the glandular tissue present in the directly irradiated volume were considered for the calculation of breast dose. This of course results in higher values of DgN than the previously described metric. In Liu et al’s Monte Carlo calculations, the authors excluded “the energy deposited in the breast tissue outside the primary beam path.” The appropriateness of each of these approaches depends on the application of the dose estimate. For any modality comparison with considerable differences in x-ray energy, for which the scatter characteristics could be different, excluding dose outside the directly exposed volume could introduce a bias. At typical breast imaging energies this inaccuracy is probably too low for concern, but it should nevertheless be estimated.
The Liu et al model for MGD provides DgN tables for two field sizes at the image plane; 90 × 90 mm2 (representing spot magnification) and 140 × 220 mm2 (representing regular magnification). Given the prevalent systems of that era, only the spectra emitted by a Mo/Mo x-ray source were considered. In addition, the breast glandularity was modelled as ranging from 25 to 100%. Later, Koutalonis et al (2006) followed Liu et al’s proposal of including only the energy deposited in the directly irradiated tissue volume to calculate DgN. As opposed to Liu et al, who published new DgN values for magnification mammography, Koutalonis and colleagues added a term, denoted m, to a variation of the Dance model to account for the magnification geometry, and provided values of m for a range of magnifications.
10.2 Breast implants
Becket and Kotre (2000) developed a model of the augmented breast undergoing mammography and used it to determine MGD conversion factors and MGD values for a range of conditions. In their work, the authors developed an estimate of how the breast volume changes after breast augmentation and determined the relationship between compressed breast thickness and breast volume for the augmented breast. They also developed a simple geometric model for the augmented compressed breast in the CC view, which is similar to the semi-cylindrical shape described for the normal breast, but with a smaller semi-cylinder included that represents the breast implant. Becket and Kotre used this model and Monte Carlo methods to obtain g factors for augmented breasts for both silicone and saline implants and for different breast augmentation magnitudes. Using clinical data, the authors compared the resulting estimates of MGD for normal mammograms (n=1258) and varying thickness to those of augmented breast mammograms (n=72), finding that for thinner compressed breasts (<60 mm) the MGD is comparable while for thicker breasts the augmented breasts result in considerably lower MGD. This disparity at large compressed breast thicknesses could be due to the low compressibility of the augmented breast in the portion that actually includes the implant. Therefore, although the breast thickness is recorded as high, the portion of the breast tissue that is actually visible outside the projection of the implant is thinner than the recorded thickness, and therefore lower exposure technique is used. It must be noted that this study is from 2000, and therefore it is screen-film based. With current digital mammography systems and AEC systems based on compressed thickness (in some cases) and a pre-acquisition test exposure, the exposure parameters selected would be very different from those studied by Becket and Kotre, and therefore this comparison of MGD might not be applicable to digital mammography.
11. Dosimetry using physical breast phantoms
For the purposes of breast dosimetry, a breast phantom should be designed so that for the same thickness it approximately simulates the properties of a compressed breast in terms of the number and spectra of the primary and scattered x-rays which leave its lower surface (IAEA, 2007). A phantom so designed can be used as a surrogate for the breast to determine the X-ray spectrum and the tube-current exposure time product which would be selected when the breast is examined under automatic exposure control. The use of specially manufactured breast tissue substitute materials can be considered for phantom construction, but more commonly available (and therefore much cheaper) plastics are often used. Mammographic AEC systems operate in different ways depending upon the manufacturer, but use may be made of the compressed breast thickness, the average signal in a defined region of the image or the signal in the densest region of the image. Ideally, therefore, the phantom thickness should match the breast thickness and the phantom should contain appropriate structure. No such dosimetry phantoms are presently in use.
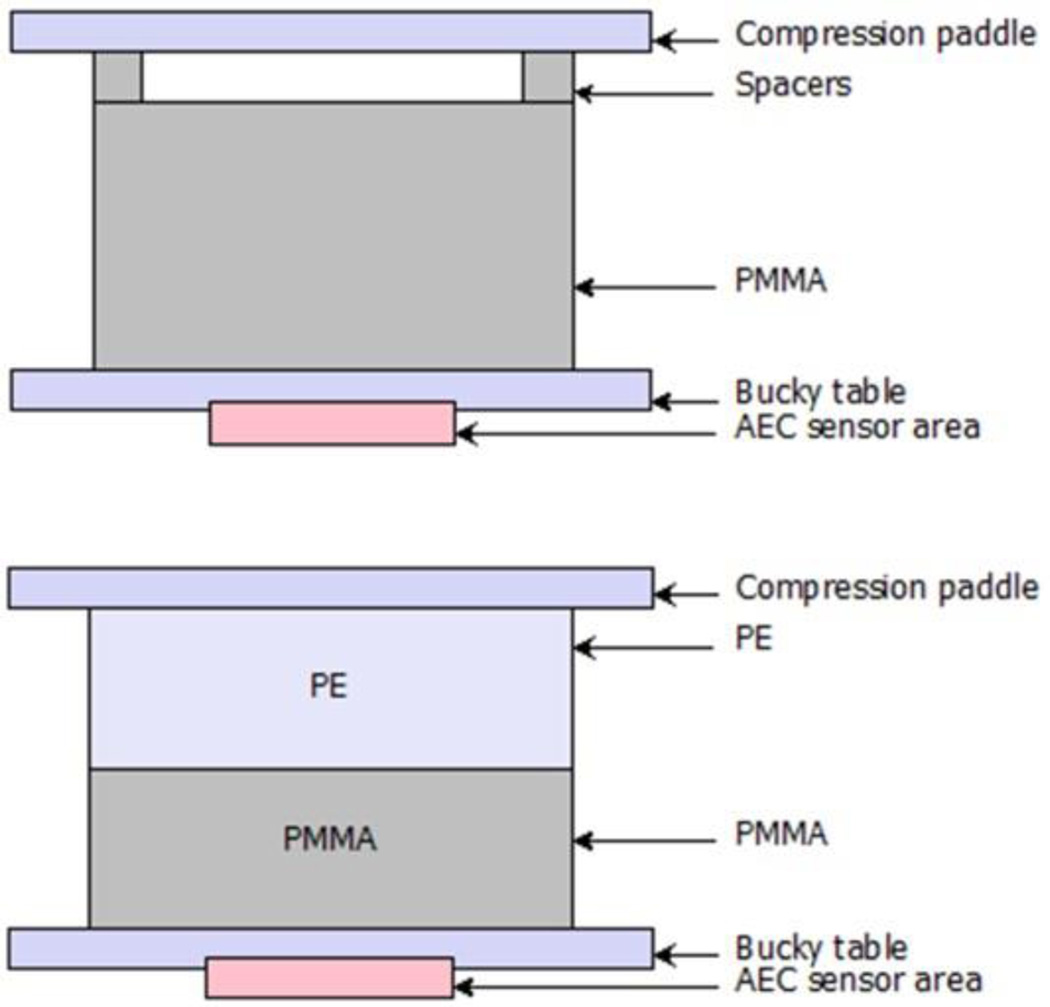
In the European Guidelines for Quality Assurance in Breast Cancer Screening and Diagnosis (EC, 2013) it is recommended that a series of polymethyl methacrylate (PMMA) slabs in the thickness range 20–70 mm are used to simulate breasts in the thickness range 20–90 mm. This follows the work of Dance et al (2000) who used Monte Carlo calculations to determine the thickness of PMMA equivalent to breasts of different thickness for women attending the United Kingdom breast screening programme. Unfortunately, the thickness of PMMA is less than the thickness of the breast which it simulates, which means that additional spacers are required when the phantom is exposed in order to match the breast equivalent thickness. An alternative design of phantom has therefore been suggested by Bouwman et al (2013, 2015a and 2015b) which uses combinations of slabs of PMMA and polyethylene (PE) so that the breast thickness is exactly matched (figure 16 and tables 1 and 2).
Figure 16.
Diagrams of the (top) standard PMMA phantom and the (bottom) PMMA/PE phantom proposed by Bouwman et al to represent patient breasts. Tables 1 and 2 list the values of their equivalent thickness and glandularity. Figure from Bouwman et al (2015a).
Table 1.
PMMA slab thickness and equivalent standard model breast thickness and glandularity they represent in the age group 50–64. Data from Dance et al (2000).
| PMMA slab [mm] | Standard model breast thickness [mm] |
Standard model breast glandularity [%] |
|---|---|---|
| 20 | 21 | 97 |
| 30 | 32 | 67 |
| 40 | 45 | 40 |
| 45 | 53 | 29 |
| 50 | 60 | 20 |
| 60 | 75 | 9 |
| 70 | 90 | 4 |
Table 2.
PMMA + PE slab thicknesses and equivalent standard model breast thickness and glandularity they represent in the age group 50–64. Data from Bouwman et al (2015a).
| PMMA slab [mm] | PE slab [mm] | Standard model breast thickness [mm] |
Standard model breast glandularity [%] |
|---|---|---|---|
| 20 | 0 | 20 | 100 |
| 27.5 | 2.5 | 30 | 72 |
| 30 | 10 | 40 | 50 |
| 32.5 | 17.5 | 50 | 33 |
| 32.5 | 27.5 | 60 | 21 |
| 32.5 | 37.5 | 70 | 12 |
| 32.5 | 47.5 | 80 | 7 |
Because the composition of the PMMA and PMMA/PE phantoms does not exactly match that of the typical breasts being simulated, such phantoms cannot provide an equally good match for all X-ray spectra that may be used for the mammographic examination. This is particularly important for DBT, which is generally performed without a grid, so that the contribution of scattered radiation to the image will be substantial. Moreover, the value of the scatter-to-primary ratio will vary with projection angle (Sechopoulos et al., 2007b) and at least in principle with the design of the image receptor. Using Monte Carlo based simulations, Bouwman et al (2013) found that when PMMA/PE phantoms are designed to work for both projection imaging (with an anti-scatter grid) and DBT (without an anti-scatter grid) and for a range of X-ray spectra, the deviation in energy absorbed per unit area of the detector when this is compared to that absorbed for the breast being modelled can be as much as 10%. This was considered acceptable for QC purposes where a standard and reproducible methodology is required. In this context it is important to note that for QC, the phantom does not have to simulate the average breast, only a typical breast, and even then, an exact simulation is not necessary.
In the USA, the American College of Radiology (ACR) approach uses the ACR accreditation phantom, which is 45 mm thick, constructed from tissue equivalent materials so as to resemble a 42 mm thick, 50% glandularity breast, and includes test details used to assess image quality (ACR, 1999). Although this phantom was developed for QC testing of screen-film mammography, its use for QC testing of digital mammography units has continued. The ACR is currently preparing a new QC manual (see Section 12) which includes a new ACR accreditation phantom for digital mammography which, as with the current one, will also be used for the dosimetry test included in the QC protocol.
12 National and International protocols
Breast dosimetry is included in all national protocols for the quality assurance or quality control of mammography as well as in the international protocols of the European Guidelines (EC, 2013) and the IAEA (2006). It is important to note however, the variety of protocols and data sources used. In their survey of diagnostic reference levels for mammography Suleiman et al (2015) identified publications from 11 countries that used conversion coefficients taken from the work of Dance and colleagues (section 5.1) and 7 that used the conversion coefficients of Wu et al or Boone et al (section 5.2). For the actual measurement protocols themselves there was variation between ACR (1999), IPEM (2005), European and IAEA protocols, although the latter three are quite similar. It should be noted that in the USA, the ACR Quality Control Manual only applies to screen-film mammography, which in essence is now retired in that country. As noted in Section 11, the ACR is preparing a new QC manual for digital mammography which at the time of writing is undergoing an approval process but in the meanwhile each manufacturer of digital mammography systems is required to develop its own QC manual.
For measurements using phantoms there are important differences between these protocols. The ACR approach uses the ACR accreditation phantom described above. The other protocols use PMMA slabs which can have either a standard thickness, or measurements may be made for a series of thicknesses. The method of measuring the incident air kerma is also different. The distance of the dosimeter from the chest wall is important because of the heel effect, and the distance specified is not standard across protocols, varying between 40 and 60 mm. In the current ACR protocol, the incident air kerma is calculated from measurements with a dosimeter placed at the side of the phantom and in contact with the compression paddle whereas in the other protocols it is calculated from measurements of tube output and the tube current - exposure time product for exposure of the phantom. Some of the latter protocols do not identify where the output measurements should be made in relation to the compression paddle, but in the latest version of the European protocol (EC, 2013) it is made clear that the measurement should be made with the dosimeter in contact with the paddle.
For the ACR protocol, the work of Wu et al (1994) was adapted for the tables to convert incident exposure to MGD. These tables are used to estimate the MGD to an “average” breast, which is represented by the ACR accreditation phantom, and the MGD estimated using the measured exposure as described above is required to be below 3 mGy.
DBT is a much newer modality then 2D mammography, but two protocols are available. The first, produced by the AAPM (Sechopoulos et al, 2014), is based on the conversion factors of Sechopoulos et al (2007a, 2008), and the second European-based draft-protocol (van Engen et al, 2015) uses the conversion factors of Dance et al (2011). There are important differences between the two protocols as they use very different positions of the dosimeter for the measurements of air kerma.
There are no well-established dosimetry protocols for breast CT. This is a modality that is not yet widely used.
It will be clear from this discussion that although there exist well-established and well used protocols for dosimetry of mammography, they differ in many details, and care must be taken when comparing results using them. Similarly there will be differences in dose assessments made using the AAPM and European protocols for DBT.
13. Results of breast dose measurement
There is a large literature giving values of breast dose assessed from patient surveys and phantom based measurements. Values of the dose depend upon many factors and even for a given system change with time as manufacturers or users alter the operating conditions for the equipment. In this review we therefore restrict ourselves to some illustrative examples and to a comparison of patient-based and phantom-based assessments. We do not discuss diagnostic reference levels for which a review has recently been published by Suleiman et al (2015).
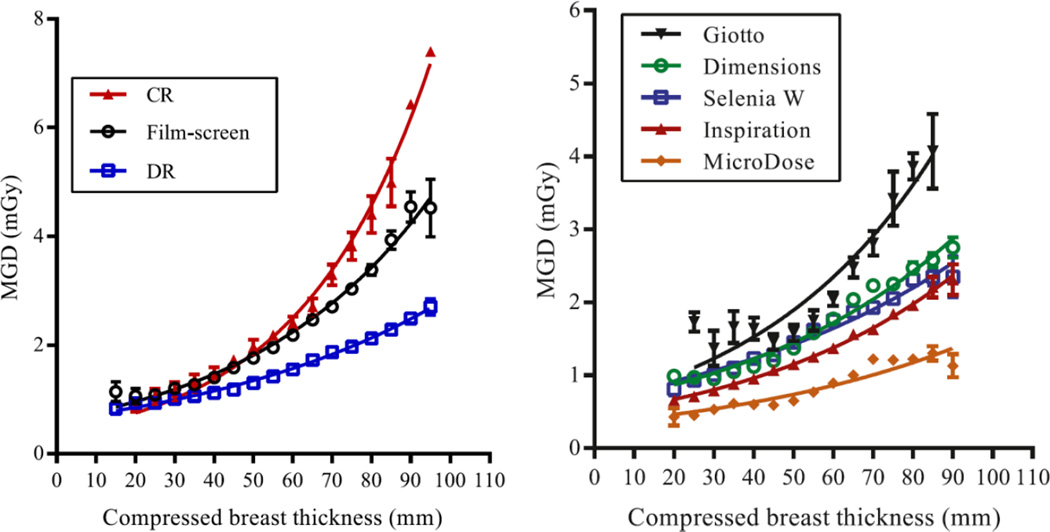
Figure 17 shows the variation of the MGD for standard mammography with breast thickness based on a large United Kingdom survey of data from 419 X-ray sets over the period 2010–2012 (Young and Oduko, 2016). The data illustrate well the decrease in dose when changing from screen-film to DR systems, and that the dose for the CR systems included in the survey was higher than that for screen-film. The average values of the MGD in the MLO projection for all DR, screen-film and CR systems in the survey were 1.58 mGy (278 systems), 2.11 mGy (160 systems) and 2.52 mGy (9 systems), respectively. These MGD values and the differences between them become larger with increasing compressed breast thickness. For the same three types of system the average doses for 90 mm thick compressed breasts were 2.46 mGy, 4.59 mGy and 6.34 mGy respectively. There was a large variation among the values of the MGD for different manufacturers’ DR systems. This is also illustrated in figure 17.
Figure 17.
MGD variation with breast thickness for (left) CR, screen-film and DR systems and (right) five different DR systems. Republished by permission of British Institute of Radiology, from Young and Oduko (2016).
The data in figure 17 are averages taken over all breasts of a given thickness. However, for a given X-ray spectrum and breast thickness there will be considerable variation arising from differences in glandularity and AEC selected operating parameters. This is illustrated in figure 18 for a particular mammography system with both 2D and DBT imaging capability. The wider spread in doses for the 2D mode suggests that AEC system for that mode allows better tuning to the particular breast being imaged than for the DBT mode. In this particular example, the dose for DBT is similar to that for the 2D mode, but it is not possible to generalise this result. The actual doses for the two modes will depend upon choices made by the manufacturer and user, and both may change with time as the equipment technology and user experience and requirements develop.
The large variation in dose for a given breast thickness shown in figure 18 is, as noted above, due to both differences in breast glandularity and the fact that AEC systems can now take account of variations in signal over the image, for example some systems can ensure that the signal-to-noise ratio in a dense area of the image is sufficiently high. As a consequence it can be expected that breast phantoms which produce a homogeneous image will not necessarily give the same value of the MGD as that for a patient series at the same breast thickness. Any such differences may in fact be increased by any compromises necessary in the original design of the phantom designed to work well for a range of spectra and, possibly, for both mammography and DBT modalities. Such differences have been studied for PMMA phantoms and mammography by Kelaranta et al (2014) and for PMMA and PMMA/PE phantoms for mammography and DBT imaging by Bouwman et al (2015a). Table 3 gives average values of the ratio of the patient to phantom MGD for five systems with mammography and DBT capability taken from Bouwman et al. The ratios are given separately for PMMA and PMMA/PE phantoms and it would appear that given the above mentioned limitation of the phantom-based approach, quite good agreement has been achieved. However, as Kelaranta et al point out, a single homogeneous phantom of a given thickness cannot be used to study the variation of MGD at a given breast thickness due to variations in the exposure parameters selected by the AEC for different breasts of the same thickness. It also follows from the differences in the ratios shown in table 3 that comparisons of patient MGD values should not be based on comparisons of phantom-based MGD values. This is true both when comparing different systems for the same modality and when comparing mammography and DBT modalities (Bouwman et al 2015a). Although the existing phantoms are perfectly adequate for QC purposes, it is clear that there remains a need for an improved design of phantoms or phantoms which facilitate the study and simulation of the range of exposure parameters which occur in practice for breasts of a given thickness.
Table 3.
Summary of the mean ratios of the patient to phantom MGD for each system in mammography and DBT imaging modes and both dosimetry phantoms. The value in brackets behind the mean ratio is the standard deviation of the given ratio. Based on Bouwman et al (2015a).
| Mammography | DBT | ||||
|---|---|---|---|---|---|
| Mean ratio: | PMMA (SD) |
PMMA+PE (SD) |
Mean ratio: | PMMA (SD) |
PMMA+PE (SD) |
| System I | 1.47 (0.41) | 1.46 (0.40) | System I | 1.07 (0.19) | 1.04 (0.17) |
| System II | 1.04 (0.20) | 1.02 (0.18) | System II | 0.89 (0.20) | 0.89 (0.17) |
| System III | 0.98 (0.27) | 1.03 (0.28) | System III | 0.97 (0.39) | 1.01 (0.40) |
| System IV | 1.13 (0.31) | 1.07 (0.27) | System IV (a) | 1.12 (0.17) | 1.04 (0.16) |
| System IV (b) | 1.06 (0.24) | 0.98 (0.20) | |||
| System V | 1.07 (0.27) | 1.15 (0.29) | System V | 0.86 (0.24) | 1.14 (0.21) |
| Overall: | 1.14 | 1.15 | Overall: | 1.00 | 1.02 |
Since DBCT is a much younger technology, and there is only one commercial system currently approved for clinical use, there are a lot less data on patient dose for DBCT acquisitions, and these data is based on lower number of patients. For groups focused on DBCT development for screening, the patient dose values are set prior to imaging to match those of 2-view mammography, using previously published data, as mentioned earlier (Boone et al., 2005). However, for other groups that are investigating the use of this technology for other clinical applications, such as diagnostic work-up or staging, understanding the resulting patient dose is a retrospective and important exercise. One comprehensive evaluation of patient dose from DBCT for diagnosis has been published that estimated both the breast dose from DBCT and compared it to estimates of the breast dose from all the mammographic diagnostic work-up views acquired for the same patients (Vedantham et al., 2013). Table 4 shows a comparison from that study of the DBCT dose to the mammographic work-up dose. For the DBCT dose, the glandularity of the breast was estimated from the image itself and the DgNCT values were based on those of Sechopoulos et al (2010). For the mammographic MGD estimates, Vedantham et al used the MGD from the DICOM header, which assumes a 50% glandularity, and also estimated the MGD assuming a 15% glandularity, the median glandularity found from DBCT. In this table we include only the 15% glandularity-based values. As can be seen, the MGD from a single DBCT acquisition is comparable to the total MGD for diagnostic work-up, with a similar mean value and a narrower range of values.
Table 4.
Comparison of MGD values from DBCT and from all mammograms acquired for diagnostic work-up, based on 133 breasts from 132 patients. Data from Vedantham et al (2013).
| Diagnostic Mammography | DBCT | ||
|---|---|---|---|
| Number of views |
MGD [mGy] |
MGD [mGy] |
|
| Mean | 4.53 | 12.4 | 13.9 |
| Standard Deviation | 1.83 | 6.3 | 4.6 |
| Minimum | 1 | 2.6 | 5.7 |
| Median | 4 | 11.1 | 12.6 |
| Maximum | 11 | 34.2 | 27.8 |
14. Alternative methods of dose measurement
Standard breast dosimetry methods for mammography, DBT and DBCT involve the calculation of the incident air kerma using ion chamber- or solid state-based dosimeters measurements before or after actual image acquisition. Some investigators, however, have proposed that the incident air kerma could be measured in real time or in vivo with dosimeters placed in the field of view during each breast image acquisition. For this measurement, there have been studies using dosimeters based on metal oxide semiconductor field effect transistors (MOSFET) (Dong et al, 2002; Benevides and Hintenlang, 2006; Cavagnetto et al., 2013), thermoluminescence (TLD) (Bastos et al., 2011), radioluminescence (RL) (Benevides et al, 2007), and both RL and optically stimulated luminescence (OSL) (Aznar et al, 2005). In general, these studies have shown that the use of these different technologies is feasible for the measurement of air kerma during each acquisition, reaching, in most cases, a good level of agreement with ion chamber dosimeter measurements. However, given the stability of tube output generally seen in current mammography systems, the need for real time monitoring of incident air kerma is not clear.
Studies have also been performed for internal dosimetry within breast phantoms. The use of small TLD chips has been reported to characterize not only entrance dose (López-Pineda et al, 2014) but also percentage depth dose (PDD) and its variation with spectral characteristics (Sharma et al, 2012; Camargo-Mendoza et al, 2011). TLD dosimetry has also been used to study the internal dose distribution in breast phantoms in DBCT (Russo et al., 2010). Di Maria et al (2011) compared the MGD estimates from Monte Carlo simulations, using MCNPX and Penelope, and Wu et al’s tables to measurements using TLDs and breast phantoms. Agreement within 15% was found between the computational results and the TLD measurements. Given the difficulties and inherent uncertainties in this type of measurement and the necessary assumptions and simplifications in the computer simulations, this level of agreement is considered very good.
Experimental measurements of breast dosimetry have also been performed using radiochromic film. Soliman and Bakkari (2015) found that radiochromic film was not sensitive enough to measure entrance skin dose in mammography. However, radiochromic film has been used to characterize the dose distribution inside phantoms in contrast enhanced digital mammography (Hwang et al., 2014) and in DBCT (Russo et al., 2010; Crotty et al., 2010; Crotty et al., 2011).
15. Discussion and future work
In this paper we have reviewed the development of methods of breast dosimetry for mammography, DBT and DBCT whilst also discussing the data which are available for modelling the female breast. We have considered the implementation of these methods in national protocols giving illustrative examples of the breast dose for some modalities. It is clear that the methodologies used have developed considerably during the time period considered, but further work is still required to improve the modelling and dose estimation processes.
The IAEA has stated in report TRS 457 (IAEA, 2007) that for the absolute estimation of the stochastic risk arising from the use of x-rays in diagnostic radiology, an accuracy of 20% at the 95% confidence level is appropriate for the uncertainty in the estimation of dose. For the comparative estimation of risk (i.e. for dose comparisons and for system optimisation) they state that an accuracy of 7% (again at the 95% confidence level) is appropriate. They also suggest that an accuracy of 7% is appropriate for quality assurance purposes. For breast imaging with X-rays these levels of uncertainty can be achieved for the measurement of air kerma, but there are systematic errors associated with the computational models used for the calculation of the conversion factors which relate air kerma to MGD. For dose comparisons, optimisations and quality assurance/quality control, these systematic errors may not be important provided they are not too large and are similar for the conditions being compared or monitored. There are various sources of these systematic errors. Firstly there is uncertainty in the composition and density of the tissues within the breast, which are based on just a few samples measured by Hammerstein et al in 1979. Various measurements of the attenuation offered by breast tissues are available in the literature for limited sample sets, but there are inconsistencies, and further measurements of these very basic properties of breast tissue are desirable. Secondly, and more importantly, very simple models of the breast have been used for the two most widely-used compilations of MGD conversion coefficients, and these models only represent the acquisition of the CC view. Further, because the two compilations are based on different breast models and follow different protocols for the measurement of incident air kerma, the resulting values of the MGD should not be directly compared. Nevertheless, it should be noted that each approach has been very successful as a tool to compare, control or optimise the doses from different equipment, centres and countries (through the use of national and international protocols).
Notwithstanding the practical success of the simple breast models and associated protocols, recent work using model breasts derived from patient DBCT examinations has shown that on average the use of the simple breast models overestimates the breast dose by about 30 % (Sechopoulos et al, 2012; Hernandez et al, 2015). Two conclusions follow from this. Firstly, it is desirable that the presently used MGD conversion factors are replaced with factors which give on average the correct average population breast dose. New breast models will need to be agreed and developed for this purpose. Secondly, and in parallel with this, it is suggested that a new breast dosimetry protocol be developed, which uses the new factors. Finally, the new protocol should be promoted so that it is adopted and used world-wide, thus avoiding the confusion which presently arises because of the use of different protocols.
Using realistic breast models derived from DBCT, Sechopoulos et al (2012) found that the standard homogeneous tissue assumption could give rise to an individual breast dose error of almost 120%. The concept of patient specific dosimetry was therefore introduced in Section 9. It is demonstrated there that patient specific dosimetry might in the future be possible for DBT and for DBCT. This would allow the collection of series of individualised breast doses which might be used for quality control in the same way as present model-based patient dose estimates.
The use of simple phantoms which are used to simulate the breast in order to obtain the exposure parameters needed for the calculation of MGD has also been reviewed. Such phantoms do not need to simulate an average breast but should be sufficiently representative that the exposures obtained fall within the normal range for the particular breast thickness being simulated. The design of such phantoms is a challenge as they must provide a good simulation over a range of beam qualities, and perhaps also for both mammography and DBT. Various phantom designs are routinely used. However, because of the increasing sophistication of AEC systems which may take into account the signal and or noise values in a region of interest in a pre-exposure, the exposure parameters selected may not be close to those for a typical breast of the same thickness, and any differences may be equipment dependent. There is thus a need for an improved phantom design, with some added complexity. If the constraint of low cost is added, this may be difficult to achieve.
Given the above mentioned issues and limitations of the current breast dosimetry methods, the American Association of Physicists in Medicine and the European Federation of Medical Physics have formed a joint workgroup to develop a new methodology to estimate breast dose. This model will address both prospective (phantom) and retrospective (patient) dosimetry for mammography, DBT, and other imaging techniques, such as CEDM.
Finally, although there is continuing and justified interest in the dosimetry of diagnostic examinations of the breast using x-rays, it is important to point out that the risk for an individual breast exposure is small. As stated in the introduction, for we estimate that the lifetime risk of radiation induced breast cancer per mGy for a 50 year old woman receiving a dose of 3mGy to each breast is 3 in 100,000. There is good evidence that for the same X-ray spectrum, the detection of breast calcification decreases with decreasing dose (for example, Warren et al, 2012) and it is important to ensure in any optimisation programme that sufficient clinical image quality is achieved and maintained. A comprehensive, accurate understanding of the dose involved in breast imaging, especially in screening, is important, but achieving and maintaining the necessary image quality for clinical performance should drive protocol design decisions.
Acknowledgments
DRD is supported by Cancer Research UK (grant number: C30682/A17321, the OPTIMAM2 project).The work by the group of IS discussed here has been supported by the Georgia Cancer Coalition, the Susan G. Komen Foundation (IIR13262248), and the National Cancer Institute (R01CA181171, R01CA163746, P50CA128301). The content is solely the responsibility of the authors and does not necessarily represent the official views of these institutions.
Footnotes
In the work by Wu et al, the DgN values were published normalized by exposure, not air kerma. Here we denote it as incident air kerma to be consistent with currently recommended nomenclature and units.
References
- Agasthya G, Sechopoulos I. TU-CD-207-09: Analysis of the 3-D Shape of Patients’ Breast for Breast Imaging and Surgery Planning. Med. Phys. 2015;42:3612. [Google Scholar]
- Alm Carlsson G, Dance DR. Breast absorbed doses in mammography: evaluation of experimental and theoretical approaches. Radiat. Prot. Dosimetry. 1992;43:197–200. [Google Scholar]
- Quality Control Manual - Mammography. Reston, VA: American College of Radiology; 1999. American College of Radiology (ACR) [Google Scholar]
- Aznar MC, Hemdal B, Medin J, Marckmann CJ, Andersen CE, Bøtter-Jensen L, Andersson I, Mattsson S. In vivo absorbed dose measurements in mammography using a new real-time luminescence technique. Br. J. Radiol. 2005;78:328–334. doi: 10.1259/bjr/22554286. [DOI] [PubMed] [Google Scholar]
- Bastos FC, Castro WJ, Squair PL, Nogueira MS, Da Silva TA. Feasibility of calibrating thermoluminescent dosimeters in a mammography unit for patient dosimetry. Radiation Measurements. 2011;46:2094–2096. [Google Scholar]
- Beckett JR, Kotre CJ. Estimation of mean glandular dose for mammography of augmented breasts. Phys. Med. Biol. 2000;45:3241–3252. doi: 10.1088/0031-9155/45/11/309. [DOI] [PubMed] [Google Scholar]
- Benevides LA, Hintenlang DE. Characterization of metal oxide semiconductor field effect transistor dosimeters for application in clinical mammography. Med. Phys. 2006;33:514–520. doi: 10.1118/1.2150779. [DOI] [PubMed] [Google Scholar]
- Benevides LA, Huston AL, Justus BL, Falkenstein P, Brateman LF, Hintenlang DE. Characterization of a fiber-optic-coupled radioluminescent detector for application in the mammography energy range. Med. Phys. 2007;34:2220–2227. doi: 10.1118/1.2736788. [DOI] [PubMed] [Google Scholar]
- BENT. Breast exposure: nationwide trends. A mammographic quality assurance programme. Rockville, MD: U.S. Department of Health, Education and Welfare, Bureau of Radiological Health; 1978. [Google Scholar]
- Boag JW, Stacey AJ, Davis R. Radiation exposure to the patient in Xeroradiography. Br. J. Radiol. 1976;49:253–261. doi: 10.1259/0007-1285-49-579-253. [DOI] [PubMed] [Google Scholar]
- Boone JM. Glandular breast dose for monoenergetic and high-energy x-ray beams: Monte Carlo assessment. Radiology. 1999;213:23–37. doi: 10.1148/radiology.213.1.r99oc3923. [DOI] [PubMed] [Google Scholar]
- Boone JM. Normalized glandular dose (DgN) coefficients for arbitrary x-ray spectra in mammography: Computer-fit values of Monte Carlo derived data. Med. Phys. 2002;29:869–875. doi: 10.1118/1.1472499. [DOI] [PubMed] [Google Scholar]
- Boone JM, Lindfors KK, Cooper VN, 3rd, Seibert JA. Scatter/primary in mammography: Comprehensive results. Med. Phys. 2000;27:2408–2416. doi: 10.1118/1.1312812. [DOI] [PubMed] [Google Scholar]
- Boone JM, Nelson TR, Lindfors KK, Seibert JA. Dedicated breast CT: Radiation dose and image quality evaluation. Radiology. 2001;221:657–667. doi: 10.1148/radiol.2213010334. [DOI] [PubMed] [Google Scholar]
- Boone JM, Shah N, Nelson TR. A comprehensive analysis of DgN(CT) coefficients for pendant-geometry cone-beam breast computed tomography. Med. Phys. 2004;31:226–235. doi: 10.1118/1.1636571. http://dx.doi.org/10.1118/1.1636571. [DOI] [PubMed] [Google Scholar]
- Boone JM, Kwan ALC, Seibert JA, Shah N, Lindfors KK, Nelson TR. Technique factors and their relationship to radiation dose in pendant geometry breast CT. Med. Phys. 2005;32:3767–3776. doi: 10.1118/1.2128126. [DOI] [PubMed] [Google Scholar]
- Bouwman RW, Diaz O, van Engen RE, Young KC, den Heeten GJ, Broeders MJM, Veldkamp WJH, Dance DR. Phantoms for quality control procedures in digital breast tomosynthesis: dose assessment. Phys. Med. Biol. 2013;58:4423–4438. doi: 10.1088/0031-9155/58/13/4423. [DOI] [PubMed] [Google Scholar]
- Bouwman RW, van Engen RE, Young KC, den Heeten GJ, Broeders MJM, Schopphoven S, Jeukens CRLNPN, Veldkamp WJH, Dance DR. Average glandular dose in digital mammography and digital breast tomosynthesis: comparison of phantom and patient data. Phys. Med. Biol. 2015a;60:7893–7907. doi: 10.1088/0031-9155/60/20/7893. http://dx.doi.org/10.1088/0031-9155/60/20/7893. [DOI] [PubMed] [Google Scholar]
- Bouwman RW, van Engen RE, Young KC, Veldkamp WJH, Dance DR. Dose assessment in contrast enhanced digital mammography using simple phantoms simulating standard model breasts. Phys. Med. Biol. 2015b;60:N1–N7. doi: 10.1088/0031-9155/60/1/N1. [DOI] [PubMed] [Google Scholar]
- Camargo-Mendoza RE, Poletti ME, Costa AM, Caldas LVE. Measurement of some dosimetric parameters for two mammography systems using thermoluminescent dosimetry. Radiation Measurements. 2011;46:2086–2089. [Google Scholar]
- Cavagnetto F, Taccini G, Rosasco R, Bampi R, Calabrese M, Tagliafico A. ‘In vivo’ average glandular dose evaluation: one-to-one comparison between digital breast tomosynthesis and full-field digital mammography. Radiat. Prot. Dosimetry. 2013;157:53–61. doi: 10.1093/rpd/nct120. [DOI] [PubMed] [Google Scholar]
- Chen RC, Longo R, Rigon L, Zanconati F, De Pellegrin A, Arfelli F, Dreossi D, Menk RH, Vallazza E, Xiao TQ, Castelli E. Measurement of the linear attenuation coefficients of breast tissues by synchrotron radiation computed tomography. Phys. Med. Biol. 2010;55:4993–5005. doi: 10.1088/0031-9155/55/17/008. [DOI] [PubMed] [Google Scholar]
- Crotty DJ, Brady SL, Jackson DVC, Toncheva GI, Anderson CE, Yoshizumi TT, Tornai MP. Investigating the dose distribution in the uncompressed breast with a dedicated CT mammotomography system. Proc. SPIE. 2010;7622:762229–762312. [Google Scholar]
- Crotty DJ, Brady SL, Jackson DVC, Toncheva GI, Anderson CE, Yoshizumi TT, Tornai MP. Evaluation of the absorbed dose to the breast using radiochromic film in a dedicated CT mammotomography system employing a quasi-monochromatic x-ray beam. Med. Phys. 2011;38:3232–3245. doi: 10.1118/1.3574875. [DOI] [PMC free article] [PubMed] [Google Scholar]
- Dance DR. The Monte Carlo calculation of integral radiation dose in Xeromammography. Phys. Med. Biol. 1980;25:25–37. doi: 10.1088/0031-9155/25/1/003. [DOI] [PubMed] [Google Scholar]
- Dance DR. Monte Carlo calculation of conversion factors for the estimation of mean glandular breast dose. Phys. Med. Biol. 1990;35:1211–1219. doi: 10.1088/0031-9155/35/9/002. [DOI] [PubMed] [Google Scholar]
- Dance DR, Skinner CL, Young KC, Beckett JR, Kotre CJ. Additional factors for the estimation of mean glandular breast dose using the UK mammography dosimetry protocol. Phys. Med. Biol. 2000;45:3225–3240. doi: 10.1088/0031-9155/45/11/308. http://dx.doi.org/10.1088/0031-9155/45/11/308. [DOI] [PubMed] [Google Scholar]
- Dance DR, Hunt RA, Bakic PR, Maidment ADA, Sandborg M, Ullman G, Alm Carlsson G. Breast dosimetry using high-resolution voxel phantoms. Radiat. Prot. Dosimetry. 2005;114:359–363. doi: 10.1093/rpd/nch510. [DOI] [PubMed] [Google Scholar]
- Dance DR, Young KC, van Engen RE. Further factors for the estimation of mean glandular dose using the United Kingdom, European and IAEA breast dosimetry protocols. Phys. Med. Biol. 2009;54:4361–4372. doi: 10.1088/0031-9155/54/14/002. [DOI] [PubMed] [Google Scholar]
- Dance DR, Young KC, van Engen RE. Estimation of mean glandular dose for breast tomosynthesis: factors for use with the UK, European and IAEA breast dosimetry protocols. Phys. Med. Biol. 2011;56:453–471. doi: 10.1088/0031-9155/56/2/011. http://dx.doi.org/10.1088/0031-9155/56/2/011. [DOI] [PubMed] [Google Scholar]
- Dance DR, Young KC. Estimation of mean glandular dose for contrast enhanced digital mammography: factors for use with the UK, European and IAEA breast dosimetry protocols. Phys. Med. Biol. 2014;59:2127–2137. doi: 10.1088/0031-9155/59/9/2127. [DOI] [PubMed] [Google Scholar]
- Di Maria S, Barros S, Bento J, Teles P, Figueira C, Pereira M, Vaz P, Paulo G. TLD measurements and Monte Carlo simulations for glandular dose and scatter fraction assessment in mammography: A comparative study. Radiation Measurements. 2011;46:1103–1108. [Google Scholar]
- Dong SL, Chu TC, Lee JS, Lan GY, Wu TH, Yeh YH, Hwang JJ. Estimation of mean-glandular dose from monitoring breast entrance skin air kerma using a high sensitivity metal oxide semiconductor field effect transistor (MOSFET) dosimeter system in mammography. Appl. Radiat. Isot. 2002;57:791–799. doi: 10.1016/s0969-8043(02)00172-0. [DOI] [PubMed] [Google Scholar]
- European Commission (EC) European Guidelines for Quality Assurance in Breast Cancer Screening and Diagnosis 4th Edition Supplements. Luxembourg: Office for Official Publications of the European Communities; 2013. [Google Scholar]
- Fitzgerald M, White DR, White E, Young J. Mammographic practice and dosimetry in Britain. Br. J. Radiol. 1981;54:212–220. doi: 10.1259/0007-1285-54-639-212. [DOI] [PubMed] [Google Scholar]
- Fredenberg E, Berggren K, Dance DR, Young KC, Cederström B, Johansson H, Lundqvist M, Moa E, Erhard K, Homan H, Willsher P, Kilburn-Toppin F, Wallis M. X-ray attenuation of normal and cancerous breast tissue measured with photon-counting spectral imaging. Radiological Society of North America 2015 Scientific Assembly and Annual Meeting. Paper SSA 20-07; Chicago IL. 2015. RSNA 2015. [Google Scholar]
- Geeraert N, Klausz R, Muller S, Bloch I, Bosmans H. Evaluation of exposure in mammog-raphy: limitations of average glandular dose and proposal of a new quantity. Radiat. Prot. Dosimetry. 2015;165:342–345. doi: 10.1093/rpd/ncv069. [DOI] [PubMed] [Google Scholar]
- Hammerstein GR, Miller DW, White DR, Masterson ME, Woodard HQ, Laughlin JS. Absorbed radiation dose in mammography. Radiology. 1979;130:485–491. doi: 10.1148/130.2.485. [DOI] [PubMed] [Google Scholar]
- Hernandez AM, Seibert JA, Boone JM. Breast dose in mammography is about 30% lower when realistic heterogeneous glandular distributions are considered. Med. Phys. 2015;42:6337–6348. doi: 10.1118/1.4931966. http://dx.doi.org/10.1118/1.4931966. [DOI] [PMC free article] [PubMed] [Google Scholar]
- Hemdal B. Forward-scattered radiation from the compression paddle should be considered in glandular dose estimations. Radiat. Prot. Dosimetry. 2011;147:196–201. doi: 10.1093/rpd/ncr292. [DOI] [PubMed] [Google Scholar]
- Highnam R, Brady SM, Yaffe MJ, Karssemeijer N, Harvey J. Robust breast composition measurement - Volpara™. Proc. 10th Int. Workshop on Digital Mammography. 2010:342–349. [Google Scholar]
- Huang S-Y, Boone JM, Yang K. The effect of skin thickness determined using breast CT on mammographic dosimetry. Med. Phys. 2008;35:1199–1206. doi: 10.1118/1.2841938. [DOI] [PMC free article] [PubMed] [Google Scholar]
- Huang S, Boone JM, Yang K, Packard NJ, Mckenney SE, Prionas ND, Lindfors K, Yaffe MJ, Yang K. The characterization of breast anatomical metrics using dedicated breast CT. Med. Phys. 2011;38:2180–2191. doi: 10.1118/1.3567147. [DOI] [PMC free article] [PubMed] [Google Scholar]
- Hwang Y-S, Lin Y-Y, Cheung Y-C, Tsai H-Y. Three-dimensional dose distribution in contrast-enhanced digital mammography using Gafchromic XR-QA2 films: Feasibility study. Radiation Physics and Chemistry. 2014;104:204–207. [Google Scholar]
- Institute of Physics and Engineering in Medicine (IPEM) The commissioning and routine testing of mammographic X-ray systems. IPEM Report 89. York, United Kingdom: IPEM; 2005. [Google Scholar]
- International Atomic Energy Agency (IAEA) Dosimetry in diagnostic radiology: an international code of practice Technical Reports Series no. 457. Vienna: IAEA; 2006. http://www-pub.iaea.org/MTCD/publications/PDF/TRS457web.pdf. [Google Scholar]
- International Atomic Energy Agency (IAEA) Dosimetry in diagnostic radiology: an international code of practice Technical Reports Series no. 457. 2007
- International Commission on Radiological Protection. Annals ICRP. 4. Vol. 17. Oxford: Pergamon; 1987. Statement from the 1987 Como meeting of the ICRP, ICRP Publication 52. [DOI] [PubMed] [Google Scholar]
- Johns PC, Yaffe MJ. X-ray characterisation of normal and neoplastic breast tissues. Phys. Med. Biol. 1987;32:675–695. doi: 10.1088/0031-9155/32/6/002. [DOI] [PubMed] [Google Scholar]
- Kalender W, Beister M, Boone J, Kolditz D, Vollmar S, Weigel M. High-resolution spiral CT of the breast at very low dose: concept and feasibility considerations. Eur. Radiol. 2012;22:1–8. doi: 10.1007/s00330-011-2169-4. [DOI] [PubMed] [Google Scholar]
- Karlsson M, Nygren K, Wickman G, Hettinger G. Absorbed dose in mammary radiography. Acta Radiologica Therapy Physics and Biology. 1976;15:252–258. doi: 10.3109/02841867609131962. [DOI] [PubMed] [Google Scholar]
- Kelaranta A, Timonen M, Komssi S, Kortesniemi M. Conformance of mean glandular dose from phantom and patient mammography. Radiat. Prot. Dosimetry. 2015;164:342–353. doi: 10.1093/rpd/ncu261. [DOI] [PubMed] [Google Scholar]
- Koutalonis M, Delis H, Spyrou G, Costaridou L, Tzanakos G, Panayiotakis G. Monte Carlo generated conversion factors for the estimation of average glandular dose in contact and magnification mammography. Phys. Med. Biol. 2006;51:5539–5548. doi: 10.1088/0031-9155/51/21/010. [DOI] [PubMed] [Google Scholar]
- Li X, Zhang D, Liu B. A parameterization method and application in breast tomosynthesis dosimetry. Med. Phys. 2013;40:092105. doi: 10.1118/1.4818059. [DOI] [PubMed] [Google Scholar]
- Liu B, Goodsitt M, Chan HP. Normalized average glandular dose in magnification mammography. Radiology. 1995;197:27–32. doi: 10.1148/radiology.197.1.7568836. [DOI] [PubMed] [Google Scholar]
- López-Pineda E, Ruiz-Trejo C, Brandan ME. A mammographic phantom to measure mean glandular dose by thermoluminescent dosimetry. Radiation Measurements. 2014;71:297–299. [Google Scholar]
- Ma AKW, Darambara DG, Stewart A, Gunn S, Bullard E. Mean glandular dose estimation using MCNPX for a digital breast tomosynthesis system with tungsten/aluminum and tungsten/aluminum + silver x-ray anode-filter combinations. Med. Phys. 2008;35:5278–5289. doi: 10.1118/1.3002310. [DOI] [PubMed] [Google Scholar]
- NCI (National Cancer Institute) Final report of the National Cancer Institute ad hoc working groups on mammography screening for breast cancer and a summary report of their joint findings and recommendations DHEW Publication NIH 77-1400. Rockville, MD: 1977. [Google Scholar]
- NCRP (National Council on Radiation Protection and Measurements) Mammography: A User’s Guide. Bethesda, MD: NCRP Report 85, NCRP; 1986. [Google Scholar]
- Nelson TR, Cervino LI, Boone JM, Lindfors KK. Classification of breast computed tomography data. Med. Phys. 2008;35:1078–1086. doi: 10.1118/1.2839439. [DOI] [PMC free article] [PubMed] [Google Scholar]
- Niklason LT, Christian BT, Niklason LE, Kopans DB, Castleberry DE, Opsahl-Ong BH, Landberg CE, Slanetz PJ, Giardino AA, Moore R, Albagli D, DeJule MC, Fitzgerald PF, Fobare DF, Giambattista BW, Kwasnick RF, Liu J, Lubowski SJ, Possin GE, Richotte JF, Wei CY, Wirth RF. Digital tomosynthesis in breast imaging. Radiology. 1997;205:399–406. doi: 10.1148/radiology.205.2.9356620. [DOI] [PubMed] [Google Scholar]
- Ning R, Yu Y, Conover DL, Lu X, He H, Chen Z, Schiffhauer L, Cullinan J. Preliminary system characterization of flat-panel-detector-based cone-beam CT for breast imaging. Proc. SPIE. 2004;5368:292–303. [Google Scholar]
- Nosratieh A, Hernandez AW, Shen SZ, Yaffe MJ, Seibert JA, Boone JM. Mean glandular dose coefficients (DgN) for x-ray spectra used in contemporary breast imaging systems. Phys. Med. Biol. 2015;60:7179–7190. doi: 10.1088/0031-9155/60/18/7179. [DOI] [PMC free article] [PubMed] [Google Scholar]
- Pike R, Sechopoulos I, Fei B. A minimum spanning forest based classification method for dedicated breast CT images. Med. Phys. 2015;42:6190–6202. doi: 10.1118/1.4931958. [DOI] [PMC free article] [PubMed] [Google Scholar]
- Pope TL, Read ME, Medsker T, Buschi TJ, Brenbridge AN. Breast skin thickness: Normal range and causes of thickening shown on film-screen mammography. J. Can. Assoc. Radiol. 1984;35:365–368. [PubMed] [Google Scholar]
- Qin X, Lu G, Sechopoulos I, Fei B. Breast tissue classification in digital tomosynthesis images based on global gradient minimization and texture features. Proc. SPIE. 2014;9034 doi: 10.1117/12.2043828. 90341V-V-8. [DOI] [PMC free article] [PubMed] [Google Scholar]
- Russo P, Lauria A, Mettivier G, Montesi MC, Villani N. Dose Distribution in Cone-Beam Breast Computed Tomography: An Experimental Phantom Study. IEEE Trans. Nucl. Sci. 2010;57:366–374. [Google Scholar]
- Sechopoulos I, Suryanarayanan S, Vedantham S, D'Orsi C, Karellas A. Computation of the glandular radiation dose in digital tomosynthesis of the breast. Med. Phys. 2007a;34:221–232. doi: 10.1118/1.2400836. http://dx.doi.org/10.1118/1.2400836. [DOI] [PMC free article] [PubMed] [Google Scholar]
- Sechopoulos I, Suryanarayanan S, Vedantham S, D'Orsi CJ, Karellas A. Scatter radiation in digital tomosynthesis of the breast. Med. Phys. 2007b;34:564–576. doi: 10.1118/1.2428404. [DOI] [PMC free article] [PubMed] [Google Scholar]
- Sechopoulos I, D’Orsi CJ. Glandular radiation dose in tomosynthesis of the breast using tungsten targets. J. Appl. Clin. Med. Phys. 2008;9:161–171. doi: 10.1120/jacmp.v9i4.2887. [DOI] [PMC free article] [PubMed] [Google Scholar]
- Sechopoulos I, Feng SSJ, D'Orsi CJ. Dosimetric characterization of a dedicated breast computed tomography clinical prototype. Med. Phys. 2010;37:4110–4120. doi: 10.1118/1.3457331. [DOI] [PMC free article] [PubMed] [Google Scholar]
- Sechopoulos I, Bliznakova K, Qin X, Fei B, Feng SSJ. Characterization of the homogeneous tissue mixture approximation in breast imaging dosimetry. Med. Phys. 2012;39:5050–5059. doi: 10.1118/1.4737025. http://dx.doi.org/10.1118/1.4737025. [DOI] [PMC free article] [PubMed] [Google Scholar]
- Sechopoulos I, Sabol JM, Berglund J, Bolch WE, Brateman L, Christodoulou E, Flynn M, Geiser W, Goodsitt M, Jones aK, Lo JY, Maidment ADA, Nishino K, Nosratieh A, Ren B, Segars WP, Von Tiedemann M. Radiation dosimetry in digital breast tomosynthesis: report of AAPM Tomosynthesis Subcommittee Task Group 223. Med. Phys. 2014;41:091501. doi: 10.1118/1.4892600. Online: http://www.ncbi.nlm.nih.gov/pubmed/25186375. [DOI] [PubMed] [Google Scholar]
- Sharma R, Sharma SD, Mayya YS, Chourasiya G. Mammography dosimetry using an in-house developed polymethyl methacrylate phantom. Radiat. Prot. Dosimetry. 2012;151:379–385. doi: 10.1093/rpd/ncr476. [DOI] [PubMed] [Google Scholar]
- Sobol WT, Wu X. Parametrization of mammography normalized average glandular dose tables. Med. Phys. 1997;24:547–554. doi: 10.1118/1.597937. [DOI] [PubMed] [Google Scholar]
- Soliman K, Bakkari M. Examination of the relevance of using radiochromic films in measuring entrance skin dose distribution in conventional digital mammography. Radiat. Prot. Dosimetry. 2015;165:373–375. doi: 10.1093/rpd/ncv126. [DOI] [PubMed] [Google Scholar]
- Suleiman ME, Brennan PC, McEntee MF. Diagnostic Reference Levels in Digital Mammography: a Systematic Review. Radiat. Prot. Dosimetry. 2015;167:608–619. doi: 10.1093/rpd/ncu365. [DOI] [PubMed] [Google Scholar]
- Thacker SC, Glick SJ. Normalized glandular dose (DgN) coefficients for flat-panel CT breast imaging. Phys. Med. Biol. 2004;49:5433–5444. doi: 10.1088/0031-9155/49/24/003. [DOI] [PubMed] [Google Scholar]
- Tomal A, Mazarro I, Kakuno EM, Poletti ME. Experimental determination of linear attenuation coefficient of normal, benign and malignant breast tissues. Radiation Measurements. 2010;45:1055–1059. [Google Scholar]
- Tornai MP, McKinley RL, Bryzmialkiewicz CN, Madhav P, Cutler SJ, Crotty DJ, Bowsher JE, Samei E, Floyd JCE. Design and development of a fully 3D dedicated x-ray computed mammotomography system. Proc. SPIE. 2005;5745:189–197. [Google Scholar]
- Toroi P, Könönen N, Timonen M, Kortesniemi M. Aspects of forward scattering from the compression paddle in the dosimetry of mammography. Radiat. Prot. Dosimetry. 2013;154:439–445. doi: 10.1093/rpd/ncs257. [DOI] [PubMed] [Google Scholar]
- van Engen R, Bosmans H, Bouwman RW, Dance DR, Heid P, Lazzari B, Marshall N, Schopphoven S, Strudley C, Thijssen MAO, Young KC. Protocol for the Quality Control of the Physical and Technical Aspects of Digital Breast Tomosynthesis Systems Ver 1.0. Nijmegen, The Netherlands: Dutch Reference Centre for Screening; 2015. [Google Scholar]
- Vedantham S, Shi L, Karellas A, O'Connell A. Dedicated breast CT: skin thickness measurements in a diagnostic population. Med. Phys. 2012a;39:3914. doi: 10.1118/1.4735977. [DOI] [PubMed] [Google Scholar]
- Vedantham S, Shi L, Karellas A, O’Connell AM. Dedicated breast CT: fibroglandular volume measurements in a diagnostic population. Med. Phys. 2012b;39:7317–7328. doi: 10.1118/1.4765050. [DOI] [PMC free article] [PubMed] [Google Scholar]
- Vedantham S, Shi L, Karellas A, Noo F. Dedicated breast CT: radiation dose for circle-plus-line trajectory. Med. Phys. 2012c;39:1530–1541. doi: 10.1118/1.3688197. [DOI] [PMC free article] [PubMed] [Google Scholar]
- Vedantham S, Shi L, Karellas A, O'Connell AM, Conover DL. Personalized estimates of radiation dose from dedicated breast CT in a diagnostic population and comparison with diagnostic mammography. Phys. Med. Biol. 2013;58:7921–7936. doi: 10.1088/0031-9155/58/22/7921. [DOI] [PMC free article] [PubMed] [Google Scholar]
- Warren LM, Mackenzie A, Cooke J, Given-Wilson RM, Wallis MG, Chakraborty DP, Dance DR, Bosmans H, Young KC. Effect of image quality on calcification detection in digital mammography. Med. Phys. 2012;39:3202–3213. doi: 10.1118/1.4718571. [DOI] [PMC free article] [PubMed] [Google Scholar]
- Wilkinson LE, Heggie JCP. Glandular Breast Dose: Potential Errors. Radiology Electronic letter in response to: Boone J M 1999 Glandular breast dose for monoenergetic and high-energy x-ray beams: Monte Carlo assessment. Radiology. 2000;213:23–37. doi: 10.1148/radiology.213.1.r99oc3923. [DOI] [PubMed] [Google Scholar]
- Willson AEJ, Adam EJ, Tucker AK. Patterns of breast skin thickness in normal mammograms. Clin. Radiol. 1982;33:691–693. doi: 10.1016/s0009-9260(82)80407-8. [DOI] [PubMed] [Google Scholar]
- Wu X, Barnes GT, Tucker DM. Spectral dependence of glandular tissue dose in screen-film mammography. Radiology. 1991;179:143–148. doi: 10.1148/radiology.179.1.2006265. [DOI] [PubMed] [Google Scholar]
- Wu X, Gingold EL, Barnes GT, Tucker DM. Normalized average glandular dose in molybdenum target-rhodium filter and rhodium target-rhodium filter mammography. Radiology. 1994;193:83–89. doi: 10.1148/radiology.193.1.8090926. [DOI] [PubMed] [Google Scholar]
- Yaffe MJ, Boone JM, Packard N, Alonzo-Proulx O, Huang SY, Peressotti CL, Al-Mayah A, Brock K. The myth of the 50-50 breast. Med. Phys. 2009;36:5437–5443. doi: 10.1118/1.3250863. [DOI] [PMC free article] [PubMed] [Google Scholar]
- Yaffe MJ, Mainprize JG. Risk of Radiation-induced Breast Cancer from Mammographic Screening. Radiology. 2011;258:98–105. doi: 10.1148/radiol.10100655. [DOI] [PubMed] [Google Scholar]
- Yang X, Sechopoulos I, Fei B. Automatic tissue classification for high-resolution breast CT images based on bilateral filtering. Proc. SPIE. 2011;7962:79623H. doi: 10.1117/12.877881. [DOI] [PMC free article] [PubMed] [Google Scholar]
- Yang X, Wu S, Sechopoulos I, Fei B. Cupping Artifact Correction and Automated Classification for High-Resolution Dedicated Breast CT Images. Med. Phys. 2012;39:6397–6406. doi: 10.1118/1.4754654. [DOI] [PMC free article] [PubMed] [Google Scholar]
- Young KC, Oduko JM. Radiation doses received in the United Kingdom breast screening programme in 2010 to 2012. Brit. J. Radiol. 2016;89:20150831. doi: 10.1259/bjr.20150831. http://dx.doi.org/10.1259/bjr.20150831. [DOI] [PMC free article] [PubMed] [Google Scholar]
- Zyganitidis C, Bliznakova K, Pallikarakis N. A novel simulation algorithm for soft tissue compression. Med. Biol. Eng. Comput. 2007;45:661–669. doi: 10.1007/s11517-007-0205-y. [DOI] [PubMed] [Google Scholar]


