

Abstract
Oligomeric proteins are important targets for structure determination in solution. While in most cases the fold of individual subunits can be determined experimentally, or predicted by homology-based methods, protein-protein interfaces are challenging to determine de novo using conventional NMR structure determination protocols. Here we focus on a member of the bet-V1 superfamily, Aha1 from Colwellia psychrerythraea. This family displays a broad range of crystallographic interfaces none of which can be reconciled with the NMR and SAXS data collected for Aha1. Unlike conventional methods relying on a dense network of experimental restraints, the sparse data are used to limit conformational search during optimization of a physically realistic energy function. This work highlights a new approach for studying minor conformational changes due to structural plasticity within a single dimeric interface in solution.
Keywords: protein complex, nuclear magnetic resonance spectroscopy, CS-Rosetta modeling, residual dipolar coupling, small-angle X-ray scattering
Introduction
Oligomerization plays an important role in the function and activity of proteins in signaling pathways and enzymes.1 X-ray crystallography has been the workhorse in this endeavor but its application requires the availability of diffraction quality crystals. More importantly, proteins might adopt drastically different oligomeric structures in the crystal due to crystal lattice interactions that have no bearing on the biologically significant structure.2,3 NMR is a powerful technique for probing the physiologically relevant solution state and, despite complications that depend on the dimer association affinity, the combined size of the molecule and conformational exchange processes,4 NMR continues to provide key contributions in the understanding of protein–protein5 and protein-nucleic acid6 interactions. These effects tend to broaden NMR cross-peaks beyond detection and require specialized isotopic labeling schemes, including the labeling of distinct residues on individual chains to overcome symmetry ambiguities in the spectrum.7 These approaches are generally more expensive and time-consuming, and yield less accurate structures due to the sparse nature of the data.8 Methods to determine the orientation of individual subunits relative to the diffusion tensor using 15N backbone relaxation rate ratios (R2/R1),9 in combination with sparse NOEs and shape restraints (SAXS), or, alternatively using SAXS and ion mobility measurements from mass-spectrometry,10 have been recently introduced in the popular software packages Xplor-NIH11 and HADDOCK12. However, the sophisticated diffusion tensor analysis is limited to well-behaved systems that show no aggregation or transient dimer formation, while the HADDOCK approach works well when supplied with pre-existing models of the unbound subunits and chemical shift perturbation data reporting on the mapping of the dimerization interface that are difficult to obtain for obligate complexes (nM range KD). The symmetry-ADR method,13 involving the use of extensive sets of ambiguous NOE distance restraints (intra and inter-subunit), is an important advance toward this goal, but the calculation of symmetric oligomers by NMR remains challenging.14 In particular, further development is needed to accurately determine the structures of larger sized dimers or higher order oligomers in the absence of any starting models of the monomeric subunit.
We have recently developed a series of computational methods that model larger monomeric protein targets,15 small-sized protein oligomers,16 and complex macromolecular assemblies17 within the CS (chemical shift)-Rosetta framework.18 These methods effectively overcome low restraint count by advanced conformational sampling algorithms and refinement using a physically realistic all-atom energy function to yield accurate structures.19 In particular, sparse constraints from deuterated samples can be used to guide structure determination with RASREC-Rosetta.20 This advanced sampling algorithm has allowed structure determination of challenging targets from a limited set of data, relative to conventional protocols.15,21–23 RosettaOligomers allows structure determination of symmetric protein assemblies using chemical shifts and RDC data.24 This approach has been shown to yield highly accurate (<2 Å backbone RMSD relative to the X-ray structure) oligomeric structures consisting of subunits with both independently folded monomers and domain-swapped topologies in the absence of inter-subunit NOE restraints.16 This is primarily due to an advanced Rosetta symmetric modeling framework25 that allows efficient conformational sampling and energy scoring by using an explicitly symmetric representation of the system.
Here we integrate the powerful RASREC-Rosetta and RosettaOligomers methods, and illustrate a practical application of the combined approach in determining the structure of the 33 kDa dimer Aha1 domain from Colwellia psychrerythraea member of the AHSA1 family (PF08327) and bet-V1 clan. Aha1 (NESG target CsR251) was selected for structural analysis as part of a broader program on structural coverage of the bet-V1 superfamily. Proteins of the bet-V1 superfamily span diverse molecular functions including small molecule and protein transport as in the case of Bacillus subtilis Yndb26 and stimulation of Hsp90s ATPase activity in Human (Hch1) and yeast.27 These proteins are known to dimerize in a variety of different orientations in the crystalline phase [Fig. 1(A–D)] that poses a challenge to conventional structure determination methods indicating a potential role of crystal lattice contacts in perturbing the functional dimerization mode [Fig. 1(C,D)]. The final Hybrid Rosetta/NMR/SAXS ensemble shows a unique binding interface that deviates from previous bet-V1 structures, suggesting a functional adaptation involving a higher-order variation on a basic structural theme.
Figure 1.
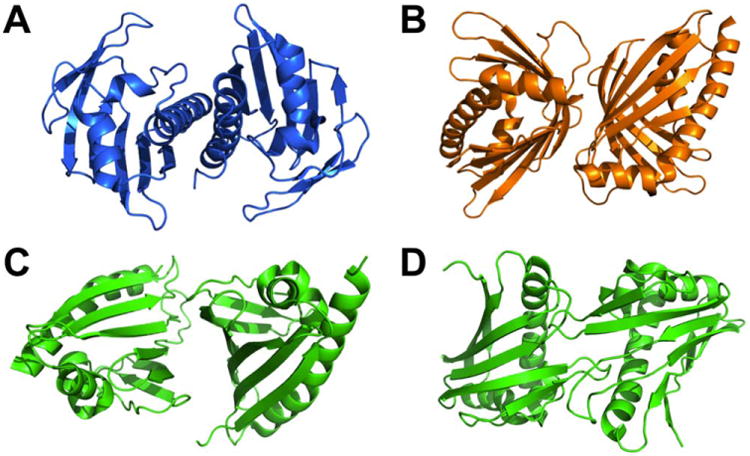
Examples of variability in the bet-V1 clan dimer interfaces. Aggregation screening was conducted prior to structure determination by NESG and the proteins were found to be dimeric under the crystallization conditions: A) SSP2350 (PDB ID 3Q6A). B) MM0500 (PDB ID 1XUV). C, D) Two plausible crystallographic dimer interfaces observed for MLL2253 (PDB ID 3Q63).
Materials and Methods
NMR sample preparation and experimental assignment procedure
Aha1 samples for SAXS, NMR, and complementary biochemical techniques were obtained as described in Supporting Information Methods. Aha1 forms a dimer in solution (KD of 80 nM) as shown by biochemical characterization (Supporting Information Figs. S1–S3). SAXS analysis further confirms that Aha1 is monodisperse and has a compact fold (Supporting Information Fig. S4 and Table S1). In order to gain insight into the dimeric structure by NMR we produced ILV({[U-2H, 13C,15N]; Ileδ1-[13CH3]; Leu,Val-[13CH3]}) as well as [U-13C,15N]-labeled Aha1 samples. Deuteration and selective Ile, Leu, and Val (ILV) methyl protonation were required to obtain backbone and methyl chemical shift (CS) assignments (see Supporting Information Methods and Figs. S5 and S6). Interestingly, while signal was barely observable for triple resonance experiments involving magnetization transfer through Cα, due to the relatively short (∼35 ms) backbone N T2 relaxation time (Supporting Information Fig. S7), the [U-13C,5N] sample gave excellent three-dimensional (3D) 15N and 13C edited-NOESYs spectra. Extensive sidechain CS assignments that included complete methyl assignments for Thr, Ala, and Met, and aromatics were obtained manually using the CH3-CH3 and HN-CH3 NOEs from the [U-13C,15N] sample and a starting set of HN, ILV methyl, 13Cα and 13Cβ chemical shifts.28 In addition, we recorded 1H-15N RDCs using samples aligned in PEG29 and Pf1 Phage30 media. Finally, we augmented the NMR dataset with SAXS data,31 collected as described in Supporting Information Methods.
Rosetta structure calculations
Dimer structure determination was carried out in a two-step manner (as highlighted in the workflow diagram of Fig. 2). First, we determined a structural ensemble of the monomeric subunit using a combination of backbone CS, HN-HN, HN-CH3 and CH3-CH3 NOEs and amide RDCs using RASREC-Rosetta (as described in Supporting Information Methods). Then, we performed symmetric docking calculations starting from the 10 lowest-energy monomer structures using the two sets of RDCs and SAXS data. The combination of RDCs with SAXS data was crucial, as each data type by itself was insufficient to obtain convergence within a single dimeric binding mode (Fig. 3). The employed hybrid approach aims to combine data reporting at different levels of structural precision to obtain a highly converged solution of the dimeric complex. Specifically, RDC and SAXS data that can discriminate between different overall dimer topologies are combined with the detailed Rosetta all-atom energy,19 which is sensitive to the local sidechain packing and hydrogen bonding details of the binding interface. To account for these differences in the various sources of structural information employed, we developed a two-tier refinement strategy, as outlined in detail in Supporting Information Methods. First, we performed global docking calculations using the Rosetta energy function alone (Phase I). The motivation for this approach is to sample the docking energy landscape globally, without introducing additional experimental biases in order to consider the maximum number of dimer conformations (Fig. 3, yellow points). Instead, the experimental data were used in a filtering step to select Phase I dimer models sampled by Rosetta that also showed reasonable agreement with the SAXS and RDC data. The selected models were further refined using small-amplitude perturbations of the 4 rigid body degrees of freedom defining the dimer orientation, followed by backbone minimization and sidechain repacking (Phase II), using both sets of RDCs and SAXS as additional scoring terms to the Rosetta energy (Fig. 3, gray points). From this refined set of structures we considered the top 75%, ranked according to Rosetta energy, RDC and SAXS score, which buried at least 800 Å2 of solvent exposed surface area (SASA) in the inter-face (Fig. 3 and Supporting Information Fig. S8, green points). We finally selected an ensemble of 10 conformations showing the lowest interface energies (ΔΔG) (Fig. 3 and Supporting Information Fig. S8, blue points). This highly converged ensemble (within 0.7 Å heavy-atom RMSD relative to the average structure) was deposited in the PDB (PDB ID 2M89).
Figure 2.
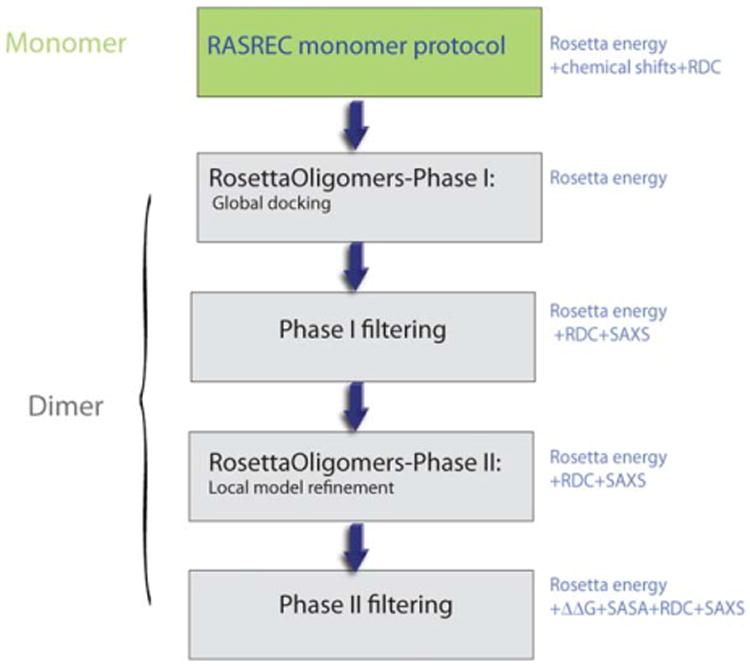
Workflow of the Integrative Rosetta modeling approach. The different steps of RASREC monomer determination followed by Phase I and Phase II docking, filtering and final model selection are outlined as boxes. The type of experimental/Rosetta energy information and structure quality factors used at each step are indicated on the right of each box. Inter-chain NOE data were not employed in the structure determination process, but were instead used to validate the final dimer structure.
Figure 3.
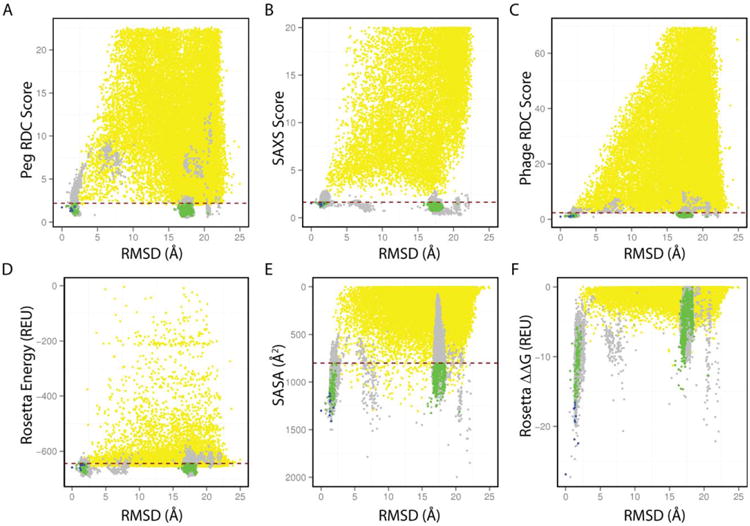
Experimental score, structure quality terms, and Rosetta energy distributions for all sampled dimer models. As a reference structure for backbone RMSD calculations (x-axis), we used the model with the lowest interface interaction score (1st model in the submitted PDB ensemble, residues 1–131). All sampled Phase-I (global docking) models are shown in yellow (40,000 points), while Phase II models (local perturbation) in gray, (14,000 models). Phase II conformations within the lowest 75 percentile (red dashed lines) of Rosetta all atom energy, RDC penalty, SAXS penalty and with solvent exposed surface area (SASA) greater than 800 Å2 were kept for further analysis (green, 900 points). From these 900 conformations, the 10 with lowest predicted ΔΔG values were selected as the final ensemble (blue). In detail: A) PEG RDC score computed as RMS(DEXP − DCALC)/ DA, where DA is the alignment tensor magnitude. B) SAXS score, computed as RMS(IEXP − ICALC). C) Phage RDC score, computed in a similar manner. D) Rosetta score12 all-atom energy, in Rosetta Energy Units (REU). E) SASA (Å2). F) Interface free energy (ddg or ΔΔG) defined as: ΔGdimer −2 * ΔGmonomer.
Selection of experimental weights and filtering parameters
For Phase II sample, we use a hybrid energy function of the form:
where ERosetta is the default Rosetta3 score function (score12), ERDC1, ERDC2 measure the RMSD between experimental and calculated RDCs after non-linear fitting of the five alignment tensor parameters and ESAXS is proportional to the RMSD between the experimental and calculated SAXS profiles (as outlined in Supporting Information Methods). In this approach, the experimental scoring terms are used as a filter after Phases I, II and as calculation restraints in Phase II (Fig. 2) to eliminate dimer arrangements that are largely inconsistent with the data. Accordingly, the overall weights of the experimental score terms (wEXP) were optimized in a series of preliminary calculations using a grid search, and the weights that give the lowest distribution of Rosetta energies (ERosetta) were selected for the final calculations. While the relative weights between different RDC datasets (w1, w2) were scaled according to the inverse magnitude of the corresponding alignment tensors, the SAXS weight (w3) was adjusted such that a similar dynamic range of SAXS scores as the combined RDC scores is sampled in the calculations.
Although the method presented here can be readily applied to a wide range of oligomers, several parameters must be optimized on a case-by-case basis according to the size and complexity of each target. While the filters based on the fits to the experimental data and Rosetta energy are shown here as a percentile over the total number of sampled models (Fig. 3), the exact ΔΔG cut-off is related to the type of interface (according to size, secondary structure, and type of interactions).32 In the absence of large conformational changes upon dimer formation this value can be estimated based on the statistics of observed protein–protein interfaces in the PDB, as reviewed recently,33 by monitoring the sampled SASA values in preliminary structure calculations. In the Phase II filtering step, we consider dimer conformations that bury at least 800 Å2 of SASA, based on the distribution of SASA in crystallographic interfaces in the PDB.2
Results and Discussion
The protomer structure in the final ensemble (Fig. 4 and Supporting Information Fig. S9) is characteristic of the bet-V1 superfamily fold with seven antiparallel b-strands flanked by two small contiguous α-helices (α1, α2) following β1 and a long carboxyl-terminal helix (α3). The computed monomer structure falls within 2.0 A˚ Cα RMSD to the closest homolog structure MLL2253 (PDB ID 3Q63) at 29% sequence identity. The dimer interface is formed by a unique edge strand-to-helix interaction involving β1 and α3 and buries a large solvent-accessible surface area (SASA), of approximately 1300 Å2 [Fig. 3(E)]. Unlike the flavonoid-binding members of the bet-V1 clan that can accommodate a ligand at the core,26 the Aha1 core is tightly packed suggesting a structural adaptation to a distinct molecular function. The structure is in good agreement with the experimental RDCs, fits well the SAXS-derived ab initio molecular envelope, and is independently validated by inter-chain NOEs that were not used in determining the structure (Fig. 4; Fig. 5 and discussion below).
Figure 4.
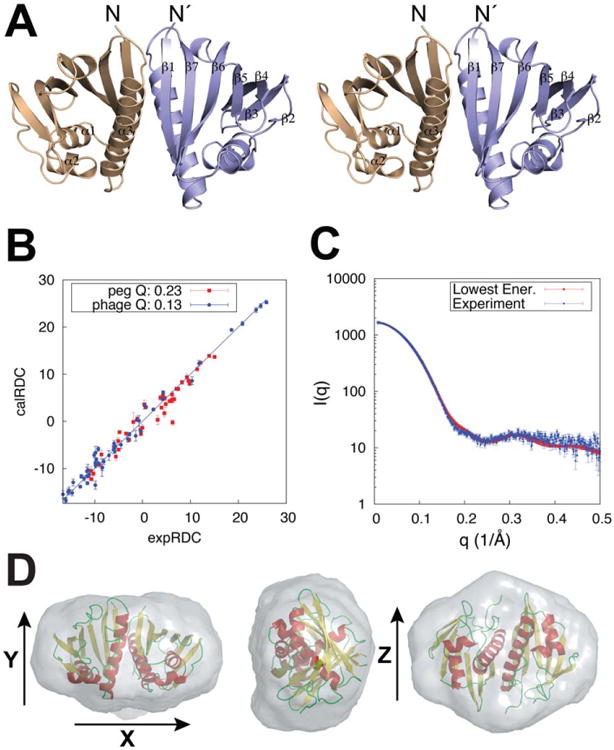
Final model fit to the RDC and SAXS data. A) Stereo view of the Aha1 symmetric dimer structure with secondary structure elements indicated for a single chain. B) Calculated versus experimental 1H-15N RDCs showing the agreement of the minimally restrained CS-Rosetta lowest energy structure to the experimental data. C) SAXS data and corresponding fit obtained for the lowest energy structure (χ2 = 1.71). D) Ab initio molecular envelope from a consensus model of 20 individual reconstructions shown along x, y, and z vectors. Spatial discrepancy of 0.540 and variation of 0.023 were obtained in the final fit. The final structural ensemble was selected using energy-based criteria (Fig. 3 and Supporting Information Fig. S8) and further validated using an independent dataset of inter-molecular NOEs [Fig. 5(B)].
Figure 5.
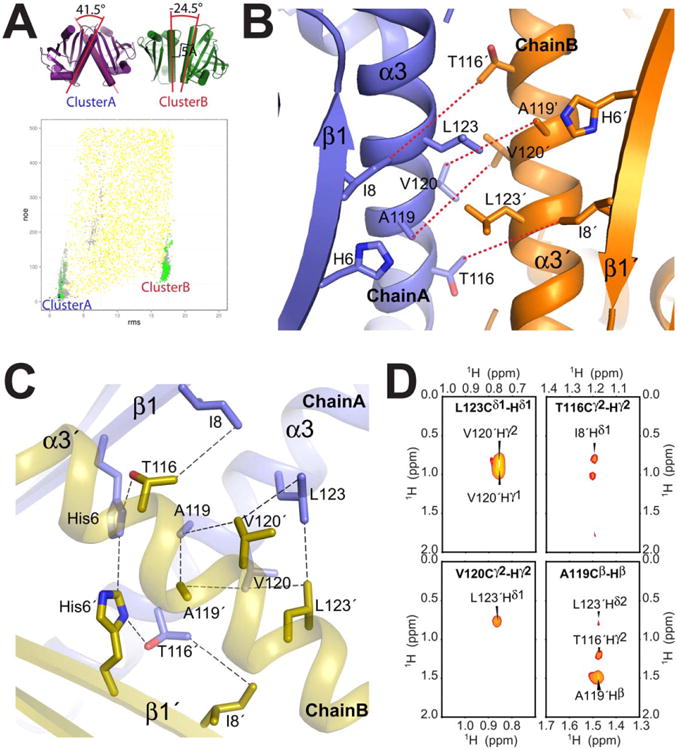
Validation using an independent set of interchain NOEs. A) Agreement of double half-filtered intermolecular NOEs (not used as structure restraints in Phase I/II calculations or filtering steps shown in Figure 2) vs. RMSD to the lowest-energy structure. For clarity, only models with below 500 NOE penalty score (using a flat-bottom scoring term with a 5.5Å upper limit and an exponential penalty function) are shown. Color scheme is the same as in Figure 3: Phase I/global docking (yellow), Phase II/local perturbation (grey), below post-Phase II filter (green) and lowest 10 ΔΔG scores (final structures, blue). two most prominent clusters of filtered models (“Cluster A”, “Cluster B”) are indicated, and their differences in terms of the dimer orientation are highlighted on the lowest-energy representative structural models on the top left. B) Lowest-energy representative structure from cluster B shows a number of intermolecular NOE violations, between Ile8, Thr116, Ala119 and V120, as indicated by red dashed lines. C) Close up view of the dimer interface in the final model from Cluster A (1st member of the final ensemble). Dashed lines indicate the intermolecular contacts identified in the NMR spectra (3D double half-filtered 13C-edited NOESY in black, 3D-13C-edited NOESY in green). D) Assigned X-filtered NOESY cross-peaks used to validate the Aha1 structure. In bold is the assignment of the 13C labeled direct observed 1H atom and label on the peak is the interchain 12C labeled 1H. Further interchain cross-peaks were assigned in the 3D NOESY spectra that connect T116 Hγ2 to His6 Hα unambiguously (Supporting Information Table S3).
The combination of RDCs and SAXS with the Rosetta Energy function and structure quality metrics (SASA, ΔΔG) allows identifying the correct dimeric binding mode with high accuracy, according to our previous benchmarks.16,34 The RDCs provide domain orientational information, yet are insensitive to rigid-body translations of one monomer relative to the other, where SAXS data provide an overall envelope of the dimeric assembly that is sensitive to both rotations and translations, albeit with much lower precision. Therefore, both RDCs and SAXS are highly sensitive to different sources of structural “noise” and the calculations do not converge on a single dimer structure when repeating the entire Phase I/Phase II protocol by using either the RDCs or SAXS data alone. To illustrate the discriminating power of different experimental and structure quality scoring terms in deriving the final ensemble of models [Supporting Information Fig. S8(G), “cluster A”], we consider an alternative cluster of conformations sampled in Phase II [Supporting Information Fig. S8(H), “cluster B”], that differs significantly in the domain orientation of the two monomers [Fig. 5(A)]. While there is certainly a noticeable difference in the SAXS profiles between the two ensembles (cluster A/panel I vs. cluster B/panel J) for Q values >0.35Å−1 (a part of the profile that also has increased experimental errors and was therefore not included in structure refinement), the ΔΔG values show a much sharper trend that clearly demarcates cluster A as the correct structure over the alternative cluster B sampled in Phase II [Supporting Information Fig. S8(F)]. However, it is the inclusion of the experimental data as a filter after Phase I that helps enhance sampling of conformations in the vicinity of the native dimer structure by eliminating additional “decoy” conformations. For example, if the calculated ΔΔG values were used for Phase I filtering instead [Fig. 3(F)—yellow points], we would obtain a much larger number of false positives for Phase II refinement (i.e., dimers that still show realistic interface features using an incorrect binding surface), thus limiting the efficiency and convergence of the method on a unique binding mode.
In contrast to conventional de novo structure determination methods that rely heavily on an extensive network of experimental restraints to achieve structural convergence, our method utilizes a physically realistic energy function19 that is enhanced by the intersection of all sources of experimental information as a means to limit the search of conformational space. As a result of the chosen approach, the final structures display a well-packed interface with good structural statistics (as assessed by MOLPROBITY35) while using a minimal set of experimental restraints to guide the search (Supporting Information Table S2). The weakly restraining strategy adopted here prevents over-fitting without the need for data-intensive cross-validation methods to adjust experimental weights,36 since the total energy of the final models is mostly (>95%) determined by the Rosetta energy function. As a result of these features, the new approach provides improved convergence compared to models defined by the available experimental data alone using conventional structure determination protocols.
In order to experimentally validate the identified dimer interface, we recorded additional 3D 13C,15N-filtered-13C,15N-edited NOESY spectra37 on a mixed [U-13C, 15N]-labeled/fully protonated sample as an independent dataset. Not surprisingly, the methyl region of the spectrum yielded important inter-subunit restraints (Supporting Information Table S2). Specifically, 23 cross-peaks between Ala119, V120, Leu123, Thr116, and Ile8 were well resolved and unambiguously assigned (Supporting Information Table S3). As Ala119, V120, Leu123, Thr116, and Ile8 are located in the α3 region of the dimer interface region, these 23 cross-peaks in the double-half filtered NOE data unequivocally confirm the placement of the key inter-chain methyl contacts observed in the Rosetta models [Fig. 5(C,D)]. Notably, the lowest-energy models have significantly lower NOE scores than all other dimer conformations sampled in the Rosetta docking calculations [Fig. 5(A)], including the alternative binding mode (cluster B) sampled in Phase II, that shows multiple NOE violations [Fig. 5(B)]. Subsequently, as a further validation test, the cross-filtered NOE data alone were used as structural restraints in new docking calculations (as outlined in Supporting Information Methods). The NOE-driven calculations converged to the same binding mode as the original calculations using RDCs and SAXS. Conversely, the intermolecular NOE contacts are inconsistent with all interfaces observed in previous crystal structures of known homologs (Fig. 1). Taken together with the SAXS, RDC fits and energetic criteria defined above, these results unequivocally confirm the validity of the determined Rosetta models.
In summary, we present a hybrid approach for determining high-quality structures of protein dimers that uses NMR chemical shifts, sparse distance restraints (NOEs) obtained in uniformly and selectively methyllabeled samples, and global orientational and shape restraints (RDCs and SAXS data). We demonstrate the discriminating power of the new approach by determining the dimeric structure of a representative of the variable bet-V1 superfamily, Aha1, and validate our models using an independent NOE restraint dataset. While the presence of a high-affinity (KD 80 nm) dimer allows the measurement of interchain NOEs in this study, in other cases the presence of an obligate oligomeric species may prevent the exchange of labeled / unlabeled chains towards obtaining mixed samples for such measurements. The new approach can provide a high-accuracy structure using RDCs and SAXS alone, thus allowing these NOEs, when available, to be used for independent validation. Notably, the Aha1 interface identified here is clearly distinct from the structures of other bet-V1 superfamily members. The widely varying dimerization modes observed within a single protein family could arise from perturbations of the domain arrangement in the crystal lattice or may reflect species-specific adaptation to the functional role contended by different family members. Further structural studies using the new solution-based approach focusing on the other Aha1 homologs are needed to address this important question.
Supplementary Material
Acknowledgments
Grant sponsor: NIH; Grant numbers: GM76222 (to D.B.) and GM088396 (to E.H.S., T.D.G., and J.R.L.); Grant sponsor: National Institute of General Medical Sciences Protein Structure Initiative; Grant number: U54-GM094597 (to G.T.M.); Grant sponsor: DTRA; Grant number: HDTRA1-10-c-0057 (to E.H.S.); Grant sponsors: HHMI (to D.B.) and Intramural Research Program of the National Institute of Diabetes and Digestive and Kidney Diseases, National Institutes of Health (to N.G.S.).
Abbreviations
- CS
chemical shift
- ILV
Isoleucine, Leucine, and Valine
- NMR
nuclear magnetic resonance
- NOESY
nuclear Overhauser effect spectroscopy
- RASREC
resolution-adapted structural recombination
- RDC
residual dipolar coupling
- SAXS
small angle X-ray scattering
Footnotes
Additional Supporting Information may be found in the online version of this article.
References
- 1.Goodsell DS, Olson AJ. Structural symmetry and protein function. Annu Rev Biophys Biomol Struct. 2000;29:105–153. doi: 10.1146/annurev.biophys.29.1.105. [DOI] [PubMed] [Google Scholar]
- 2.Janin J. Specific versus non-specific contacts in protein crystals. Nat Struct Biol. 1997;4:973–974. doi: 10.1038/nsb1297-973. [DOI] [PubMed] [Google Scholar]
- 3.Bahadur RP, Chakrabarti P, Rodier F, Janin J. A dissection of specific and non-specific protein-protein interfaces. J Mol Biol. 2004;336:943–955. doi: 10.1016/j.jmb.2003.12.073. [DOI] [PubMed] [Google Scholar]
- 4.Xu Y, Matthews S. TROSY NMR spectroscopy of large soluble proteins. Top Curr Chem. 2011;335:97–119. doi: 10.1007/128_2011_228. [DOI] [PubMed] [Google Scholar]
- 5.Ihms EC, Zhou MW, Zhang Y, Kleckner IR, McElroy CA, Wysocki VH, Gollnick P, Foster MP. Gene regulation by substoichiometric heterocomplex formation of undecameric TRAP and trimeric anti-TRAP. Proc Natl Acad Sci USA. 2014;111:3442–3447. doi: 10.1073/pnas.1315281111. [DOI] [PMC free article] [PubMed] [Google Scholar]
- 6.Varani L, Gunderson SI, Mattaj IW, Kay LE, Neuhaus D, Varani G. The NMR structure of the 38 kDa U1A protein - PIE RNA complex reveals the basis of cooperativity in regulation of polyadenylation by human U1A protein. Nat Struct Biol. 2000;7:329–335. doi: 10.1038/74101. [DOI] [PubMed] [Google Scholar]
- 7.Traaseth NJ, Verardi R, Veglia G. Asymmetric methyl group labeling as a probe of membrane protein homo-oligomers by NMR spectroscopy. J Am Chem Soc. 2008;130:2400–2401. doi: 10.1021/ja711499r. [DOI] [PMC free article] [PubMed] [Google Scholar]
- 8.Mueller GA, Choy WY, Yang D, Forman-Kay JD, Venters RA, Kay LE. Global folds of proteins with low densities of NOEs using residual dipolar couplings: application to the 370-residue maltodextrin-binding protein. J Mol Biol. 2000;300:197–212. doi: 10.1006/jmbi.2000.3842. [DOI] [PubMed] [Google Scholar]
- 9.Ryabov Y, Clore GM, Schwieters CD. Direct use of N-15 relaxation rates as experimental restraints on molecular shape and orientation for docking of protein-protein complexes. J Am Chem Soc. 2010;132:5987–5989. doi: 10.1021/ja101842n. [DOI] [PMC free article] [PubMed] [Google Scholar]
- 10.Karaca E, Bonvin AMJJ. On the usefulness of ion-mobility mass spectrometry and SAXS data in scoring docking decoys. Acta Crystallogr D. 2013;69:683–694. doi: 10.1107/S0907444913007063. [DOI] [PubMed] [Google Scholar]
- 11.Schwieters CD, Kuszewski JJ, Clore GM. Using Xplor-NIH for NMR molecular structure determination. Prog Nucl Mag Res Sp. 2006;48:47–62. doi: 10.1016/s1090-7807(02)00014-9. [DOI] [PubMed] [Google Scholar]
- 12.Dominguez C, Boelens R, Bonvin AMJJ. HADDOCK: a protein-protein docking approach based on biochemical or biophysical information. J Am Chem Soc. 2003;125:1731–1737. doi: 10.1021/ja026939x. [DOI] [PubMed] [Google Scholar]
- 13.Nilges M. A calculation strategy for the structure determination of symmetric dimers by 1H NMR. Proteins. 1993;17:297–309. doi: 10.1002/prot.340170307. [DOI] [PubMed] [Google Scholar]
- 14.O'Donoghue SI, Nilges M. Calculation of symmetric oligomer structures from NMR data. In: Krishna NR, Berliner L, editors. Biological magnetic resonance. Vol. 17. US: Springer; 2002. pp. 131–161. Biological Magnetic Resonance. [Google Scholar]
- 15.Lange OF, Rossi P, Sgourakis NG, Song Y, Lee HW, Aramini JM, Ertekin A, Xiao R, Acton TB, Montelione GT, Baker D. Determination of solution structures of proteins up to 40 kDa using CS-Rosetta with sparse NMR data from deuterated samples. Proc Natl Acad Sci USA. 2012;109:10873–10878. doi: 10.1073/pnas.1203013109. [DOI] [PMC free article] [PubMed] [Google Scholar]
- 16.Sgourakis NG, Lange OF, DiMaio F, Andre I, Fitzkee NC, Rossi P, Montelione GT, Bax A, Baker D. Determination of the structures of symmetric protein oligomers from NMR chemical shifts and residual dipolar couplings. J Am Chem Soc. 2011;133:6288–6298. doi: 10.1021/ja111318m. [DOI] [PMC free article] [PubMed] [Google Scholar]
- 17.Loquet A, Sgourakis NG, Gupta R, Giller K, Riedel D, Goosmann C, Griesinger C, Kolbe M, Baker D, Becker S, Lange A. Atomic model of the type III secretion system needle. Nature. 2012;486:276–279. doi: 10.1038/nature11079. [DOI] [PMC free article] [PubMed] [Google Scholar]
- 18.Shen Y, Lange O, Delaglio F, Rossi P, Aramini JM, Liu G, Eletsky A, Wu Y, Singarapu KK, Lemak A, Ignatchenko A, Arrowsmith CH, Szyperski T, Montelione GT, Baker D, Bax A. Consistent blind protein structure generation from NMR chemical shift data. Proc Natl Acad Sci USA. 2008;105:4685–4690. doi: 10.1073/pnas.0800256105. [DOI] [PMC free article] [PubMed] [Google Scholar]
- 19.Leaver-Fay A, Tyka M, Lewis SM, Lange OF, Thompson J, Jacak R, Kaufman K, Renfrew PD, Smith CA, Sheffler W, Davis IW, Cooper S, Treuille A, Mandell DJ, Richter F, Ban YEA, Fleishman SJ, Corn JE, Kim DE, Lyskov S, Berrondo M, Mentzer S, Popovic Z, Havranek JJ, Karanicolas J, Das R, Meiler J, Kortemme T, Gray JJ, Kuhlman B, Baker D, Bradley P. Rosetta3: an object-oriented software suite for the simulation and design of macromolecules. Method Enzymol. 2011:545–574. doi: 10.1016/B978-0-12-381270-4.00019-6. [DOI] [PMC free article] [PubMed] [Google Scholar]
- 20.Lange OF, Baker D. Resolution-adapted recombination of structural features significantly improves sampling in restraint-guided structure calculation. Proteins. 2012;80:884–895. doi: 10.1002/prot.23245. [DOI] [PMC free article] [PubMed] [Google Scholar]
- 21.Rao T, Lubin JW, Armstrong GS, Tucey TM, Lundblad V, Wuttke DS. Structure of Est3 reveals a bimodal surface with differential roles in telomere replication. Proc Natl Acad Sci USA. 2014;111:214–218. doi: 10.1073/pnas.1316453111. [DOI] [PMC free article] [PubMed] [Google Scholar]
- 22.Sgourakis NG, Natarajan K, Ying J, Vogeli B, Boyd LF, Margulies DH, Bax A. The structure of mouse cytomegalovirus m04 protein obtained from sparse NMR data reveals a conserved fold of the m02-m06 viral immune modulator family. Structure. 2014;22:1263–1273. doi: 10.1016/j.str.2014.05.018. [DOI] [PMC free article] [PubMed] [Google Scholar]
- 23.Lloyd NR, Wuttke DS. Less is more: structures of difficult targets with minimal constraints. Structure. 2014;22:1223–1224. doi: 10.1016/j.str.2014.08.004. [DOI] [PMC free article] [PubMed] [Google Scholar]
- 24.Bradley P, Misura KM, Baker D. Toward high-resolution de novo structure prediction for small proteins. Science. 2005;309:1868–1871. doi: 10.1126/science.1113801. [DOI] [PubMed] [Google Scholar]
- 25.DiMaio F, Leaver-Fay A, Bradley P, Baker D, Andre I. Modeling symmetric macromolecular structures in Rosetta3. PLoS One. 2011;6 doi: 10.1371/journal.pone.0020450. [DOI] [PMC free article] [PubMed] [Google Scholar]
- 26.Stark JL, Mercier KA, Mueller GA, Acton TB, Xiao R, Montelione GT, Powers R. Solution structure and function of YndB, an AHSA1 protein from Bacillus subtilis. Proteins. 2010;78:3328–3340. doi: 10.1002/prot.22840. [DOI] [PMC free article] [PubMed] [Google Scholar]
- 27.Panaretou B, Siligardi G, Meyer P, Maloney A, Sullivan JK, Singh S, Millson SH, Clarke PA, Naaby-Hansen S, Stein R, Cramer R, Mollapour M, Workman P, Piper PW, Pearl LH, Prodromou C. Activation of the ATPase activity of hsp90 by the stress-regulated cochaperone aha1. Mol Cell. 2002;10:1307–1318. doi: 10.1016/s1097-2765(02)00785-2. [DOI] [PubMed] [Google Scholar]
- 28.Liu G, Shen Y, Atreya HS, Parish D, Shao Y, Sukumaran DK, Xiao R, Yee A, Lemak A, Bhattacharya A, Acton TA, Arrowsmith CH, Montelione GT, Szyperski T. NMR data collection and analysis protocol for high-throughput protein structure determination. Proc Natl Acad Sci USA. 2005;102:10487–10492. doi: 10.1073/pnas.0504338102. [DOI] [PMC free article] [PubMed] [Google Scholar]
- 29.Ruckert M, Otting G. Alignment of biological macromolecules in novel nonionic liquid crystalline media for NMR experiments. J Am Chem Soc. 2000;122:7793–7797. [Google Scholar]
- 30.Zweckstetter M, Bax A. Characterization of molecular alignment in aqueous suspensions of Pf1 bacteriophage. J Biomol NMR. 2001;20:365–377. doi: 10.1023/a:1011263920003. [DOI] [PubMed] [Google Scholar]
- 31.Grant TD, Luft JR, Wolfley JR, Tsuruta H, Martel A, Montelione GT, Snell EH. Small angle X-ray scattering as a complementary tool for high-throughput structural studies. Biopolymers. 2011;95:517–530. doi: 10.1002/bip.21630. [DOI] [PMC free article] [PubMed] [Google Scholar]
- 32.Lo Conte L, Chothia C, Janin J. The atomic structure of protein-protein recognition sites. J Mol Biol. 1999;285:2177–2198. doi: 10.1006/jmbi.1998.2439. [DOI] [PubMed] [Google Scholar]
- 33.Kastritis PL, Moal IH, Hwang H, Weng Z, Bates PA, Bonvin AM, Janin J. A structure-based benchmark for protein-protein binding affinity. Protein Sci. 2011;20:482–491. doi: 10.1002/pro.580. [DOI] [PMC free article] [PubMed] [Google Scholar]
- 34.Parsons LM, Grishaev A, Bax A. The periplasmic domain of To1R from Haemophilus influenzae forms a dimer with a large hydrophobic groove: NMR solution structure and comparison to SAXS data. Biochemistry. 2008;47:3131–3142. doi: 10.1021/bi702283x. [DOI] [PubMed] [Google Scholar]
- 35.Chen VB, Arendall WB, Headd JJ, Keedy DA, Immormino RM, Kapral GJ, Murray LW, Richardson JS, Richardson DC. MolProbity: all-atom structure validation for macromolecular crystallography. Acta Crystallogr D. 2010;66:12–21. doi: 10.1107/S0907444909042073. [DOI] [PMC free article] [PubMed] [Google Scholar]
- 36.Garrett DS, Seok YJ, Peterkofsky A, Gronenborn AM, Clore GM. Solution structure of the 40,000 Mr phosphoryl transfer complex between the N-terminal domain of enzyme I and HPr. Nat Struct Biol. 1999;6:166–173. doi: 10.1038/5854. [DOI] [PubMed] [Google Scholar]
- 37.Zwahlen C, Legault P, Vincent SJ, Greenblatt J, Konrat R, Kay LE. Methods for measurement of intermolecular NOEs by multinuclear NMR spectroscopy: Application to a bacteriophage λN-peptide/boxB RNA complex. J Am Chem Soc. 1997;119:6711–6721. [Google Scholar]
Associated Data
This section collects any data citations, data availability statements, or supplementary materials included in this article.