Abstract
Rab7 GTPase is known to regulate protein degradation and intracellular signaling via endocytic sorting and is also known to be involved in peripheral neurodegeneration. Mutations in the GTP-binding pocket of Rab7 cause Charcot–Marie–Tooth type 2B (CMT-2B) neuropathy. It has been suggested that the CMT-2B-associated Rab7 mutants may disrupt retrograde survival signaling by degrading the signaling endosomes carrying the nerve growth factor (NGF) and its TrkA receptor. Studying the cotrafficking of Rab7 and retrograde-TrkA endosomes in axons is therefore important to understand how Rab7 mutants affect the NGF signaling in neurons. However, tracking the axonal transport of Rab7 and TrkA with conventional microscopy and assigning the transport directionality in mass neuronal cultures pose some practical challenges. In this chapter, we describe the combination of a single-molecule imaging technique, pseudo-total internal reflection fluorescence (pTIRF) microscopy, with microfluidic neuron cultures that enables the simultaneous tracking of fluorescently labeled Rab7- and TrkA-containing endosomes in axons.
Keywords: Pseudo-total internal reflection fluorescence (pTIRF) microscopy, Charcot–Marie–Tooth type 2B (CMT-2B), Rab7, Nerve growth factor (NGF), TrkA, Endosomes, Axonal transport, Dorsal root ganglion (DRG), Polydimethylsiloxane (PDMS), Compartmentalized microfluidic chamber
1 Introduction
1.1 Functionality of Rab7 GTPase and Its Mutants in Neurodegeneration
The Rab protein family belongs to the Ras superfamily of small GTPases. Most Rabs are involved in membrane trafficking pathways and play important roles in regulating vesicle formation, actin- and tubulin-dependent vesicle movement, and membrane fusion [1]. Rab7 GTPase mediates protein degradation by sorting early endosomes to late endosomes and lysosomes along the endocytic pathway. Missense mutations in Rab7 cause Charcot–Marie–Tooth type 2B (CMT-2B) disease, a length-dependent axonal neuropathy [2, 3]. The CMT-2B phenotype suggests that Rab7 mutants may cause neuropathy by interrupting the survival signals carried by NGF/TrkA endosomes in motor and sensory neurons [4, 5]. Therefore, besides functioning as an endosomal marker, Rab7 could also affect the properties and the trafficking of endosomes that it is associated with [6].
The influence of Rab7 on endosomal trafficking in neurons can be more significant than in nonpolarized cell types, where substrates and machinery are readily accessible by diffusion. In neurons, where the axons typically extend beyond hundreds of microns in length, robust long-distance axonal transport is required for efficient communication between the axon terminals and the cell bodies. For instance, anterogradely transported TrkA (from the cell body to the terminal) is targeted to the plasma membrane of axon terminals for seeking out target-derived growth factors [7]; retrogradely transported TrkA (from the axon terminal to the cell body) may carry NGF-survival signals to regulate gene expression in the cell bodies [8]. Therefore, for a better understanding of how Rab7 affects retrograde NGF/TrkA trafficking in neurons, it is imperative to study the colocalization and cotrafficking of Rab7 with NGF/TrkA-signaling endosomes in axons along with the accurate assignment of the endosomal transport directionality (anterograde versus retrograde).
1.2 Resolving Directional Axonal Transport by Compartmentalized Microfluidic Chambers
The directionality of axonal cargo transport is difficult to be assigned in conventional mass neuronal culture, due to the limited imaging field provided by high-magnification objectives (100× or 60×) and the imaging-sensor dimensions. The typical imaging area of ~100 µm × 100 µm cannot cover the millimeter-long axons that randomly grow along all directions in a mass culture, thus making it difficult to assign the transport directionality. One way to solve this problem is to compartmentalize the neuronal culture by spatially segregating the axon terminals from the cell bodies. First introduced by Campenot and colleagues [9], compartmentalized microfluidic cell-culture chambers segregate the chemical environments of cell bodies and axons. However, early design of Campenot chambers, made of nontransparent Teflon, was laborious to implement and not compatible with high-resolution optical imaging. Recent advances in microfluidics led to transparent and biocompatible polydimethylsiloxane (PDMS) microfluidic chambers that are compatible with neuronal culture and optical imaging [8, 10]. Custom-designed compartmentalized PDMS microfluidic cell culture chambers are now commercially available.
1.3 Pseudo-TIRF Microscopy for Tracking Axonal Transport with High Temporal Resolution
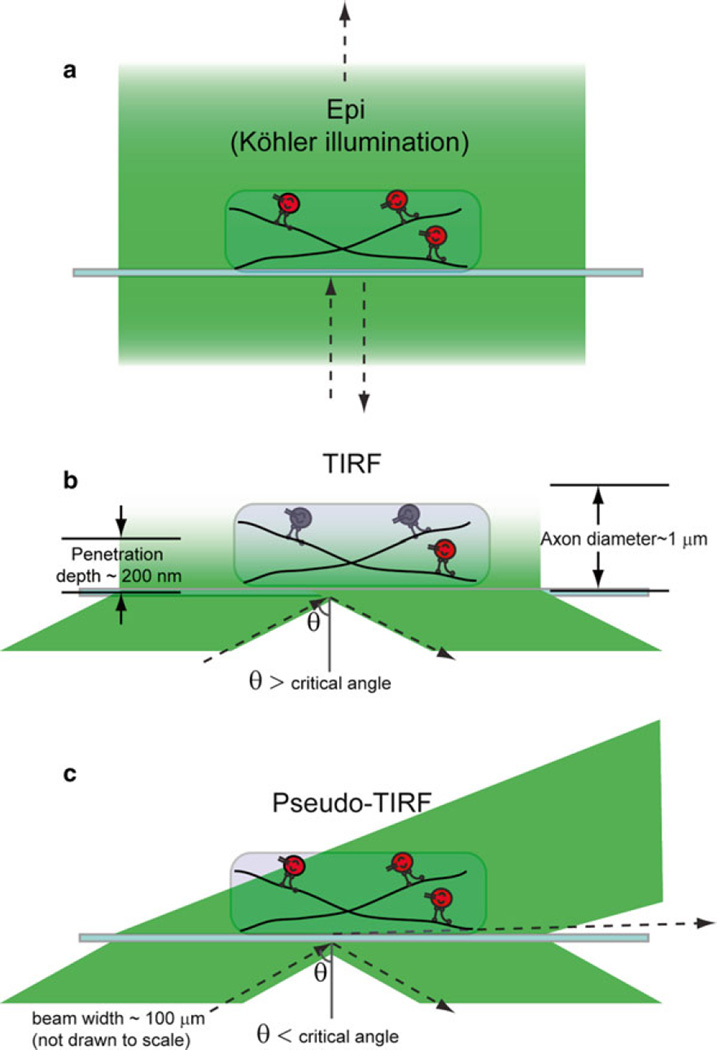
The colocalization and cotrafficking of axonal cargoes containing fluorescently labeled Rab7 and NGF/TrkA can be studied by multicolor live cell imaging. Conventional multicolor epi-illumination microscopy, where alternating fluorescence channels are often acquired sequentially, is not synchronous and typically limited to slow acquisition rates (~1 fps for two color imaging) due to the mechanical switching time of different filter cubes and weak signals. Such slow frame rates make it challenging to capture fast axonal transport, given the average speed of axonal endosome transport ~0.5–3.0 µm/s. Further, fluorescence signal from off-focal excitation degrades the signal-to-background (S/B) ratio (Fig. 1a) which limits the detection sensitivity of the fast-moving endosomes. Higher frame rates (>10 fps) can be achieved by using wide-field single-molecule fluorescence imaging such as total internal reflection fluorescence microscopy (TIRFM), where a spatially confined evanescent field is used to excite fluorescent probes with efficient background rejection. Multicolor TIRFM can be used to simultaneously detect multiple fluorescently labeled targets instead of the sequential manner in conventional epi-illumination microscopy. However, the penetration depth of the evanescent field is only ~200 nm, about 20 % of the diameter of a single axon. Therefore, TIRF microscopy is not able to capture the axonal transport within the whole volume of an axon (Fig. 1b). To obviate this limitation, we developed pseudo-TIRF (pTIRF) microscopy, where the incident angle of excitation light beam is tuned to be just below the critical angle, so that the penetration depth can be raised to about 1–2 µm. pTIRF microscopy enabled us to image fluorescent probes within the whole volume of axons with simultaneous multicolor imaging capability and single-molecule detection sensitivity (Fig. 1c).
Fig. 1.
Comparison of different illumination modes. (a) Epi-illumination (Köhler illumination) where a homogeneous excitation field passes the sample plane. Off-focal illumination and back reflection of the excitation light degrade the signal-to-background (S/B) ratio. (b) TIRF illumination where the incident angle of the excitation light is adjusted to the critical angle for total internal reflection. In such case, the penetration depth is about 200 nm and cannot cover the whole diameter of an axon. (c) pTIRF illumination where the incident angle of excitation light is adjusted to be slightly below the critical angle so that the penetrated beam depth of ~1–2 µm samples the whole volume of the axon
In this chapter, we describe the procedures for setting up a pTIRF microscope, labeling Rab7 and TrkA with fluorescent proteins in DRG neurons, culturing DRG in PDMS microfluidic devices, imaging axonal transport with multicolor pseudo-TIRF microscopy, and kymograph data analysis.
2 Materials
2.1 Pseudo-TIRF Microscope
The pseudo-TIRF illumination can practically be achieved on any microscope system implementing TIRF illumination by tuning the angle of incidence. Depending on the application, fluorescent probes with different color can be chosen and filter sets should be adjusted accordingly. Here we selected the light sources and optics for simultaneous detection of fluorescence from GFP (emission 500–550 nm) and mCherry (emission 575–650 nm).
Microscope frame: inverted microscope.
Excitation laser sources (488-nm laser line for GFP excitation; 561-nm laser line for mCherry excitation).
Detector: EMCCD camera.
Image acquisition and analysis software.
Table 1.
Specification of optics in the pTIRF microscopy setup
| Optics | Specs | |
|---|---|---|
| Objective | Magnification/N.A. | 100×/1.49 |
| Dichroic mirror (DM1) | Reflection/transmission | 488 nm/561 nm |
| Dichroic mirror (DM2) | Laser line reflection | 488 nm, 561 nm |
| Dichroic mirror (DM3) | Reflection/transmission | <550 nm/>550 nm |
| Emission filter (EM1) | Transmission | 525 ± 20 nm |
| Emission filter (EM2) | Transmission | 605 ± 20 nm |
| Lens (L) | Focal length | 40 cm |
| Lens (L1) | Focal length | 20 cm |
| Lens (L2) | Focal length | 20 cm |
Fig. 2.
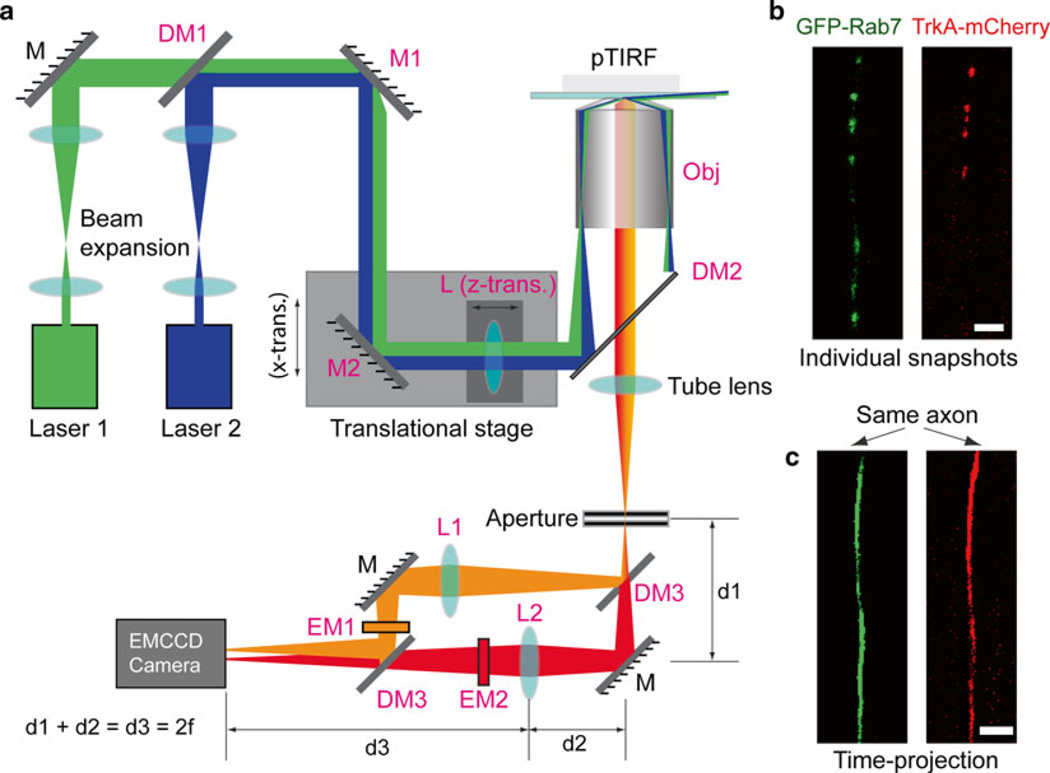
(a) Experimental layout of multicolor single-molecule fluorescence microscopy with pTIRF configuration. (b) Representative snapshots of the axonal transport of GFP-Rab7 (green) and TrkA-mCherry (red) containing endosomes within a cotransfected DRG axon in a microfluidic channel. Endosomes appeared as individual fluorescent dots. (c) Time projection of the time-stamped image series in (b) generated an axon trace outlined by all the transported endosomes during the data acquisition time window. Such a trace was used to generate kymographs. Scale bar: 5 µm
2.2 DRG Cell Culturing
Freshly dissociated DRG cell cultures. Detailed protocols for DRG dissociation from embryonic [11] or adult [12] rat have been reported.
Plating medium: DMEM (see Note 1), 10 % FBS, 100 U/ml Penicillin, 200 µg/ml Streptomycin, 50 ng/ml NGF.
Maintenance medium: Neurobasal, 1× B27 (see Note 2), 0.5 mM l-Glutamine, 100 U/ml Penicillin, 200 µg/ml Streptomycin, 50 ng/ml NGF (see Note 3).
Antimitotic medium: Neurobasal, 1× B27, 0.5 mM l-Glutamine, 4 µM ARA-C, 100 U/ml Penicillin, 200 µg/ml Streptomycin, 50 ng/ml NGF.
Imaging medium: CO2 independent medium (see Note 4).
Sterile poly-l-lysine coated 24 mm × 40 mm cover slips.
Nucleofector system and nucleofection buffer (Lonza).
GFP-Rab7 and TrkA-mCherry DNA plasmids (see Note 5).
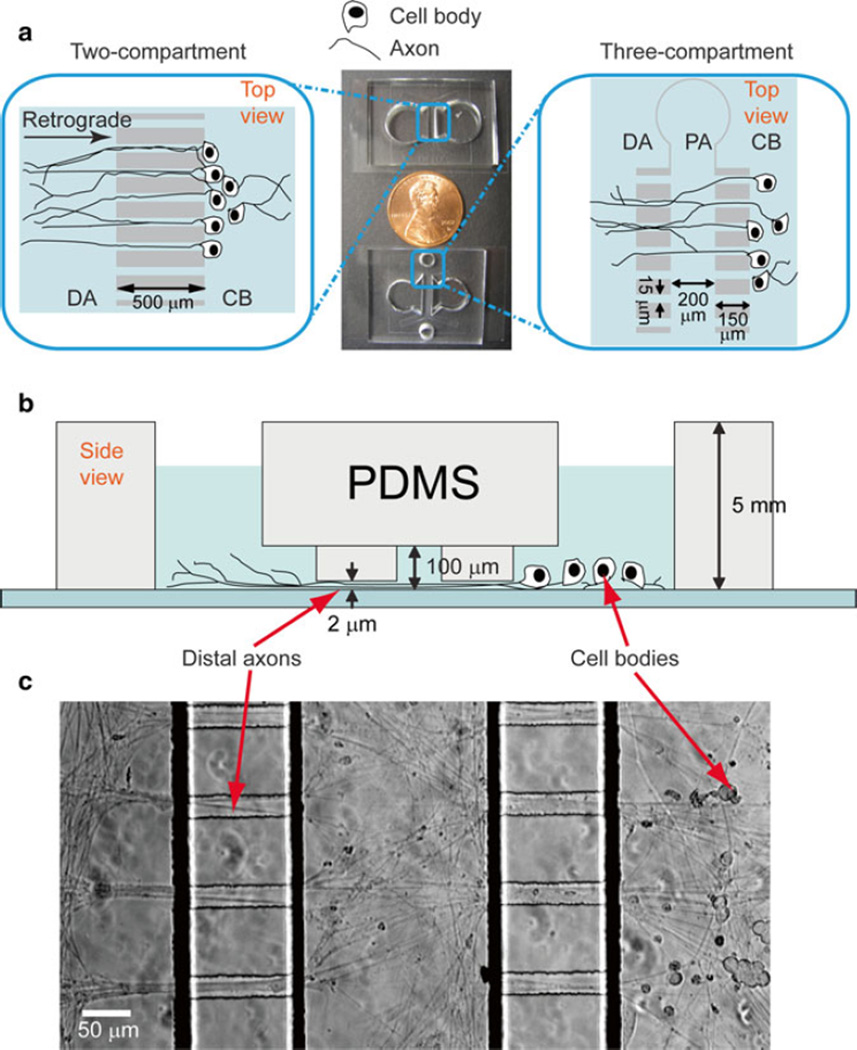
Compartmentalized PDMS microfluidic culture chamber. A detailed protocol of using this type of device has been reported in a previous chapter [13]. Alternatively, a fabrication protocol can be followed if custom-designed patterns are preferred [14]. The devices used in our current report are shown in Fig. 3a, b.
Fig. 3.
Microfluidic chambers for culturing dorsal root ganglia neurons. Top view (a) and (b) side view of microfluidic chambers for DRG cell culture. (c) Bright-field image of a microfluidic DRG neuron culture 4 days after cell plating. Figures were adopted from ref. [15] reproduced by permission of the Royal Society of Chemistry
3 Methods
3.1 Setting Up a Pseudo-TIRF Microscope
Expand the excitation laser beams (488 nm and 561 nm) to about 3 cm in diameter and coalign the collimated beams through the standard epi-illumination port along the optical axis of the objective. Mount the mirror M2 on an x-translation mount so that the excitation beams can be horizontally displaced from the optical axis in a controlled manner.
Place a bare coverslip on the microscope stage and make contact with the microscope objective using immersion oil. Focus the objective on the top surface of the coverslip. The laser beams passing the objective form a large illumination region on the ceiling above the microscope.
Install an achromatic converging lens “L” on the same x-translational mount as M2 but with an independent z-translational control, roughly one focal length away from the back focal plane of the objective. Adjust the z-translation of the lens “L” to focus the excitation laser beams at the back focal plane of the objective, which then collimates the laser beams. Optimal position of this lens minimizes the size of the laser illumination spot on the ceiling (see Note 6).
The angle of incidence of the excitation laser beams at the coverslip can be systematically varied by horizontally displacing the laser beams (x-translation of M2 and L) from the optical axis to the edge of the back aperture of the objective (see Note 7). Gradually increase the angle of incidence till the laser illumination spot on the ceiling moves down along the wall and just disappears due to total internal reflection.
Now decrease the angle of incidence till the laser illumination spot just appears on the wall. At this point the angle of incidence is just below the critical angle and corresponds to the pTIRF illumination mode (see Note 8).
3.2 DRG Transfection and Culturing in a PDMS Compartmentalized Chamber
One nucleofection reaction uses ~200,000 DRG cells, 20 µl buffer, and 0.4 µg of DNA plasmids (see Note 5).
Add DNA plasmids into the freshly made nucleofection buffer immediately before transfection.
Measure ~200,000 DRG cells into a sterile 1.5 ml vial. Spin down the cells at 150×g for 3 min and resuspend the cell pellet in 20 µl of nucleofection buffer/DNA mixture (see Note 9).
Transfer the cell/buffer/DNA mixture into an electroporation cuvette.
Transfect with appropriate electroporation protocols for neurons.
After transfection, add 1 ml warm plating medium in the cuvette. Transfer the cell suspension into a sterile 1.5 ml vial. Spin down at 150×g for 3 min.
In the meantime, assemble the PDMS microfluidic chamber by placing a device with the microchannel pattern facing down on a PLL-coated coverslip. Gently push the edges of the device to ensure sealing (see Note 10).
After centrifugation, remove the supernatant and resuspend the cell pellet with 10 µl fresh plating medium. Plate all cells into a microfluidic chamber (see Note 11).
Add 200 µl plating medium into the cell body compartment; add 100 µl plating medium into the distal axon compartment (see Note 12).
Change the plating medium to maintenance medium 3 h after plating. All cells should attach by this time. Add 500 µl plating medium into the cell body compartment; add 300 µl plating medium into the distant axon compartment (see Note 13).
Change to the antimitotic medium 36 h after plating.
Change back to the maintenance medium after incubation of the antimitotic medium for 24 h (see Note 14).
Change half of the medium every other day (see Note 15).
3.3 Imaging Axonal Transport of Endosomes with Pseudo-TIRF Microscopy
Culture DRG cells in the microfluidic devices for 4–6 days, by when most axons should grow across the microchannels (Figs. 3c and 4a, b).
Warm the microscope stage and objective to 37 °C.
Immediately before imaging, change the culture medium to CO2 independent medium (see Note 4).
Load the DRG culture on the heated microscope stage and wait for the temperature to equilibrate. Meanwhile, focus the objective to the surface of the coverslip (see Note 16).
Switch to laser light and move the microscope stage to a channel with fluorescently labeled axons. Fine tune the focus so that individual vesicles along axons can be seen (Fig. 2b). For healthy DRG cultures, most vesicles should be moving.
Find a region of interest (ROI) which displays one to three axons with a microchannel (see Note 17) and track the axonal transport of endosomes. Record the sides of cell body and distal axon so that the directionality of axonal transport can be assigned.
Start image acquisition and record the transport for a total of 600 frames with 100 ms exposure time per frame (10 fps). On average several tens of endosomes should be captured within this 1 min of imaging time.
Repeat image acquisition from a different ROI till the axons in different microfluidic channels are sampled (see Note 18).
Fig. 4.
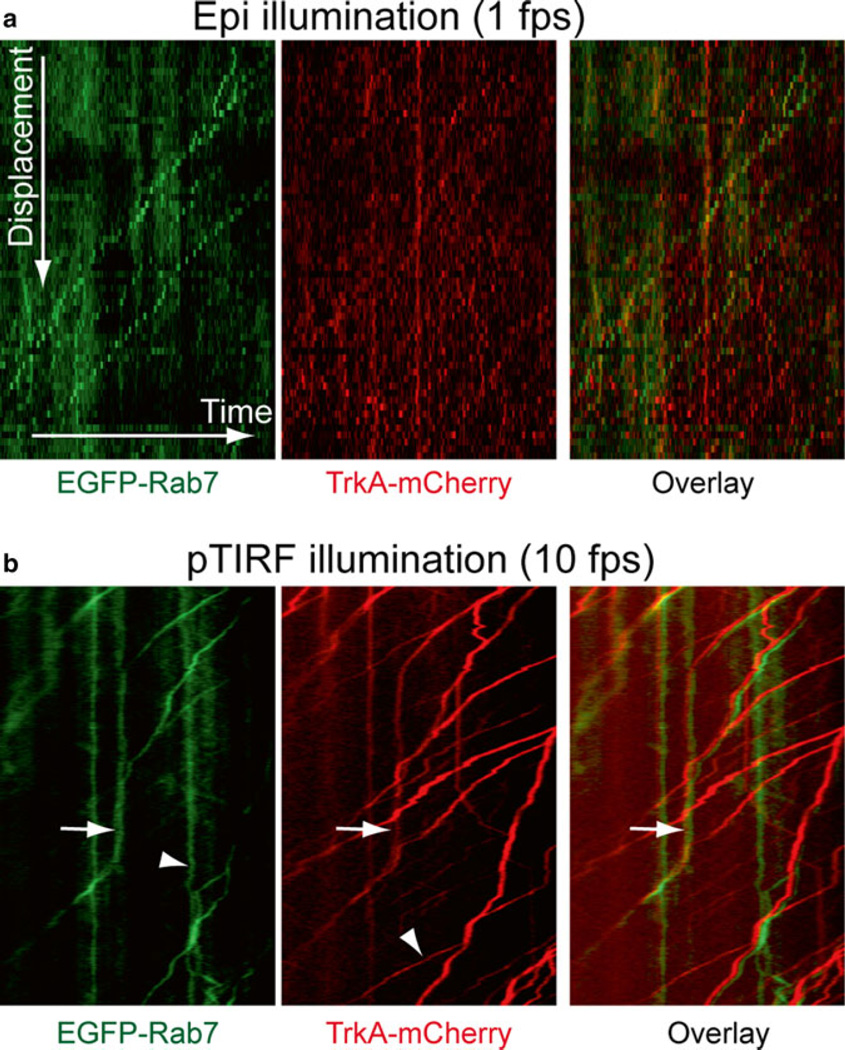
Kymographs depicting the axonal transport of endosomes containing EGFP-Rab7 (left), TrkA-mCherry (middle), and overlay (right). (a) Epi-illumination imaging using a Leica DMI6000B microscope with a frame rate of 1 fps. The slow frame rate resulted in the apparent dotted lines for each trajectory in the kymograph. (b) pTIRF imaging with a frame rate of 10 fps. All the trajectories in the kymograph appeared much smoother. The red and green images were slightly shifted for clear visualization purpose in the overlay image to the right. Trajectories of endosomes with both Rab7 and TrkA were marked by arrow heads. Note that some endosomes did not contain both Rab7 and TrkA (arrows).
3.4 Kymograph Data Analysis
Export the time-stamped images of axonal transport to an image stack.
Use the “Kymograph” plug-in (J. Rietdorf and A. Seitz) in ImageJ to generate kymographs, which show the displacement of endosomes along an axon at different times. As each frame in a time-stamped image series is a snapshot of the position of endosomes along axons (Fig. 2b), the maximum intensity of each frame can be projected on a time-projection image to display the axon traces (Fig. 2c). Movements of individual endosomes along each axon trace show up as individual trajectories on the kymograph (see Note 19).
A representative kymograph from the axonal transport of endosomes containing Rab7-GFP and TrkA-mCherry is shown in Fig. 4c, d. Notice that trajectories in the kymographs generated from epi-illumination show apparent dotted lines due to low frame rate (Fig. 4c) while high frame rate pTIRF microscopy gives smooth lines (Fig. 4d).
Footnotes
The l-glutamine component in DMEM will decay over time. Use before the expiration date.
Stock solution comes as 50×.
Store NGF aliquots in −80 °C freezer and thaw it only before preparing culture media. Repeated freeze–thaw of NGF will degrade its bioactivity.
Alternatively, an on-stage CO2 chamber can be used for live cell imaging. In such a case, no CO2 independent medium is required.
High-purity maxi-prep DNA plasmids are critical for successful transfection.
The beam diameter at the sample depends on the beam diameter at the lens L, the focal length of L, and the focal length of the objective. The variables are chosen so as to provide uniform illumination over the imaging field ~80–150 µm.
The center position corresponds to the epi-mode; the edge position corresponds to the TIRF mode.
Before each experiment with neuronal culture, fine tune the incident angle of excitation beam to maximize the signal-to-background ratio.
Pipette the cell pellet gently. Too much force is damaging to the cell.
Make sure both PDMS microfluidic device and the PLL-coated coverslip are sterile.
Plating low-density culture is not good for cell recovery and growth.
The pressure difference between the cell body and distal axon compartments facilitates axons to grow across the channel.
More medium provides enough nutrients to the cells.
Remove the antimitotic medium after 1 day. Long-time incubation of antimitotic medium will deteriorate the DRG cell health.
Make sure the medium does not dry out.
The edges of the microchannels can help locate the rough focal position under white light.
Try not to select ROIs with too dense axons or axons that cross over each other. Both cases will make it difficult to track the movement of single endosomes.
Make sure medium within the cell culture does not dry out during data acquisition on the heated stage.
We have developed a data acquisition software using MATLAB where kymographs can be generated with a batch mode operation.
References
- 1.Stenmark H, Olkkonen VM. The Rab GTPase family. Genome Biol. 2001;2(5) doi: 10.1186/gb-2001-2-5-reviews3007. REVIEWS3007. [DOI] [PMC free article] [PubMed] [Google Scholar]
- 2.Spinosa MR, Progida C, De Luca A, Colucci AM, Alifano P, Bucci C. Functional characterization of Rab7 mutant proteins associated with Charcot-Marie-Tooth type 2B disease. J Neurosci. 2008;28(7):1640–1648. doi: 10.1523/JNEUROSCI.3677-07.2008. [DOI] [PMC free article] [PubMed] [Google Scholar]
- 3.Cogli L, Piro F, Bucci C. Rab7 and the CMT2B disease. Biochem Soc Trans. 2009;37(Pt 5):1027–1031. doi: 10.1042/BST0371027. [DOI] [PubMed] [Google Scholar]
- 4.Saxena S, Bucci C, Weis J, Kruttgen A. The small GTPase Rab7 controls the endosomal trafficking and neuritogenic signaling of the nerve growth factor receptor TrkA. J Neurosci. 2005;25(47):10930–10940. doi: 10.1523/JNEUROSCI.2029-05.2005. [DOI] [PMC free article] [PubMed] [Google Scholar]
- 5.Deinhardt K, Salinas S, Verastegui C, Watson R, Worth D, Hanrahan S, Bucci C, Schiavo G. Rab5 and Rab7 control endocytic sorting along the axonal retrograde transport pathway. Neuron. 2006;52(2):293–305. doi: 10.1016/j.neuron.2006.08.018. [DOI] [PubMed] [Google Scholar]
- 6.Zhang K, Fishel Ben Kenan R, Osakada Y, Xu W, Sinit RS, Chen L, Zhao X, Chen JY, Cui B, Wu C. Defective axonal transport of Rab7 GTPase results in dysregulated trophic signaling. J Neurosci. 2013;33(17):7451–7462. doi: 10.1523/JNEUROSCI.4322-12.2013. [DOI] [PMC free article] [PubMed] [Google Scholar]
- 7.Ascano M, Richmond A, Borden P, Kuruvilla R. Axonal targeting of Trk receptors via transcytosis regulates sensitivity to neurotrophin responses. J Neurosci. 2009;29(37):11674–11685. doi: 10.1523/JNEUROSCI.1542-09.2009. [DOI] [PMC free article] [PubMed] [Google Scholar]
- 8.Cui B, Wu C, Chen L, Ramirez A, Bearer EL, Li WP, Mobley WC, Chu S. One at a time, live tracking of NGF axonal transport using quantum dots. Proc Natl Acad Sci U S A. 2007;104(34):13666–13671. doi: 10.1073/pnas.0706192104. [DOI] [PMC free article] [PubMed] [Google Scholar]
- 9.Ure DR, Campenot RB. Retrograde transport and steady-state distribution of 125I-nerve growth factor in rat sympathetic neurons in compartmented cultures. J Neurosci. 1997;17(4):1282–1290. doi: 10.1523/JNEUROSCI.17-04-01282.1997. [DOI] [PMC free article] [PubMed] [Google Scholar]
- 10.Taylor AM, Blurton-Jones M, Rhee SW, Cribbs DH, Cotman CW, Jeon NL. A microfluidic culture platform for CNS axonal injury, regeneration and transport. Nat Methods. 2005;2(8):599–605. doi: 10.1038/nmeth777. [DOI] [PMC free article] [PubMed] [Google Scholar]
- 11.Moore SW, Lai Wing Sun K, Xie F, Barker PA, Conti M, Kennedy TE. Soluble adenylyl cyclase is not required for axon guidance to netrin-1. J Neurosci. 2008;28(15):3920–3924. doi: 10.1523/JNEUROSCI.0547-08.2008. [DOI] [PMC free article] [PubMed] [Google Scholar]
- 12.Owen DE, Egerton J. Culture of dissociated sensory neurons from dorsal root ganglia of postnatal and adult rats. Methods Mol Biol. 2012;846:179–187. doi: 10.1007/978-1-61779-536-7_16. [DOI] [PubMed] [Google Scholar]
- 13.Darbinyan A, Pozniak P, Darbinian N, White MK, Khalili K. Compartmentalized neuronal cultures. Methods Mol Biol. 2013;1078:147–152. doi: 10.1007/978-1-62703-640-5_13. [DOI] [PMC free article] [PubMed] [Google Scholar]
- 14.Park JW, Vahidi B, Taylor AM, Rhee SW, Jeon NL. Microfluidic culture platform for neuroscience research. Nat Protoc. 2006;1(4):2128–2136. doi: 10.1038/nprot.2006.316. [DOI] [PubMed] [Google Scholar]
- 15.Zhang K, Osakada Y, Vrljic M, Chen L, Mudrakola HV, Cui B. Single-molecule imaging of NGF axonal transport in microfluidic devices. Lab Chip. 2010;10:2566–2573. doi: 10.1039/c003385e. [DOI] [PMC free article] [PubMed] [Google Scholar]


