Abstract
The photoreceptor cryptochrome 2 (CRY2) has become a powerful optogenetic tool that allows light-inducible manipulation of various signaling pathways and cellular processes in mammalian cells with high spatiotemporal precision and ease of application. However, it has also been shown that the behavior of CRY2 under blue light is complex, as the photoexcited CRY2 can both undergo homo-oligomerization and heterodimerization by binding to its dimerization partner CIB1. To better understand the light-induced CRY2 activities in mammalian cells, this article systematically characterizes CRY2 homo-oligomerization in different cellular compartments, as well as how CRY2 homo-oligomerization and heterodimerization activities affect each other. Quantitative analysis reveals that membrane-bound CRY2 has drastically enhanced oligomerization activity compared to that of its cytoplasmic form. While CRY2 homo-oligomerization and CRY2-CIB1 heterodimerization could happen concomitantly, the presence of certain CIB1 fusion proteins can suppress CRY2 homo-oligomerization. However, the homo-oligomerization of cytoplasmic CRY2 can be significantly intensified by its recruitment to the membrane via interaction with the membrane-bound CIB1. These results contribute to the understanding of the light-inducible CRY2-CRY2 and CRY2-CIB1 interaction systems and can be used as a guide to establish new strategies utilizing the dual optogenetic characteristics of CRY2 to probe cellular processes.
Keywords: optogenetics, light control, cryptochrome 2, oligomerization, CRY2-CIB1 dimerization
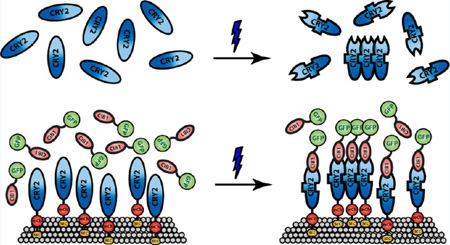
Graphical Abstract
Optogenetics uses genetically encoded light-sensitive proteins to achieve light-inducible spatial and temporal control of signaling events and cellular processes in living cells.1–3 Cryptochromes, a family of blue light-sensitive photoreceptors found in all three major evolutionary lineages from bacteria to plants and animals,4–6 have recently drawn the attention of the optogenetics field due to their ease of application that require no exogenous cofactors, low-level of activation light, and reversibility. Initially characterized from the plant Arabidopsis thaliana, cryptochrome 2 (CRY2) mediates light regulation of cell elongation and photoperiodic flowering.7–9 CRY2 uses the ubiquitously expressed flavin as its chromophore to absorb blue light in the range of 430–490 nm.10 Kennedy et al. showed that, upon blue light activation, the photoexcited CRY2 changes its conformation and can rapidly heterodimerize with its binding partner CRY-interacting bHLH 1(CIB1) within subseconds after light illumination in mammalian cells.11 Upon blue light withdrawal, the CRY2-CIB1 pair dissociates with a half-life of ~5.5 min, and this light-activated interaction can be repeatedly induced over many cycles.11 Within the last five years, the CRY2-CIB1 system has been employed in efforts to manipulate a wide array of intracellular signals in mammalian cells.11–18 Some notable examples include precisely controlling the plasma membrane phosphoinositide metabolism,12 regulating specific gene transcription in neurons and in living animals,16 or optogenetically activating the Raf/MEK/ERK cascade to trigger neurite outgrowth in PC12 cells in the absence of growth factors.18
While having great potentials in optogenetic applications, light-induced CRY2-CIB1 interaction, however, is complicated by the fact that the photoexcited CRY2 can also self-oligomerize to form clusters. The oligomeric characteristic of CRY2 upon blue light activation was previously observed in plant cells, where it was hypothesized that the photoexcited CRY2 formed photobodies to increase the local concentration of the photoreceptor and facilitate the interaction of CRY2 with other proteins.19,20 However, the application of this property in mammalian cells has only been reported within the past two years.21 Nevertheless, the oligomerization effect of CRY2 has rapidly gained popularity as a new method to modulate protein–protein interactions and cell functions. Cytosolic CRY2 clustering effect was employed to induce cytoskeletal remodeling through the RhoA pathway in HEK293T cells,21 modulate the activity of the serine/threonine-specific protein kinase RAF,22 control cell polarity and migration through an optically controlled fibroblast growth factor receptors construct,23 or to inhibit target signaling proteins that modulate the cytoskeleton, lipid signaling, and cell cycle in HeLa cells.24 Most recently, a new variant of CRY2 has been developed to enhance the clustering effect of the protein with potential application in new optogenetic studies.25
As both CRY2 homo-oligomerization and CRY2-CIB1 heterodimerization are getting widely utilized in optogenetic studies, it is now imperative to understand how the two light-dependent responses of CRY2 might interact or interfere with each other in an optogenetic system. In this work, we have systematically characterized CRY2 oligomerization under various conditions and in the absence or presence of interacting CIB1 proteins. We found that compared to cytoplasmic CRY2, membrane-bound CRY2 oligomerizes more readily, resulting in dramatic cluster formation on various cellular membranes including the plasma membrane, endoplasmic reticulum (ER), and mitochondrial outer membrane. The presence of CIB1 protein can either inhibit or facilitate CRY2 oligomerization. On the one hand, some bulky CIB1 fusion proteins can completely abolish CRY2 cluster formation. On the other hand, cytoplasmic CRY2 can be recruited to the membrane via CIB1 binding to achieve enhanced oligomerization activity. These results will be very useful in the design of new CRY2-based optogenetic systems where the light-induced behavior of CRY2 is more predictable, especially in scenarios where enhanced CRY2 oligomerization or exclusive CRY2-CIB1 heterodimerization is desired.
RESUTLS AND DISCUSSION
Membranous CRY2 Oligomerizes Much More Readily than Its Cytosolic Form
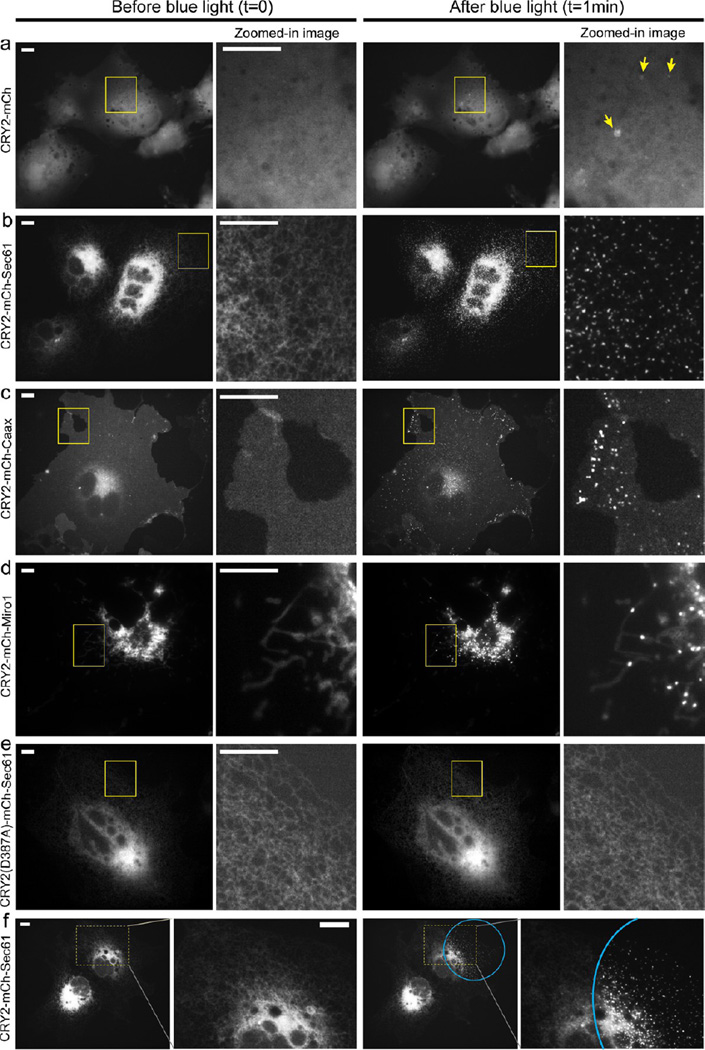
It has been reported that cytoplasmic CRY2 can oligomerize upon blue light activation to form prominent clusters in mammalian cells.21 We repeated the experiment by expressing CRY2-mCh or CRY2-GFP in COS-7 and exposing the cells to blue light stimulation (Figure 1a for CRY2-mCh and Figure S1 in Supporting Information for CRY2-GFP). In this study, we employed the photolyase homology region (PHR) of CRY2 (amino acids 1–498) and a truncated version of CIB1 (amino acids 1–170), as these constructs have been widely used in CRY2-CIB1 optogenetic studies in mammalian cells.11–16,18,21 Cells were illuminated with intermittent blue light pulses at 200 ms exposure every 5 s (9.7 × 10³ mW/cm2, 460–480 nm) for a total duration of 1 to 10 min. Under blue light illumination, we could only detect CRY2-mCh clusters in about 20% of the COS-7 cells after 5 min of intermittent blue light exposure (n = 59). Furthermore, even in the cells where CRY2 oligomerization could be detected, the number of clusters in each cell was typically very few (average 6.4 small clusters per cell, n = 20). The vast majority of CRY2 were not incorporated into the clusters despite blue light illumination for as long as 10 min as CRY2 retained the diffusive cytoplasmic distribution. Similar results were also observed in 3T3 and HEK293T cells (Figure S2, Supporting Information), indicating that the oligomerization of cytoplasmic CRY2 did not occur robustly and reliably in our experimental conditions. This result is consistent with similar observations reported in previous studies.24,25
Figure 1.
Membrane-bound CRY2 exhibit drastically enhanced oligomerization upon blue light stimulation. The cells were illuminated with intermittent 200 ms blue light pulse at every 5 s. (a) Cytoplasmic CRY2-mCh forms a few clusters upon blue light activation (yellow arrows). (b–d) Blue light stimulation induces dramatic cluster formation when CRY2 is tethered to various cellular membranes such as the ER membrane (b), plasma membrane (c), and mitochondrial outer membrane (d). (e) A light-insensitive mutant CRY2(D387A) localized on the ER membrane (CRY2(D387A)-mCh-Sec61) does not form clusters under blue light activation. (f) Spatial control of CRY2 clustering in the specific subcellular region (marked with a blue circle). Scale bars, 10 µm.
On the other hand, we found that CRY2 exhibited dramatic oligomerization when it was tethered to cellular membranes (Figure 1b–d). First, we attached CRY2 to the outside of the ER membrane by expressing CRY2-mCh-Sec61TM in COS-7 cells, where Sec61TM is the transmembrane domain of the ER-targeting protein Sec61.26 For simplification, the plasmid will be denoted as CRY2-mCh-Sec61 from here on. Before blue light stimulation, the CRY2 proteins were evenly distributed on the ER network (Figure 1b). Within seconds after blue light exposure, the ER-bound CRY2 drastically coalesced into hundreds to thousands of bright clusters in the cell. The cluster formation visibly depleted the diffusive CRY2-mCh-Sec61 on the ER membrane after 1 min of intermittent blue light exposure, rendering the original reticular structure of the ER network indiscernible. This dramatic CRY2 oligomerization was consistently observed in every transfected COS-7 cell.
The enhanced oligomerization of membranous CRY2 was not only observed on the ER membrane, but also on other cellular membranes including the inner plasma membrane and outer mitochondria membrane. As shown in Figure 1c, CRY2 was targeted to the inner plasma membrane via a 15-residue Caax motif (CRY2-mCh-Caax).27 Similar to the behavior of CRY2 bound to the ER membrane, CRY2-mCh-Caax rapidly and dramatically oligomerized into hundreds of bright clusters in just seconds after blue light exposure. We also anchored CRY2 to the outer membrane of mitochondria via Miro1TM, a 23-residue sequence of the mitochondria targeting sequence Miro1.28 For simplification, the Miro1TM plasmid will be denoted as Miro1 from here on. Before blue light stimulation, CRY2-mCh-Miro1 was evenly distributed along the outer mitochondria membrane and illustrated the rod-like shapes of mitochondria. Again, blue light illumination led to the formation of many CRY2 clusters on the outer membrane of mitochondria (Figure 1d).
We confirmed that membranous CRY2 oligomerization occurred exclusively due to blue light-induced activation of CRY2 through several control experiments. First, the light-induced oligomerization is strongly dependent on the wave-length of the light, as green light illumination (~550 nm) did not induce CRY2 oligomerization (Figure S3, Supporting Information). Second, the oligomerization of CRY2 occurs independently of the fluorescent protein conjugated to CRY2, as both CRY2-mCh and CRY2-GFP could form clusters under blue light activation (Figure 1a and Figure S1, Supporting Information). Third, a light-insensitive CRY2 mutant tethered to the ER membrane, CRY2(D387A)-mCh-Sec61,9 failed to form clusters under blue light exposure (Figure 1e). Finally, when we reduced the blue light illumination area to a region much smaller than the individual cell size, the oligomerization accordingly only occurred within the illuminated subcellular region of the cell (Figure 1f).
The Oligomerization of Membranous CRY2 Is Highly Dynamic and Reversible
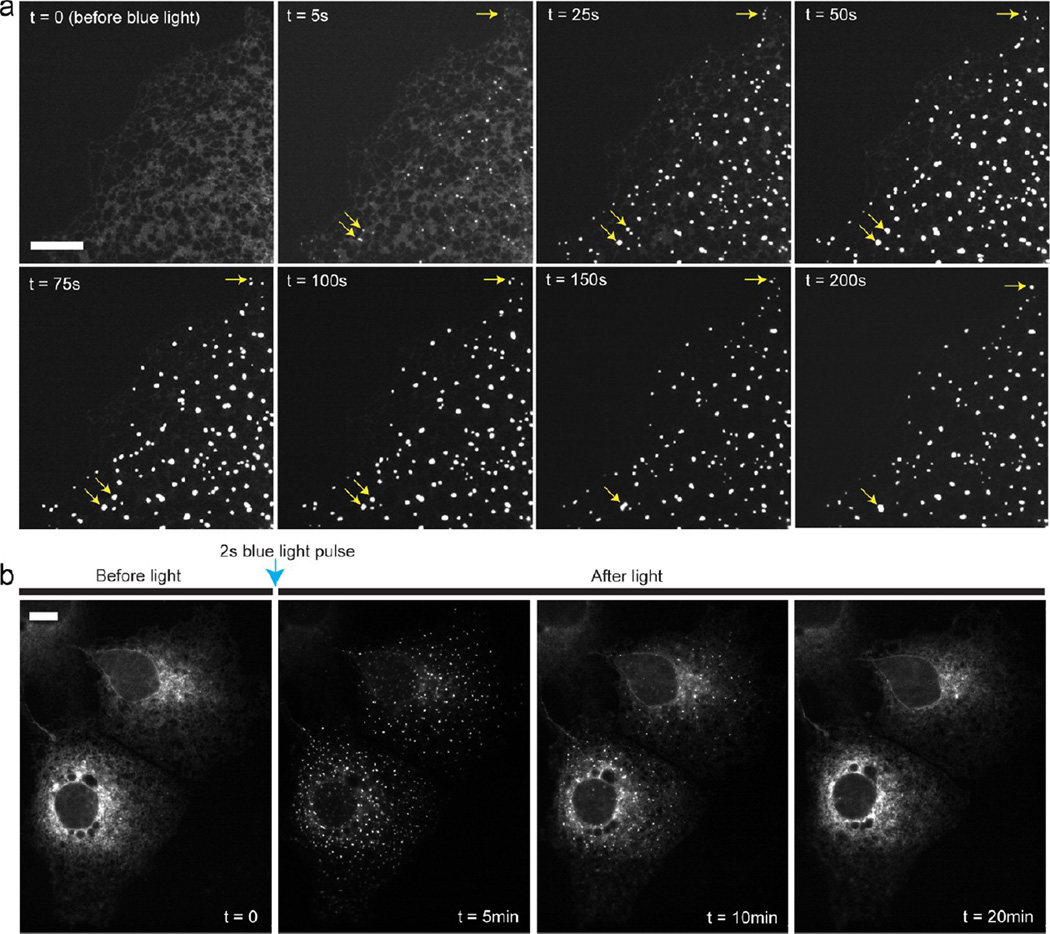
Light-induced CRY2 clusters on the ER membrane were found to be highly dynamic. For this experiment, COS-7 cells were activated by a single 2 s blue light pulse (9.7 × 10³ mW/cm2), followed by time-lapse imaging of CRY2-mCh-Sec61 using green light excitation (550 nm, 200 ms exposure at every 5 s). As shown in Figure 2a, small “seeds” of CRY2 clusters appeared only 5 s after the blue light pulse, while the majority of CRY2s were still diffusive on the ER network. However, these “seeds” quickly grew in size, number, and intensity, visibly depleting the diffusive CRY2 within 50 s after blue light activation. It is interesting to note that these clusters can continue to grow not only from incorporating the additional “free” CRY2 but also from merging with other individual CRY2 clusters to form higher order oligomers (shown by the yellow arrows in Figure 2a). Similar cluster characteristics such as cluster formation, growth, and merging were found in the plasma membrane and the outer membrane of mitochondria (Figure S4, Supporting Information). We also observed that membrane-bound CRY2 cluster formation was fully reversible, which is in agreement with the reported oligomeric features of cytoplasmic CRY2 photoactivation.21 After the single blue light pulse, CRY2 clusters quickly formed on the ER membrane and then completely dissociated back to the preblue light diffusive state within approximately 20 min (Figure 2b).
Figure 2.
Light-induced CRY2 clusters are dynamic and reversible. COS-7 cells were transfected with CRY2-mCh-Sec61. (a) CRY2 clusters grow significantly in number, size, and intensity over several minutes after a single 2 s pulse blue light activation. Some clusters merge together to form higher order oligomers (yellow arrows). (b) CRY2 clusters, clearly visible at t = 5 min and less at t = 10 min, completely dissociate back to the diffusive ER distribution approximately 20 min after the single 2 s pulse blue light activation. Scale bars, 10 µm.
Membranous CRY2 Oligomerization Is Concentration Dependent and Occurs Readily at Low Level of Light
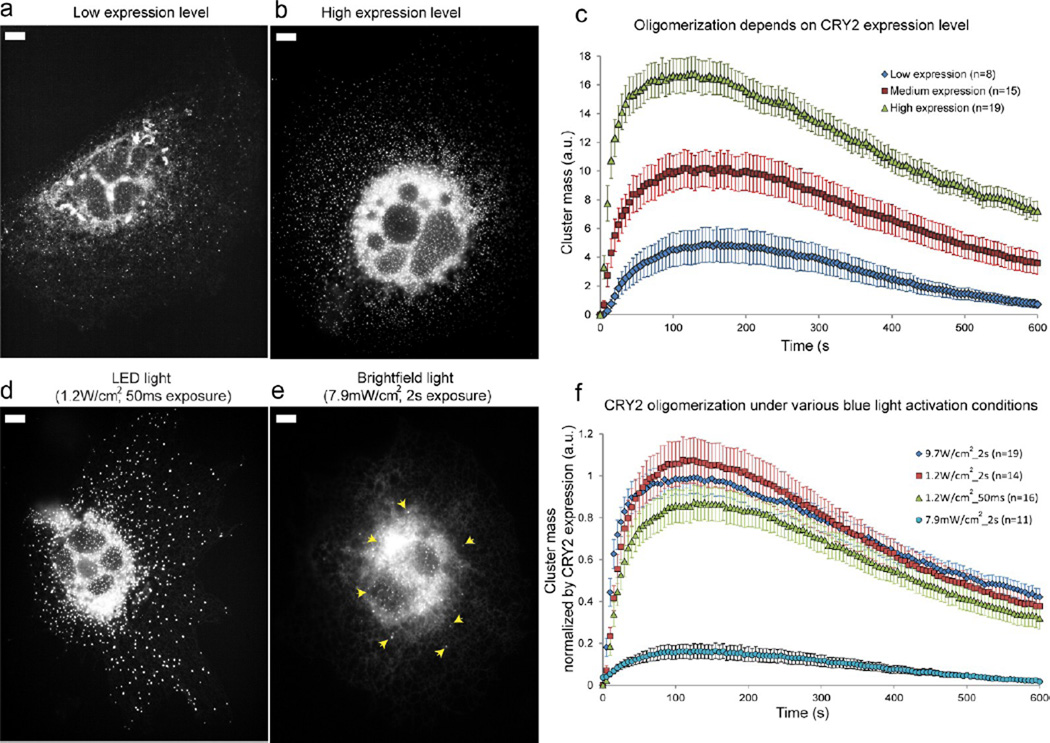
As an oligomerization reaction is expected to be dependent on the protein concentration, we examined the effect of CRY2 expression level on its oligomerization activity on the ER membrane. Indeed, CRY2 oligomerization activity was strongly dependent on the expression level of CRY2-mCh-Sec61, where low CRY2 concentration led to significantly lower oligomerization activity compared to that of cells with higher CRY2 concentration (Figure 3a–b).
Figure 3.
CRY2 oligomerization depends on the expression level of CRY2 and occurs readily at low level of blue light stimulation. Cells were activated with a single 2 s blue light pulse unless noted otherwise. The images were taken at 150 s after the blue light pulse. (a) A transfected cell with low CRY2-mCh-Sec61 expression has many CRY2 clusters, but the diffusive background is still visible after 150 s. (b) A transfected cell with high CRY2-Ch-Sec61 expression shows dramatic cluster formation. The diffusive background is invisible after 150 s. (c) Quantification of CRY2 cluster formation using an automatic Matlab algorithm. The peak of the cluster mass clearly shows that high CRY2 expression induces more CRY2 oligomerization compared to that of cells with low CRY2 expression. (d) The CRY2 oligomerization activity does not show significant reduction when the total blue light power is reduced by 300 times. (e) The CRY2 cluster formation is visibly decreased (clusters shown as yellow arrowheads) when the blue light intensity is reduced by 1200 times compared with normal stimulation condition. (f) Quantification of CRY2 cluster formation under different blue light intensities and exposure duration conditions. Error bars represent the standard deviation of the mean. Scale bar, 10 µm.
In order to better understand the characteristic of light-induced CRY2 oligomerization, we developed a custom-written Matlab program to quantify the formation of CRY2 clusters on the membrane (data processing details in Supporting Information and Figure S5). COS-7 cells transfected with CRY2-mCh-Sec61 were illuminated with a single 2 s pulse of blue light at the first imaging frame to activate CRY2 oligomerization. Subsequently, the blue light was turned off, and a green light was used to excite the mCherry fluorescent protein in order to monitor the formation, growth, and dissociation of CRY2 clusters. As the CRY2 clusters vary in size and brightness, and many clusters can subsequently merge together to form larger oligomers, we not only counted the number of CRY2 clusters in the cell but also tracked the total cluster mass (cluster intensity) of all CRY2 clusters in each cell at every 5 s for a total duration of 10 min. The total cluster mass was normalized by the cell size to account for the cell-to-cell size variation. This quantification method thus took into account both the number and the brightness of the clusters and can be used to systematically quantify CRY2 oligomerization across different cells. The algorithm to identify clusters is very reliable and can automatically detect at least 90% of the visible clusters in the cell (Figure S5, Supporting Information). However, we note that due to the limitation of fluorescence microscopy, we may not detect every CRY2 cluster in the cell, especially very small clusters at the initial oligomerization stage.
After measuring the oligomerization activity in 42 cells with different CRY2 expression levels, the cluster mass showed a linear relationship with the CRY2 expression level (Figure S6, Supporting Information). The cells were grouped into three categories based on the average CRY2-mCh-Sec61 expression level in each cell: low, medium, and high (see Materials and Methods for classification criteria). As seen in Figure 3c, the total cluster mass in all three categories shows a quick rise in tens of seconds and a peak around 100–200 s, signifying the formation of clusters after the blue light pulse. The peak is followed by a slow decay in 10 min or longer due to the dissociation of the clusters after blue light withdrawal. The higher expression category clearly shows a higher oligomerization propensity as indicated by a higher peak value in cluster mass. The expression level-dependence of CRY2 oligomerization is also evident from quantifications of the number of cluster per cell area and the average cluster intensity (Figure S7, Supporting Information).
We also compared the dynamic of CRY2 cluster formation and dissociation on the ER membrane versus that on the plasma membrane under identical illumination conditions (Figure S8, Supporting Information). Cells were activated with a single 2 s blue light pulse followed by time-lapse imaging of the mCherry fluorescence signal. The CRY2 homo-oligomerization on the plasma membrane has a slower dynamic compared to the that of the CRY2 clusters formed on the ER membrane: the cluster mass takes a longer time to reach the peak value and decays slower after blue light withdrawal. This variance may be due to the differences in CRY2 diffusion characteristic in distinct protein and/or lipid composition of the ER membrane vs that of the plasma membrane.
We found that CRY2 oligomerization was very robust and required low level of blue light for activation (Figure 3d–f). We first varied the blue light power by adjusting both the intensity of the microscope light source (reducing from 9.7 × 10³ mW/cm2 to 1.2 × 10³ mW/cm2) and the blue light exposure time (reducing from a 2 s pulse to a 50 ms pulse). The changes effectively reduced the total blue light power delivered to the cell by 300 times compared with the normal imaging conditions. As discussed previously, the cell-to-cell variation in CRY2 concentration alone can significantly affect the oligomerization activity (Figure 3c). Therefore, for this quantification analysis we only selected cells with comparable CRY2 expression level. Furthermore, the CRY2 oligomerization level in each cell was normalized to the CRY2 concentration based on a calibration curve established from the oligomerization measurement in 42 cells (Figure S6, Supporting Information). This method thus removed the CRY2 expression dependency and ensured that any change in the CRY2 clustering level was indeed due to the change in the blue light illumination condition. As seen in Figure 3d and f, we observed a very slight decrease in CRY2 cluster formation when the total blue light power was reduced by 300 times. In order to further decrease the illumination light power, we replaced the fluorescence light by the microscope brightfield light source filtered through a blue bandpass filter (Chroma, 460/20), which effectively reduced the total blue light power by about 1,200 times lower than the normal imaging condition (2 s blue light pulse, 7.9 mW/cm2). CRY2 oligomerization was still clearly observed at this low light intensity (Figure 3e). However, there was significant reduction in the oligomerization activity, where the peak value of the normalized cluster mass in the cell was noticeably suppressed (Figure 3f).
CRY2 Oligomerization and CRY2-CIB1 Heterodimerization Coexist under Blue Light Activation
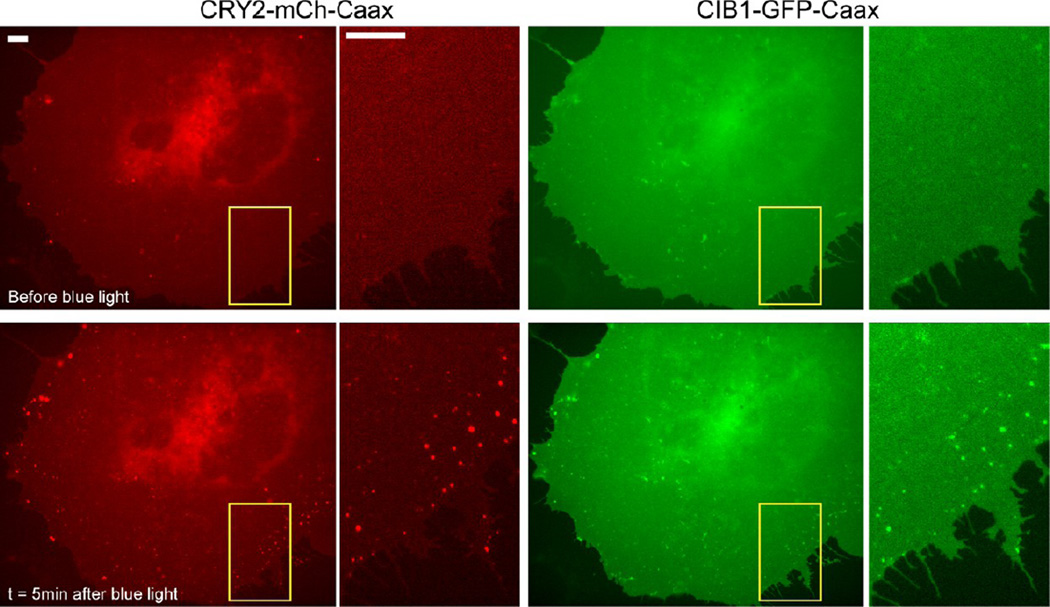
We found that light-induced CRY2 oligomerization and CRY2-CIB1 binding could happen simultaneously. When COS-7 cells were cotransfected with CRY2-mCh-Caax and CIB1-GFP-Caax, both proteins initially appeared diffusive on the cytoplasmic membrane. Upon blue light illumination, not only was CRY2-mCh-Caax found to form oligomeric clusters but CIB1-GFP-Caax was also found to accumulate in the same clusters (Figure 4). As a control experiment, CIB1-GFP-Caax alone did not form clusters when activated with blue light. Similar observation of CRY2-CIB1 coclustering was also seen in cells cotransfected with full length CIB1(1–335aa)-GFP-Caax and CRY2-mCh-Caax (Figure S9, Supporting Information). This result suggests that the photoexcited CRY2 has two separate binding sites for CRY2-CRY2 oligomerization and heterodimerization with CIB1, thus allowing the two types of interactions to occur concurrently. This observation is supported by the previous report showing cytoplasmic CRY2 and cytoplasmic CIB1 coclusterized in HEK293T cells.21
Figure 4.
CRY2 oligomerization and CRY2-CIB1 heterodimerization coexist in the same system. Both CRY2 and CIB1 were tethered to the plasma membrane via a Caax motif. Before blue light stimulation, both CRY2 (red channel) and CIB1 (green channel) are homogeneous on the plasma membrane. Upon blue light illumination (200 ms blue light pulse every 5 s), CRY2 forms numerous bright clusters on the membrane. CIB1 is also found to accumulate in the same clusters. Scale bars, 10 µm.
CRY2 Oligomerization Can Be Modulated by CRY2-CIB1 Heterodimerization
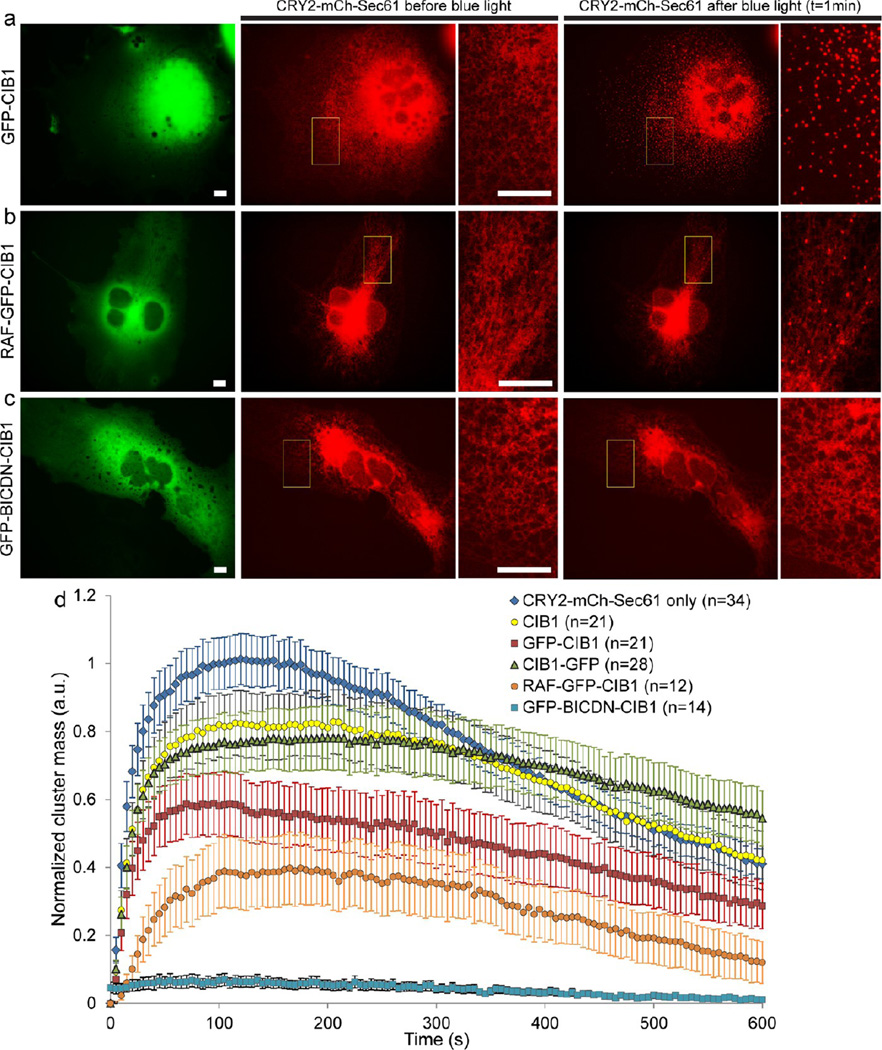
Knowing that photoexcited CRY2 undergoes both homo-oligomerization and heterodimerization with CIB1, we next explored whether CRY2 oligomerization can be modulated by CRY2-CIB1 interaction. In this regard, we quantitatively examined CRY2-mCh-Sec61 oligomerization in the presence of cytosolic CIB1 linked with various fusion proteins, including CIB1 alone, CIB1-GFP, GFP-CIB1, RAF-GFP-CIB1, and GFP-BICDN-CIB1 (Figure 5 and Figure S10, Supporting Information). Cells were stimulated with a single 2 s blue light pulse in this set of experiments. When cotransfecting cells with CRY2-mCh-Sec61 and nonlabeled CIB1, the plasmid concentration ratio was kept to be 5 CIB1:1 CRY2-mCh-Sec61. The fact that the CIB1 construct (170aa) is significantly smaller than the CRY2-mCh-Sec61 construct (CRY2–498aa, mCh–256aa, and Sec61–95aa) also means that it is easier for cells to be transfected and express CIB1 compared to CRY2-mCh-Sec61. This ensures a very high probability that a cell transfected with CRY2-mCh-Sec61 was also cotransfected with CIB1. Using a similar plasmid ratio when cotransfecting cells with CRY2-mCh-Sec61 and CIB1-GFP (or GFP-CIB1), we observed that 100% cells transfected with CRY2-mCh-Sec61 were also cotransfected with the CIB1 plasmid. In the presence of CIB1 (without any fluorescent protein conjugate), CRY2 clusters rapidly formed under blue light activation, similar to cells singly transfected with CRY2-mCh-Sec61 (Figure S10b, Supporting Information). However, cluster quantification analysis revealed that the oligomerization in these cells was slightly suppressed compared to that in cells singly transfected with CRY2-mCh-Sec61 (Figure 5d). The result suggests that CRY2-CIB1 binding can modulate CRY2 oligomerization. To verify this hypothesis, we increased the size of the CIB1-conjugated protein by attaching a GFP domain to either the N- or C- terminal of CIB1. We found that CRY2-mCh-Sec61 cotransfected with either CIB1-GFP or GFP-CIB1 could still readily form clusters upon blue light stimulation (Figure 5a and Figure S10c, Supporting Information). Yet quantification of cluster formation showed that both GFP-CIB1 and CIB1-GFP slightly reduced CRY2 oligomerization with GFP-CIB1 being more effective in suppressing the oligomerization.
Figure 5.
CRY2 oligomerization on the ER membrane can be differentially suppressed by CRY2-CIB1 heterodimerization. Cells were illuminated with a single blue light pulse of 2 s. (a) Cotransfection of COS-7 cells with GFP-CIB1 and CRY2-mCh-Sec61 does not visibly affect CRY2 cluster formation on the ER membrane. (b) Coexpression of RAF-GFP-CIB1 and CRY2-mCh-Sec61 moderately reduces CRY2 cluster formation. The number and the intensity of clusters are reduced as compared with cells singly transfected with CRY2-mCh-Sec61. (c) Coexpression of GFP-BICDN-CIB1 and CRY2-mCh-Sec61 completely blocks CRY2 cluster formation, where no CRY2 cluster is visible after exposure to blue light stimulation. (d) Quantitative analysis of cluster formation in COS-7 cells cotransfected with CRY2-mCh-Sec61 and various CIB1 plasmids shows that CRY2 oligomerization can be suppressed at variable degrees. Error bars represent standard deviation of the mean. Scale bars, 10 µm.
Next, we showed that light-induced CRY2 cluster formation could be completely abrogated by linking bulky protein domains to CIB1. We constructed two plasmids, RAF-GFP-CIB1 and GFP-BICDN-CIB1, where both RAF (1–646 aa) and BICDN (1–594 aa) are significantly bigger protein domains than CIB1 (1–170 aa). RAF is a serine/threonine protein kinase which is involved in the mitogenic signal cascade.29,30 In its cytosolic form, RAF exists in an autoinhibitory, inactive state in the cytoplasm.31 BICDN is the N-terminal portion of human bicaudal D2, a cytoplasmic α-helical coiled-coil protein that can interact with the cytoplasmic dynein.32,33 We found that cells coexpressing CRY2-mCh-Sec61 and RAF-GFP-CIB1 showed much lower oligomerization activity, where both CRY2 cluster number and intensity were significantly reduced (Figure 5b). More strikingly, coexpressing CRY2-mCh-Sec61 and GFP-BICDN-CIB1 in COS-7 completely eliminated any visible clustering effect of CRY2-mCh-Sec61 on the ER network (Figure 5c). This blocking effect of GFP-BICDN-CIB1 on CRY2 cluster formation was consistently and repeatedly observed in all cells cotransfected with the plasmid pair. As a control experiment, we cotransfected cells with GFP-BICDN and CRY2-mCh-Sec61 and found that GFP-BICDN (without the CIB1 domain) did not affect the oligomerization activity of CRY2 on the ER membrane. This result confirmed that the blocking effect is not due to the presence of cytosolic BICDN and that GFP-BICDN-CIB1 needs to be actively recruited to CRY2 in order to suppress CRY2 clustering. Furthermore, the blocking effect of GFP-BICDN-CIB1 on CRY2 oligomerization was not limited to the ER membrane. We found that CRY2 clustering was also clearly abolished on the plasma membrane or the mitochondrial outer membrane when the GFP-BICDNCIB1 construct was coexpressed with CRY2-mCh-Caax or with CRY2-mCh-Miro1 in the cell (Figure S11, Supporting Information). A quantitative comparison of cluster formation in COS-7 cells cotransfected with CRY2-mCh-Sec61 and various CIB1 plasmids is shown in Figure 5d.
We also examined the decay kinetics of the CRY2 cluster in the presence of various CIB1 fusion proteins (Figure 5d). We estimated the value of T1/2decay from the plot, defined as the time it takes for the CRY2 cluster mass in the cell to reduce from its maximum value to half of the peak value. The measured T1/2decay values are 380 s (CRY2-mCh-Sec61 only), 510 s (CRY2-mCh-Sec61 with CIB1), >450 s (CRY2-mCh-Sec61 with CIB1-GFP), 520s (CRY2-mCh-Sec61 with GFP-CIB1), and 380 s (CRY2-mCh-Sec61 with RAF-GFP-CIB1). In the case of cells cotransfected with CIB1-GFP, the exact T1/2decay value could not be measured because the cluster mass did not decay to the half-maximal value within the 10 min imaging period. We also could not extract T1/2decay in cells cotransfected with GFP-BICDN-CIB1 because there were very few clusters formed. Nevertheless, this result indicates that the presence of other CIB1 plasmids such as CIB1, CIB1-GFP, and GFP-CIB1 not only suppressed CRY2 cluster formation but also hindered the dissociation of the CRY2 clusters. However, we noted that the presence of the RAF-GFP-CIB1 construct, while severely reducing the CRY2 cluster mass formation, did not significantly affect CRY2 dissociation.
CRY2 Oligomerization Can Be Enhanced through CRY2-CIB1 Interaction
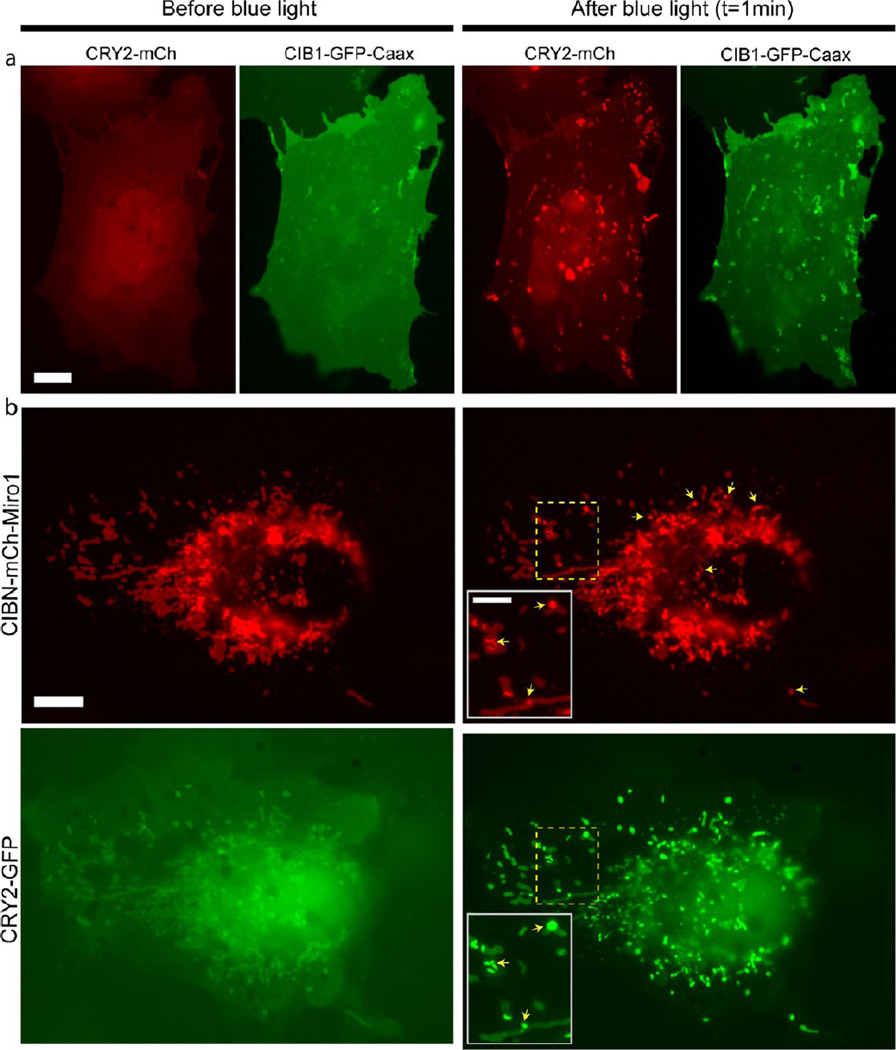
With the observations that CRY2 oligomerization and CRY2-CIB1 interaction could coexist and that CRY2 oligomerization occurred much more readily when CRY2 was tethered to the cellular membrane, we next showed that CRY2 oligomerization can be significantly enhanced by recruiting cytoplasmic CRY2 to the cellular membrane through its interaction with CIB1. In this study, COS-7 cells were cotransfected with the cytoplasmic CRY2-mCh and membranous CIB1-GFP-Caax (CIB1 anchored to the plasma membrane via the Caax motif). Alternating blue light and green light pulses were used to monitor the change in the dynamics of CRY2-mCh and CIB1-GFP-Caax (200 ms light pulse at 0.2fr/sec frame rate). Upon blue light activation, two phenomena occurred: the cytoplasmic CRY2 was quickly recruited to the plasma membrane through CRY2-CIB1 heterodimerization, and dramatic CRY2 cluster formation was observed within seconds (Figure 6a). The simultaneous observation of two types of interaction further supports our previous conclusion that the photoexcited CRY2 has two separate binding sites for CRY2-CRY2 oligomerization and CRY2-CIB1 heterodimerization. We noted that the CRY2 clusters formed in this condition were less in numbers but significantly larger in sizes as compared to CRY2 clusters formed in cells singly transfected with CRY2-mCh-Caax (Figure 1c). Similarly, when cytosolic CRY2 was recruited to the outer membrane of mitochondria through CIB1 interaction in cells cotransfected with CRY2-GFP and CIB1-mCh-Miro1, CRY2 oligomerization also readily occurred on the mitochondrial membrane (Figure 6b). In cells cotransfected with this plasmid pair, we did not observe any significant changes in the number and size of the CRY2 clusters compared to cells singly transfected with CRY2-mCh-Miro1. As noted in the previous section, by itself cytoplasmic CRY2-mCh or cytoplasmic CRY2-GFP has very low propensity to form clusters under blue light (Figure 1a and Figure S1, Supporting Information). Therefore, the enhanced oligomerization observed in the cotransfected cells was aided by indirectly tethering CRY2 to the membrane through its interaction with CIB1. In this setup, the steric effect was minimized by using the short membrane targeting Caax motif (15 aa) or the small transmembrane mitochondria-targeting sequence Miro1 (23 aa) to anchor CIB1 to the respective membrane. This approach could be useful in future protein clustering studies where the oligomerization of cytoplasmic proteins could be precisely and reliably induced by recruiting the protein to a specific membrane via the CRY2-CIB1 interaction.
Figure 6.
Cytosolic CRY2 oligomerization can be drastically enhanced through CRY2-CIB1 heterodimerization and subsequent recruitment to the cell membrane. Cells were illuminated with 200 ms blue light pulse every 5 s. (a) A COS-7 cell cotransfected with CRY2-mCh and CIB1-GFP-Caax shows diffusive cytoplasmic CRY2-mCh and homogeneous plasma membrane-localized CIB1-GFP-Caax before blue light stimulation. After blue light exposure, CRY2-mCh is recruited to the plasma membrane and forms large clusters as shown in the red channel. In the green channel, CIB1-GFP-Caax shows the same cluster pattern as CRY2. (b) A COS-7 cell cotransfected with CRY2-GFP and CIBN-mCh-Miro1. Before blue light, CRY2-GFP is expressed in the cytoplasmic form. The partial colocalization seen between CRY2-GFP and mitochondria in the first imaging frame is due to the fact that blue light was used to collect the fluorescence signal in the green channel. After blue light, CRY2 clusters on the mitochondria well colocalize with the appearance of CIB1-mCh-Miro1 clusters in the same locations (yellow arrows). Scale bars, 10 µm. Insets show enlarged images as indicated by the dotted lines. Inset scale bar, 5 µm.
CONCLUSIONS AND DISCUSSION
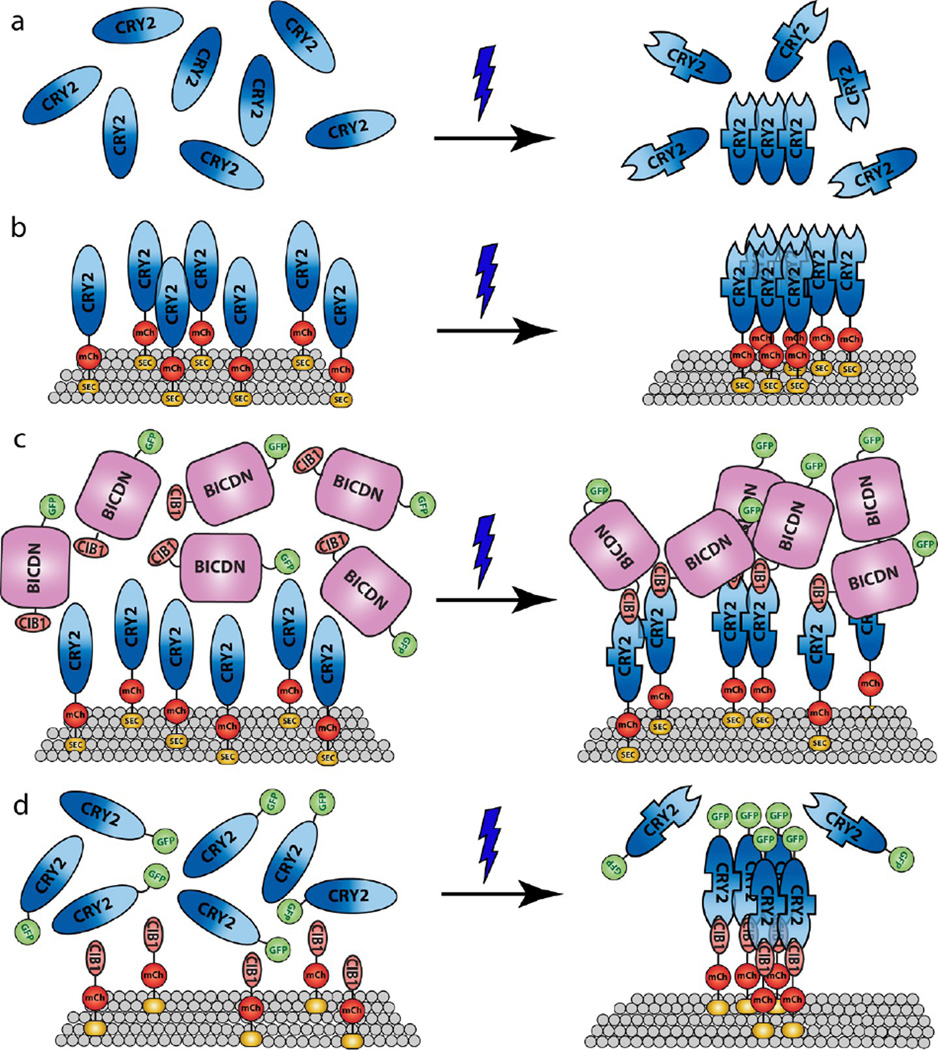
This article examined light-induced CRY2 oligomerization on various intracellular membranes and how CRY2 oligomerization could be inhibited or assisted by light-induced CRY2-CIB1 heterodimerization. Our observation that the cytoplasmic form of wild-type CRY2 is ineffective in forming clusters is in agreement with previous papers reporting negligible CRY2 cluster formation under blue light.24,25 However, we found that membrane-bound CRY2 displayed dramatic cluster formation under similar blue light activation conditions. While it is possible that the cytoplasmic CRY2 could form small clusters that are not detectable under a fluorescence microscope, it is clear that the membrane-bound form of CRY2 has a much more potent oligomeric activity. This result could be because when CRY2 is tethered to a two-dimensional surface, the local concentration of the membrane-bound CRY2 is significantly higher than that of the cytoplasmic form of CRY2, leading to a favorable oligomerization reaction. Additionally, the result also supports a hypothesis that the CRY2-CRY2 oligomeric interaction prefers parallel-aligned orientation. When tethered to the membrane, the individual CRY2 proteins are more aligned compared to the random orientation nature of the cytoplasmic CRY2 and thus results in an enhancement of CRY2 oligomerization. The proposed mechanism for CRY2 oligomerization in its cytoplasmic and membranous form is illustrated in Figure 7a–b.
Figure 7.
Proposed mechanism of CRY2-CRY2 oligomerization and CRY2-CIB1 heterodimerization. (a) Blue light induces conformational changes in CRY2, with CRY2-CRY2 binding and CRY2-CIB1 binding occurring at different CRY2 sites. Cytoplasmic CRY2 has low oligomerization activity due to random (unaligned) protein orientation. (b) CRY2 bound on the lipid membrane has enhanced oligomeric activity likely due to preferred parallel orientation for CRY2-CRY2 binding. (c) CIB1 linked with a bulky protein domain such as BICDN can suppress CRY2 oligomerization due to steric blocking of the CRY2-CRY2 binding site. (d) Cytoplasmic CRY2 can be recruited to the cell membrane by binding to membrane-linked CIB1, which significantly enhances CRY2 oligomerization.
The relationship between CRY2 oligomerization and CRY2-CIB1 dimerization was explored in this study. Our results (from data shown in Figures 5 and 6) indicated that photoexcited CRY2 undergoes the two types of interactions simultaneously, suggesting that CRY2-CRY2 binding and CRY2-CIB1 binding occur at different CRY2 interacting sites. Although the structural interfaces between CRY2-CRY2 and CRY2-CIB1 are yet to be elucidated, the two independent binding sites for CRY2-CRY2 and CRY2-CIB1 suggest a possibility to mutate CRY2 to achieve selective binding to CRY2 or CIB1.
Furthermore, the dual characteristics of CRY2 can be used to modulate CRY2 interactions. On the one hand, CIB1 linked with certain protein domains can inhibit membrane-bound CRY2 oligomerization. The size of the protein domains linked with CIB1 is positively correlated with the blocking effect of CRY2 oligomerization, suggesting a steric hindrance effect. It is possible that the two CRY2 binding sites (CRY2-CRY2 and CRY2-CIB1) are in close proximity so that the presence of a bulky protein attached to CIB1 at the CRY2-CIB1 binding site could hinder the self-oligomerization activity at the CRY2-CRY2 binding site (illustrated in Figure 7c). On the other hand, cytoplasmic CRY2, typically having limited oligomeric activity, can undergo dramatic cluster formation when recruited to the membrane through CIB1 interaction (illustrated in Figure 7d). It is also interesting to note that CRY2-CIB1 binding out-competes the CRY2-CRY2 binding when the two systems are in interference. This observation is further supported by quantitatively comparing the kinetics of the two interactions under the same light activating conditions. T1/2, the time at which the interacting CRY2 signal reaches the half-maximal amount, is 23.6 s for CRY2-CRY2 binding (Figure S12a, Supporting Information) and 7.7 s for the CRY2-CIB1 interaction (Figure S12b–c, Supporting Information).
Protein oligomerization is an important type of interaction in biological systems with involvement in modulating cellular signaling, promoting cell-to-cell communication, inducting specific conformational changes (notable example is the clustering of receptors in clathrin-coated pits leading to endocytosis), or participating in disease pathologies.34 Studies utilizing the oligomeric characteristic of CRY2 have demonstrated unique advantages over traditional clustering tools such as antibody-mediated clustering35,36 due to its ease of application, reversibility, and high spatiotemporal resolution. This article shows that the oligomeric activity of CRY2 can be either enhanced or suppressed by utilizing the dual characteristics of the photoexcited CRY2, further establishing the role of CRY2 as a versatile optogenetic tool. The interplay between CRY2 self-oligomerization and CRY2-CIB1 heterodimerization therefore could be employed to provide an additional layer of control in optogenetic studies of the complex protein signaling networks.
Materials and Methods
Plasmids
All of the plasmids were generated using DNA ligation, InFusion cloning kit (Clontech, Mountain View, CA), or 2-step overlapping extension PCR. In this study, we employed the photolyase homology region (PHR) of CRY2 (amino acids 1–498) and a truncated version of CIB1 (amino acids 1–170), gifted by Professor C. Tucker, University of Colorado. CRY2(D387A)-mCh was kindly provided by Professor D. Schaffer, University of California, Berkeley. ER-targeting plasmid Sec61 was generously provided by Professor J. Weissman, University of California, San Francisco. The Miro1 plasmid was gifted by Professor X. Wang, Stanford University. Bicaudal D protein BICDN were generously provided by Professor C. Hoogenraad, Utrecht University, The Netherlands. Additional information about plasmid construction can be found in Supporting Information, Tables 1–2.
Cell Cultures and Transfection
COS-7 monkey fibroblast cells were cultured on a PLL-coated glass coverslip and maintained in Dulbecco’s modified Eagle’s medium (DMEM, Gibco) supplemented with 10% fetal bovine serum (FBS, Gibco) and 1% penicillin/streptomycin. The cells were stored in a humidified atmosphere containing 5% CO2 kept at 37 °C. Twenty-four hours before imaging, the cells were transiently transfected at 70–90% confluency using lipofectamine 2000 (Invitrogen) according to the manufacturer’s protocol. Experiments on other cell lines (3T3 and HEK293T) were performed using similar protocols.
Live-Cell Imaging
Live-cell imaging was performed on an epi-fluorescence microscope (Leica DMI6000B) equipped with an adaptive focus system and an on stage incubator chamber (Tokai Hit GM-8000) to maintain the temperature at 37 °C and 5% CO2 during the imaging period. Images were acquired using an oil-immersion 100× objective (Leica, HCX PL APL, n.a. 1.4) and an light-emitting diode (LED) light source (Lumencor Sola, Beaverton, OR). CRY2 was activated by either a single blue light pulse of 2 s or an intermittent blue light pulse of 200 ms at every 5 s. The LED intensity can be adjusted to a range between 1.2 × 10³ mW/cm2 and 9.7 × 10³ mW/cm2. Unless otherwise specified, the intensity of the blue light pulse used to activate CRY2 was 9.7 × 10³ mW/cm2. Additionally, low blue light intensity (7.9 mW/cm2) was produced by filtering the brightfield light source of the microscope through a blue bandpass filter (Chroma, 460/20). The GFP fluorescence signal was detected using a commercial GFP filter cube (Leica, excitation 472/30, dichroic mirror 495, emission 520/35). mCherry was excited using green light (~550 nm, 9.7 × 10³ mW/cm2), and the mCherry fluorescence signal was detected using a commercial Texas Red filter cube (Leica, excitation 560/40, dichroic mirror 595, emission 645/75). Movie frames were collected every 5 s at 200 ms exposure.
Image Processing
The CRY2 expression level in COS-7 cells transfected with CRY2-mCh-Sec61 was measured at the first image frame (t = 0, before blue light illumination) using ImageJ. The expression value for each cell was calculated as the average CRY2 intensity minus the image background. Each cell was then categorized as high, medium, or low expression level based on Table 1.
Table 1.
| category | CRY2-mCh-Sec61 average intensity (a.u.) |
|---|---|
| low expression level | 0–75 |
| medium expression level | 76–175 |
| high expression level | >175 |
Cluster quantification on the ER membrane was performed using a custom-written Matlab program. The algorithm automatically detects the locations of individual CRY2 clusters and their intensities (see Supporting Information for details). For each image frame, the cluster mass is calculated as the sum of all cluster intensities in the cell, normalized by the cell size (eq 1).
| (1) |
Acknowledgments
We thank Dr. Tucker for providing the CRY2-mCh, truncated CIB1-GFP-Caax, and full length CIB1-GFP-Caax plasmids; Dr. Schaffer for providing the mutant CRY2(D387A)-mCh plasmid; Dr. Weissman for providing the Sec61 plasmid; Dr. Wang for providing the Miro1 plasmid; and Dr. Hoogenraad for providing the BICDN plasmid. This work was funded by the US National Institutes of Health (DP2-NS082125) and a Packard fellowship in Science and Engineering. D.L.C was supported by a National Science Foundation Graduate Fellowship.
Footnotes
ASSOCIATED CONTENT
Supporting Information
Tables S1–S2 and Figures S1–S12. The Supporting Information is available free of charge on the ACS Publications website at DOI: 10.1021/acssynbio.5b00048.
Author Contributions
D.L.C., L.D., K.Z., and B.C. conceived the idea and designed the experiments. L.D. performed cloning for plasmid constructs and cell culturing. D.L.C. carried out cell culturing, imaging, and quantification analysis. D.L.C., L.D., and B.C. wrote and edited the article.
The authors declare no competing financial interest.
REFERENCES
- 1.Pathak GP, Vrana JD, Tucker CL. Optogenetic control of cell function using engineered photoreceptors. Biol. Cell. 2013;105:59–72. doi: 10.1111/boc.201200056. [DOI] [PMC free article] [PubMed] [Google Scholar]
- 2.Tischer D, Weiner OD. Illuminating cell signalling with optogenetic tools. Nat. Rev. Mol. Cell Biol. 2014;15:551–558. doi: 10.1038/nrm3837. [DOI] [PMC free article] [PubMed] [Google Scholar]
- 3.Zhang K, Cui B. Optogenetic control of intracellular signaling pathways. Trends Biotechnol. 2015;33:92–100. doi: 10.1016/j.tibtech.2014.11.007. [DOI] [PMC free article] [PubMed] [Google Scholar]
- 4.Cashmore AR, Jarillo JA, Wu YJ, Liu DM. Cryptochromes: Blue light receptors for plants and animals. Science. 1999;284:760–765. doi: 10.1126/science.284.5415.760. [DOI] [PubMed] [Google Scholar]
- 5.Cashmore AR. Cryptochromes: Enabling plants and animals to determine circadian time. Cell. 2003;114:537–543. [PubMed] [Google Scholar]
- 6.Yu X, Klejnot J, Zhao X, Shalitin D, Maymon M, Yang H, Lee J, Liu X, Lopez J, Lin C. Arabidopsis cryptochrome 2 completes its posttranslational life cycle in the nucleus. Plant Cell. 2007;19:3146–3156. doi: 10.1105/tpc.107.053017. [DOI] [PMC free article] [PubMed] [Google Scholar]
- 7.Ahmad M, Cashmore AR. HY4 gene of A-thaliana encodes a protein with characteristics of a blue-light photoreceptor. Nature. 1993;366:162–166. doi: 10.1038/366162a0. [DOI] [PubMed] [Google Scholar]
- 8.Guo HW, Yang WY, Mockler TC, Lin CT. Regulations of flowering time by Arabidopsis photoreceptors. Science. 1998;279:1360–1363. doi: 10.1126/science.279.5355.1360. [DOI] [PubMed] [Google Scholar]
- 9.Liu H, Yu X, Li K, Klejnot J, Yang H, Lisiero D, Lin C. Photoexcited CRY2 interacts with CIB1 to regulate transcription and floral initiation in Arabidopsis. Science. 2008;322:1535–1539. doi: 10.1126/science.1163927. [DOI] [PubMed] [Google Scholar]
- 10.Liu B, Liu H, Zhong D, Lin C. Searching for a photocycle of the cryptochrome photoreceptors. Curr. Opin. Plant Biol. 2010;13:578–586. doi: 10.1016/j.pbi.2010.09.005. [DOI] [PMC free article] [PubMed] [Google Scholar]
- 11.Kennedy MJ, Hughes RM, Peteya LA, Schwartz JW, Ehlers MD, Tucker CL. Rapid blue-light-mediated induction of protein interactions in living cells. Nat. Methods. 2010;7:973–U948. doi: 10.1038/nmeth.1524. [DOI] [PMC free article] [PubMed] [Google Scholar]
- 12.Idevall-Hagren O, Dickson EJ, Hille B, Toomre DK, De Camilli P. Optogenetic control of phosphoinositide metabolism. Proc. Natl. Acad. Sci. U.S.A. 2012;109:E2316–E2323. doi: 10.1073/pnas.1211305109. [DOI] [PMC free article] [PubMed] [Google Scholar]
- 13.Hughes RM, Bolger S, Tapadia H, Tucker CL. Light-mediated control of DNA transcription in yeast. Methods. 2012;58:385–391. doi: 10.1016/j.ymeth.2012.08.004. [DOI] [PMC free article] [PubMed] [Google Scholar]
- 14.Liu H, Gomez G, Lin S, Lin S, Lin C. Optogenetic control of transcription in zebrafish. PLoS One. 2012;7 doi: 10.1371/journal.pone.0050738. [DOI] [PMC free article] [PubMed] [Google Scholar]
- 15.Kakumoto T, Nakata T. Optogenetic control of PIP3: PIP3 is sufficient to induce the actin-based active part of growth cones and is regulated via endocytosis. PLoS One. 2013;8 doi: 10.1371/journal.pone.0070861. [DOI] [PMC free article] [PubMed] [Google Scholar]
- 16.Konermann S, Brigham MD, Trevino AE, Hsu PD, Heidenreich M, Cong L, Platt RJ, Scott DA, Church GM, Zhang F. Optical control of mammalian endogenous transcription and epigenetic states. Nature. 2013;500:472. doi: 10.1038/nature12466. [DOI] [PMC free article] [PubMed] [Google Scholar]
- 17.Boulina M, Samarajeewa H, Baker JD, Kim MD, Chiba A. Live imaging of multicolor-labeled cells in Drosophila. Development. 2013;140:1605–1613. doi: 10.1242/dev.088930. [DOI] [PMC free article] [PubMed] [Google Scholar]
- 18.Zhang K, Duan L, Ong Q, Lin Z, Varman PM, Sung K, Cui B. Light-mediated kinetic control reveals the temporal effect of the Raf/MEK/ERK pathway in PC12 cell neurite outgrowth. PLoS One. 2014;9 doi: 10.1371/journal.pone.0092917. [DOI] [PMC free article] [PubMed] [Google Scholar]
- 19.Mas P, Devlin PF, Panda S, Kay SA. Functional interaction of phytochrome B and cryptochrome 2. Nature. 2000;408:207–211. doi: 10.1038/35041583. [DOI] [PubMed] [Google Scholar]
- 20.Yu X, Sayegh R, Maymon M, Warpeha K, Klejnot J, Yang H, Huang J, Lee J, Kaufman L, Lin C. Formation of nuclear bodies of Arabidopsis CRY2 in response to blue light is associated with its blue light-dependent degradation. Plant Cell. 2009;21:118–130. doi: 10.1105/tpc.108.061663. [DOI] [PMC free article] [PubMed] [Google Scholar]
- 21.Bugaj LJ, Choksi AT, Mesuda CK, Kane RS, Schaffer DV. Optogenetic protein clustering and signaling activation in mammalian cells. Nat. Methods. 2013;10:249–252. doi: 10.1038/nmeth.2360. [DOI] [PubMed] [Google Scholar]
- 22.Wend S, Wagner HJ, Mueller K, Zurbriggen MD, Weber W, Radziwill G. Optogenetic control of protein kinase activity in mammalian cells. ACS Synth. Biol. 2014;3:280–285. doi: 10.1021/sb400090s. [DOI] [PubMed] [Google Scholar]
- 23.Kim N, Kim JM, Lee M, Kim CY, Chang K-Y, Heo WD. Spatiotemporal control of fibroblast growth factor receptor signals by blue light. Chem. Biol. 2014;21:903–912. doi: 10.1016/j.chembiol.2014.05.013. [DOI] [PubMed] [Google Scholar]
- 24.Lee S, Park H, Kyung T, Kim NY, Kim S, Kim J, Heo WD. Reversible protein inactivation by optogenetic trapping in cells. Nat. Methods. 2014;11:633. doi: 10.1038/nmeth.2940. [DOI] [PubMed] [Google Scholar]
- 25.Taslimi A, Vrana JD, Chen D, Borinskaya S, Mayer BJ, Kennedy MJ, Tucker CL. An optimized optogenetic clustering tool for probing protein interaction and function. Nat. Commun. 2014;5 doi: 10.1038/ncomms5925. [DOI] [PMC free article] [PubMed] [Google Scholar]
- 26.Greenfield JJA, High S. The Sec61 complex is located in both the ER and the ER-Golgi intermediate compartment. J. Cell Sci. 1999;112:1477–1486. doi: 10.1242/jcs.112.10.1477. [DOI] [PubMed] [Google Scholar]
- 27.Wright LP, Philips MR. CAAX modification and membrane targeting of Ras. J. Lipid Res. 2006;47:883–891. doi: 10.1194/jlr.R600004-JLR200. [DOI] [PubMed] [Google Scholar]
- 28.Fransson A, Ruusala A, Aspenstom P. The atypical Rho GTPases Miro-1 and Miro-2 have essential roles in mitochondrial trafficking. Biochem. Biophys. Res. Commun. 2006;344:500–510. doi: 10.1016/j.bbrc.2006.03.163. [DOI] [PubMed] [Google Scholar]
- 29.Zhang W, Liu HT. MAPK signal pathways in the regulation of cell proliferation in mammalian cells. Cell Res. 2002;12:9–18. doi: 10.1038/sj.cr.7290105. [DOI] [PubMed] [Google Scholar]
- 30.Chen X, Resh MD. Activation of mitogen-activated protein kinase by membrane-targeted Raf chimeras is independent of raft localization. J. Biol. Chem. 2001;276:34617–34623. doi: 10.1074/jbc.M103995200. [DOI] [PubMed] [Google Scholar]
- 31.Molzan M, Ottmann C. Synergistic binding of the phosphorylated S233-and S259-binding sites of C-RAF to one 14–3-3 zeta dimer. J. Mol. Biol. 2012;423:486–495. doi: 10.1016/j.jmb.2012.08.009. [DOI] [PubMed] [Google Scholar]
- 32.Wharton RP, Struhl G. Structure of the Drosophila bicaudal D protein and its role in localizing the posterior determinant nanos. Cell. 1989;59:881–892. doi: 10.1016/0092-8674(89)90611-9. [DOI] [PubMed] [Google Scholar]
- 33.Hoogenraad CC, Akhmanova A, Howell SA, Dortland BR, De Zeeuw CI, Willemsen R, Visser P, Grosveld F, Galjart N. Mammalian Golgi-associated bicaudal-D2 functions in the dynein-dynactin pathway by interacting with these complexes. EMBO J. 2001;20:4041–4054. doi: 10.1093/emboj/20.15.4041. [DOI] [PMC free article] [PubMed] [Google Scholar]
- 34.Mammen M, Choi SK, Whitesides GM. Polyvalent interactions in biological systems: Implications for design and use of multivalent ligands and inhibitors. Angew. Chem. Int. Ed. 1998;37:2755–2794. doi: 10.1002/(SICI)1521-3773(19981102)37:20<2754::AID-ANIE2754>3.0.CO;2-3. [DOI] [PubMed] [Google Scholar]
- 35.Kolanus W, Romeo C, Seed B. T-cell activation by clustered tyrosine kinases. Cell. 1993;74:171–183. doi: 10.1016/0092-8674(93)90304-9. [DOI] [PubMed] [Google Scholar]
- 36.Rivera GM, Briceno CA, Takeshima F, Snapper SB, Mayer BJ. Inducible clustering of membrane-targeted SH3 domains of the adaptor protein Nck triggers localized actin polymerization. Curr. Biol. 2004;14:11–22. doi: 10.1016/j.cub.2003.12.033. [DOI] [PubMed] [Google Scholar]


