

Abstract
Purpose
To predict pathological response of breast cancer to neoadjuvant chemotherapy (NAC) based on quantitative, multi-region analysis of dynamic contrast enhancement magnetic resonance imaging (DCE-MRI).
Materials and Methods
In this institutional review board-approved study, 35 patients diagnosed with stage II/III breast cancer were retrospectively investigated using 3T DCE-MR images acquired before and after the first cycle of NAC. First, principal component analysis (PCA) was used to reduce the dimensionality of the DCE-MRI data with a high-temporal resolution. We then partitioned the whole tumor into multiple subregions using k-means clustering based on the PCA-defined eigenmaps. Within each tumor subregion, we extracted four quantitative Haralick texture features based on the gray-level co-occurrence matrix (GLCM). The change in texture features in each tumor subregion between pre- and during-NAC was used to predict pathological complete response after NAC.
Results
Three tumor subregions were identified through clustering, each with distinct enhancement characteristics. In univariate analysis, all imaging predictors except one extracted from the tumor subregion associated with fast wash-out were statistically significant (p< 0.05) after correcting for multiple testing, with area under the ROC curve or AUCs between 0.75 and 0.80. In multivariate analysis, the proposed imaging predictors achieved an AUC of 0.79 (p = 0.002) in leave-one-out cross validation. This improved upon conventional imaging predictors such as tumor volume (AUC=0.53) and texture features based on whole-tumor analysis (AUC=0.65).
Conclusion
The heterogeneity of the tumor subregion associated with fast wash-out on DCE-MRI predicted pathological response to neoadjuvant chemotherapy in breast cancer.
Keywords: DCE-MRI, breast cancer, intra-tumor partitioning, texture analysis, treatment response prediction
INTRODUCTION
Neoadjuvant chemotherapy (NAC) is used to treat primary breast cancer with the aim of tumor shrinking to increase the likelihood of successful breast-conserving surgery. However, a significant proportion (up to 30%) of patients do not benefit from NAC with poor pathological response, and yet suffer from the toxicity and side effects associated with chemotherapy (1). Therefore, the ability to identify responders versus non-responders early during the course of treatment would enable the use of alternative, potentially more effective therapies (2).
A number of studies have investigated the value of dynamic contrast enhancement magnetic resonance imaging (DCE-MRI) for assessing or predicting treatment response to neoadjuvant chemotherapy in breast cancer (3–19). For instance, Hylton et al. (14) investigated the predictive value of semi-quantitative image features (morphologic and kinetic) derived from DCE-MRI in post-treatment images as compared to pre-treatment images. Nariya et al. (15) performed parametric response map analysis with pharmacokinetic parameters extracted from DCE-MRI for early prediction of pathological response to NAC. More recently, Li et al. (10) combined measurements from DCE-MRI and diffusion-weighted MRI (DW-MRI) obtained before and after the first cycle of NAC for predicting response. Ashraf et al. (13) explored the associations between kinetic texture features extracted from DCE-MRI and response to NAC in a small cohort of 15 patients.
Most previous approaches are limited by the lack of considering spatial information, where the image features (including texture) were calculated as aggregate measures on the entire tumor volume. These approaches implicitly assume that the tumor is either homogeneous, or heterogeneous but uniformly mixed throughout the whole volume. In reality, however, regional variations within the tumor are often apparent on imaging and may have differing prognostic potential (20–24). Imaging could be used to depict regional phenotypic variations within a tumor that reflect differing fundamental biological processes (25).
We hypothesized that some parts of the tumor are biologically more aggressive and treatment-resistant than others, and therefore sub-region analysis may be more useful compared with whole-tumor aggregate approaches to predict therapy response, disease progression, and survival. The purpose of this work was to predict pathological response of breast cancer to NAC using DCE-MRI acquired early during therapy, based on quantitative image features extracted from relevant tumor subregions.
MATERIALS AND METHODS
Patient Cohort
The details of the patient cohort have been previously reported (10). A subset of 35 breast cancer patients was selected in this IRB-approved study. The detailed selection criteria were: 1) the patients with pathologically proven stage II/III invasive breast cancer, 2) the longest dimension of the tumor was at least 1 cm, 3) the patients went through NAC, 4) the patient had DCE-MRI before and after first cycle of NAC and 5) the patients were assessed after NAC in terms of their pathological response.
Imaging Protocol
The details of the MR imaging protocol have been previously reported (10). The DCE-MR imaging was performed on a Philips 3T Achieva MR scanner (Philips Healthcare, Best, The Netherlands), with TR = 7.9 ms, TE = 4.6 ms and flip angle = 20°. The MR image matrix was 192×192×20 with spatial resolution 1.3×1.3×5.0 mm3 over a sagittal field of view 220×220 mm2. Each patient was dynamically scanned 25 times with a 16-second interval for a total duration of under 7 minutes. The contrast agent of gadopentetate dimeglumine, gadolinium-diethylenetriamine penta-acetic acid, (Magnevist, Wayne, NJ) (with the dose of 0.1 mmol/kg) was delivered at 2 mL/sec through a catheter placed within an antecubital vein via a power injector (Medrad, Warrendale, PA) after the acquisition of first three dynamic scans.
For each patient, the DCE-MRI was acquired at three time points: before chemotherapy initialization (pre-NAC), after the first cycle of chemotherapy (during-NAC) and after all cycles of chemotherapy (post-NAC), respectively. The detailed MR imaging schema was shown in Figure 1. The median time between pre-NAC and during-NAC MR scanning was 14 days (range: 7–29 days). The median time between the end of 1st cycle NAC treatment and during-NAC MR scanning was 1 day (range: 0–11 days).
Figure 1.

Time of MRI execution schema.
Pathologic Response
Pathologic complete responder (pCR) was defined as no histologic evidence of invasive tumor cells in breast and lymph nodes after therapy. On the contrary, patients with residual invasive cancer or progressive disease were regarded as non-pCR. In the studied cohort of 35 patients, 12 patients (34.3%) were pCR and 23 patients (65.7%) were non-pCR.
Overview of the Proposed Method
In this study, we investigated whether computational texture features extracted from intra-tumor subregions on DCE-MR images acquired after the first cycle of NAC would predict the pathological response of breast cancer after completion of chemotherapy. Briefly, principal component analysis (PCA) was used to reduce the dimensionality of the DCE-MRI data with a high-temporal resolution. We then performed intra-tumor partitioning based on the PCA-defined eigenmaps. We extracted textural features to quantify the heterogeneity within each tumor subregion, and evaluated the change in texture between pre-NAC and during-NAC as potential predictors of pathological response. Figure 2 summarizes the proposed framework, and the details are described in the following sections.
Figure 2.

Flowchart of the proposed analysis pipeline.
Tumor Segmentation
In this study, we adopted a similar tumor segmentation scheme as proposed in (10). First, a region of interest (ROI) was manually drawn to define the breast region excluding lung and heart (J.W., who had 3 years’ experience in breast DCE-MR imaging analysis). Within this ROI, the tumor voxels were defined as the , where and referred to the average intensity at 3 pre-enhancement time points and the average intensity at post-enhancement time points. Additionally, the calculated tumor mask was further processed to remove small islands (voxel size < 100) and to fill in the holes.
Temporal Dimensionality Reduction via Principal Component Analysis
To reduce the temporal dimensionality of the DCE-MRI (with 25 dynamic scans), we performed PCA transform the original DCE-MRI data to a set of uncorrelated eigenvectors or eigenmaps. As the image signal at each tumor voxel (i.e., the enhancement pattern) was highly correlated in the temporal domain, PCA can effectively remove redundancy and suppress noise in the data. We performed population-level PCA by cumulating the tumor voxels from the entire cohort at both pre-NAC and during-NAC. Finally, several temporal modes (i.e., principal components) were uncovered to describe the population-level enhancement patterns, and the corresponding eigenmaps (i.e., eigenvalue mapped back to original tumor location) showed the intra-tumor heterogeneity in terms of the associated enhancement patterns. Here, we only kept those eigenvectors that had > 1% energy.
Intra-Tumor Partitioning to Identify Relevant Tumor Subregions
To comprehensively characterize intra-tumor spatial heterogeneity, we performed clustering analysis on the PCA-defined eigenmaps for each tumor. In particular, unsupervised k-means clustering was used to partition the whole tumor into several spatially distinct subregions, where tumor voxels with similar enhancement patterns were grouped together. K-means clustering was applied to the tumor voxels on DCE-MRI from all patients at both pre-NAC and during-NAC. To determine the number of subregions (i.e., cluster number k), we set k from 2 to 10 and selected the one with optimal Calinski-Harabasz value (26).
Texture Analysis to Quantify Heterogeneity of Tumor Subregions
To quantify spatial heterogeneity within each tumor subregion, we extracted Haralick textual features of each individual eigenmap at pre-NAC and during-NAC. In details, we calculated the gray-level co-occurrence matrix (GLCM) from the eigenmaps within each subregion. The gray level was set to 64, and GLCM with a 1-voxel offset of angle 0, 45, 90 and 135 degrees were computed and averaged. From GLCM, four Haralick texture features, including contrast, correlation, energy, and homogeneity, were extracted for each patient at pre-NAC and during-NAC, respectively. The longitudinal change of these texture features (i.e., Δ = textureduringNAC - texturepreNAC) were proposed as potential predictors of pathological response.
Evaluation of the Proposed Imaging Predictors
The receiver operating characteristics (ROC) curve analysis and area under the curve (AUC) was used to assess the prediction capability of the proposed imaging predictors. Both univariate and multivariate analysis were performed in order to assess the predictive power of individual predictors and their complementary value. Logistical regression was used to build univariate and multivariate prediction models to classify tumors into pCR and non-pCR groups. For multivariate analysis, the least absolute shrinkage and selection operator (LASSO) algorithm (27) was combined with logistic regression for feature selection. To avoid over-fitting, leave-one-out cross-validation (LOOCV) was used to evaluate the performance.
Comparison with Conventional Approaches
To systematically evaluate whether the proposed imaging predictors indeed improve upon conventional ones, we derived from the same DCE-MRI without either dimensionality reduction or intra-tumor partitioning. These conventional imaging predictors included Haralick texture features directly from contrast uptake or washout maps and from the eigenmaps (consider the entire tumor as one single ROI). Table 1 listed details of all three groups of the studied imaging predictors in this study.
Table 1.
List of Three Groups of Texture Related Imaging Predictors
| Group 1, Enhancement Map | Group 2, Eigenmap | Group 3, Eigenmap in tumor subregions (proposed) |
|---|---|---|
| Energy, Contrast, Correlation, and Homogeneity of GLCM of Wash-in Slope (WIS) Map, Energy, Contrast, Correlation, and Homogeneity of GLCM of Wash-out Slope (WOS) Map | Energy, Contrast, Correlation, and Homogeneity of GLCM for Each Eigenmap | Energy, Contrast, Correlation, and Homogeneity of GLCM for Each Eigenmap in Each Tumor Subregion |
Statistical Analysis
To adjust for multiple statistical testing, the Benjamini-Hochberg method (28) was used to control the false discovery rate (FDR). The statistical significance of AUCs and whether one AUC was higher than another were assessed via stratified resampling. Specifically, we bootstrapped samples of size 50 with 100 repetitions from 1) original predictor and 2) permuted predictor or predictor in comparison, and then the AUC distributions of 1) and 2) were analyzed by the Wilcoxon signed rank test. A p-value < 0.05 was considered as statistically significant. All statistical analysis was carried out in R.
RESULTS
Clustering of PCA-Based Eigenmaps Identified Three Distinct Intra-tumor Subregions
Principal component analysis of the DCE-MRI showed two major temporal enhancement modes (i.e., principal components), where the first one (containing 95.8% energy) represented the contrast agent wash-in pattern and the second (containing 1.9% energy) represented the contrast agent wash-out pattern, as shown in Figure 3. In the feature space spanned by these 2 modes, all tumor voxels were clustered into 3 subgroups or subregions. The feature values for tumor voxels within each subgroup were shown in Figure 4. Cluster A represented tumor voxels that had a moderate uptake speed and a slow wash-out rate, cluster B represented tumor voxels with a slow uptake and a fast wash-out rate, while cluster C represented tumor voxels with a quick uptake and a moderate wash-out rate. Figure 5 shows the details of the whole process of intratumor partition for one pCR and non-pCR.
Figure 3.
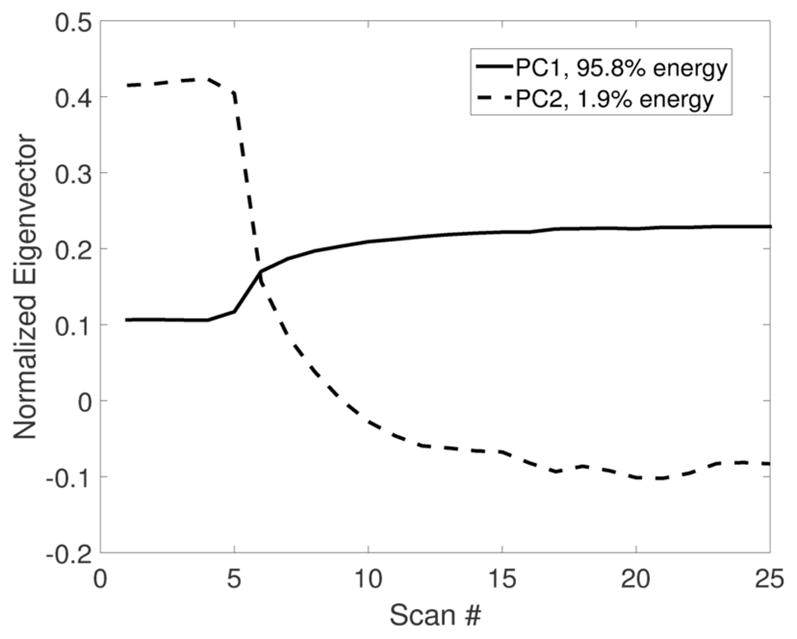
The first two principal components after PCA, which captured two distinct enhancement patterns of DCE-MRI.
Figure 4.

Box plot of the eigenvalues for the tumor voxels of the entire cohort, grouped into three subregions after intra-tumor partition, with eigenvalues of principal component 1 and 2 shown in a) and b), respectively. Note the eigenvalues were z-scored to have a zero mean and unit variance. ANOVA test was implemented to investigate group wise difference among three clusters.
Figure 5.

Illustration of intratumor partitioning results of one non-pCR and pCR at the stage of pre-NAC and during-NAC. First column shows the subtraction image (image acquired at 3 min delay – pre-contrast image) superimposed with tumor contour. Second and third columns show the color coded 1st and 2nd eignmaps, respectively. Last column shows three identified clusters within each tumor after intratumor partition. The tumor volume decrease for non-pCR and pCR patients are 0.70 cc and 0.75 cc, respectively. One texture changes (correlation) of PC2 in Cluster B for these two patients after normalization are -1.15 and 0.98, respectively.
Univariate Analysis
First, the tumor burden related features (Δvolume or Δproportion) were evaluated and reported in Table 2. However, none of these predictors were directly predictive of pathological response, for cases both with and without intratumor partition. Next, Table 3 summarizes the performance of individual texture-related imaging predictors from three feature groups. In general, our proposed imaging predictors (i.e., the texture features of eigenmaps within tumor subregions) consistently outperformed the other two groups of features. As can be seen, none of the enhancement map features were statistically significant. With temporal dimensionality reduction, the predictors started to improve, but still only one out of eight was significant after adjusting for multiple testing. When the whole tumor was divided into three different subregions, the performance of these texture features was significantly improved (p-value < 0.05). All imaging predictors except one extracted from the tumor subregion associated with fast wash-out (cluster B) were statistically significant after adjusting for multiple testing, with AUC between 0.75 and 0.80. Furthermore, we implemented a clustering analysis of all imaging features to explore their correlations as well as their association with response outcome. As shown in Figure 6, the imaging features associated with high washout rate (Cluster B) had a clear correlation with pathological response at the individual level, while other types of features did not.
Table 2.
Univariate Analysis of Various Tumor Burden Related Features for Predicting Pathological Response
| Whole Tumor | Cluster A | Cluster B | Cluster C | |
|---|---|---|---|---|
| Δ Volume | 0.53 (0.30–0.76) | 0.53 (0.33–0.74) | 0.53 (0.33–0.73) | 0.50 (0.28–0.73) |
| Δ Proportion | _ | 0.53 (0.33–0.73) | 0.57 (0.36–0.77) | 0.61 (0.40 – 0.83) |
Note Δ = value of during-NAC – value of pre-NAC
Table 3.
Univariate Analysis of the Texture Related Imaging Predictors for Predicting Pathological Response
| Texture Features | Enhancement Maps | Eigen Maps Alone | Eigen Maps of Tumor Subregions with fast wash-out b (proposed) | |||
|---|---|---|---|---|---|---|
|
| ||||||
| Wash-in | Wash-out | PC1 | PC2 | PC1 | PC2 | |
| Contrast | 0.49 (0.27–0.71) | 0.43 (0.22–0.65) | 0.59 (0.36–0.81) | 0.46 (0.24–0.69) | 0.75* (0.59–0.91) | 0.76 * (0.60–0.92) |
| Correlation | 0.62 (0.41–0.83) | 0.56 (0.36–0.76) | 0.77* (0.59–0.96) | 0.51 (0.30–0.72) | 0.70 (0.50–0.89) | 0.80* (0.65–0.95) |
| Energy | 0.62 (0.42–0.83) | 0.66 (0.44–0.87) | 0.57 (0.35–0.78) | 0.44 (0.23–0.65) | 0.76* (0.60–92) | 0.76* (0.60–0.92) |
| Homogeneity | 0.61 (0.41–0.81) | 0.67 (0.47–0.88) | 0.65 (0.47–0.85) | 0.59 (0.37–0.80) | 0.76* (0.60–0.92) | 0.76* (0.60–0.93) |
Note PC: principal component
Contrast: measure local variations in the gray-level co-occurrence matrix (GLCM)
Correlation: measure the joint probability occurrence of the specified pixel pairs
Energy: provides the sum of squared elements in the GLCM, and also known as uniformity or the angular second moment
Homogeneity: measure of the closeness of the distribution of elements in the GLCM to the GLCM diagonal
cluster B resulting from the intratumor partition;
indicates p-value < 0.05 with multiple testing correction of all three group features.
Figure 6.

Clustering analysis of all studied texture related imaging features (for all three feature groups). In the heatmap, all features (presented in different rows and color coded by their types, ie, I, II, IIIA, IIIB or IIIC) from all 35 patients (presented in each column) are correlated with their pathological response (color coded in the bottom). All features were standardized to have a zero mean and unit standard deviation.
Multivariate Analysis
Figure 7 shows the ROC plots based on the cross-validated multivariate analysis results of all three feature groups. The change of tumor volume (i.e., Δ = during-NAC – pre-NAC) was included as the baseline for comparison. The proposed feature group achieved the highest prediction accuracy, with an LOOCV AUC = 0.79 (p-value = 0.002) and the optimal cutoff point had specificity 78% and sensitivity 75%. For the other two feature groups, the enhancement map group achieved an AUC = 0.67 (p-value > 0.05) and the eigenmap alone group achieved an AUC = 0.65 (p-value > 0.05), and they shared the same optimal cutoff with specificity 70% and sensitivity 58%. Furthermore, the proposed feature group achieved statistically better (p-value < 0.05) prediction performance compared with other predictive models.
Figure 7.

Receiver operating characteristic (ROC) curves from multivariate analysis of three feature groups with leave-one-out cross validation. The volume change (Δ = during-NAC – pre-NAC) was also evaluated as the comparison baseline.
DISCUSSION
In this work, we identified a clinically relevant tumor subregion associated with rapid washout of contrast agent, whose change in heterogeneity measured by a GLCM texture feature (i.e., correlation) on DCE-MRI before and during NAC was predictive of pathological response of breast cancer to NAC. Biologically, the heterogeneous perfusion associated with rapid washout vasculature might be caused by angiogenesis and hypoxia, which are known biomarkers for aggressive phenotypes and poor prognosis (29). Our findings suggest that the tumor subregion with most aggressive phenotype, rather than the whole-tumor average behavior, plays a dominant role in determining clinical outcomes such as therapy response and disease progression. This warrants further investigation in future studies.
Our study adds to the growing body of literature demonstrating that intra-tumor heterogeneity measured by a variety of texture features is associated with aggressive, treatment-resistant disease and poor prognosis (13, 23, 30–35). Related to our work, Chaudhury et al. (36) recently showed that heterogeneity in intra-tumoral regions with rapid gadolinium washout was associated with estrogen receptor status and nodal metastasis. As tumor response to neoadjuvant chemotherapy and nodal metastasis are correlated with disease-free survival and overall survival (37), it would be interesting to investigate the potential prognostic value of these imaging features in breast cancer.
Strengths of our study include the uniform acquisition protocol of the DCE-MRI across patients, despite some variations in the timing of imaging. Different from most previous work based on whole-tumor analysis, we applied a clustering-based approach to intra-tumor partitioning to characterize the regional heterogeneity of breast cancer based on DCE-MRI. We used well-established statistical technique or PCA to effectively reduce redundancy and suppress noise in DCE-MRI with a high temporal resolution.
Our study has several limitations. This is a retrospective study with a relatively small cohort. Our preliminary findings need to be further validated in larger prospective cohorts. The small size of our cohort limited our ability to adjust for the confounding effects of different neoadjuvant regimens and other prognostic factors. Although the AUC based on quantitative analysis of DCE-MRI alone was reasonably good, it would be interesting to combine with other imaging modalities such as DW-MRI (10) or FDG-PET (38, 39), for further improvements in the prediction of treatment response.
In conclusion, intra-tumor partitioning identified spatially resolved subregions within breast tumors, each with distinct enhancement characteristics on DCE-MRI. The heterogeneity of the tumor subregion associated with fast wash-out predicted pathological response to neoadjuvant chemotherapy in breast cancer.
Acknowledgments
GRANT SUPPORT: This research was partially supported by the NIH grant number R01 CA193730.
The authors thank Prof. Thomas Yankeelov from the University of Texas at Austin for permission to use the QIN data and the useful discussions on this research work, as well as The Cancer Imaging Archive (TCIA) for providing the data.
References
- 1.Bear HD, Anderson S, Smith RE, et al. Sequential preoperative or postoperative docetaxel added to preoperative doxorubicin plus cyclophosphamide for operable breast cancer:National Surgical Adjuvant Breast and Bowel Project Protocol B-27. J Clin Oncol. 2006;24(13):2019–27. doi: 10.1200/JCO.2005.04.1665. [DOI] [PubMed] [Google Scholar]
- 2.Smith IC, Heys SD, Hutckeon AW, et al. Neoadjuvant chemotherapy in breast cancer: Significantly enhanced response with docetaxel. J Clin Oncol. 2002;20(6):1456–66. doi: 10.1200/JCO.2002.20.6.1456. [DOI] [PubMed] [Google Scholar]
- 3.Cheung YC, Chen SC, Su MY, et al. Monitoring the size and response of locally advanced breast cancers to neoadjuvant chemotherapy (weekly paclitaxel and epirubicin) with serial enhanced MRI. Breast Cancer Res Tr. 2003;78(1):51–8. doi: 10.1023/a:1022153327339. [DOI] [PubMed] [Google Scholar]
- 4.Chou C-P, Wu M-T, Chang H-T, et al. Monitoring breast cancer response to neoadjuvant systemic chemotherapy using parametric contrast-enhanced MRI: a pilot study. Academic radiology. 2007;14(5):561–73. doi: 10.1016/j.acra.2007.02.005. [DOI] [PubMed] [Google Scholar]
- 5.Martincich L, Montemurro F, De Rosa G, et al. Monitoring response to primary chemotherapy in breast cancer using dynamic contrast-enhanced magnetic resonance imaging. Breast Cancer Res Tr. 2004;83(1):67–76. doi: 10.1023/B:BREA.0000010700.11092.f4. [DOI] [PubMed] [Google Scholar]
- 6.Yankeelov TE, Lepage M, Chakravarthy A, et al. Integration of quantitative DCE-MRI and ADC mapping to monitor treatment response in human breast cancer: initial results. Magn Reson Imaging. 2007;25(1):1–13. doi: 10.1016/j.mri.2006.09.006. [DOI] [PMC free article] [PubMed] [Google Scholar]
- 7.Padhani AR, Hayes C, Assersohn L, et al. Prediction of Clinicopathologic Response of Breast Cancer to Primary Chemotherapy at Contrast-enhanced MR Imaging: Initial Clinical Results 1. Radiology. 2006;239(2):361–74. doi: 10.1148/radiol.2392021099. [DOI] [PubMed] [Google Scholar]
- 8.Ah-See MLW, Makris A, Taylor NJ, et al. Early Changes in Functional Dynamic Magnetic Resonance Imaging Predict for Pathologic Response to Neoadjuvant Chemotherapy in Primary Breast Cancer. Clin Cancer Res. 2008;14(20):6580–9. doi: 10.1158/1078-0432.CCR-07-4310. [DOI] [PubMed] [Google Scholar]
- 9.Pickles MD, Gibbs P, Lowry M, Turnbull LW. Diffusion changes precede size reduction in neoadjuvant treatment of breast cancer. Magn Reson Imaging. 2006;24(7):843–7. doi: 10.1016/j.mri.2005.11.005. [DOI] [PubMed] [Google Scholar]
- 10.Li X, Abramson RG, Arlinghaus LR, et al. Multiparametric magnetic resonance imaging for predicting pathological response after the first cycle of neoadjuvant chemotherapy in breast cancer. Investigative radiology. 2015;50(4):195–204. doi: 10.1097/RLI.0000000000000100. [DOI] [PMC free article] [PubMed] [Google Scholar]
- 11.Abramson RG, Li X, Hoyt TL, et al. Early assessment of breast cancer response to neoadjuvant chemotherapy by semi-quantitative analysis of high-temporal resolution DCE-MRI: preliminary results. Magn Reson Imaging. 2013;31(9):1457–64. doi: 10.1016/j.mri.2013.07.002. [DOI] [PMC free article] [PubMed] [Google Scholar]
- 12.Li X, Arlinghaus LR, Ayers GD, et al. DCE-MRI analysis methods for predicting the response of breast cancer to neoadjuvant chemotherapy: pilot study findings. Magnetic resonance in medicine. 2014;71(4):1592–602. doi: 10.1002/mrm.24782. [DOI] [PMC free article] [PubMed] [Google Scholar]
- 13.Ashraf A, Gaonkar B, Mies C, et al. Breast DCE-MRI Kinetic Heterogeneity Tumor Markers: Preliminary Associations With Neoadjuvant Chemotherapy Response. Transl Oncol. 2015;8(3):154–62. doi: 10.1016/j.tranon.2015.03.005. [DOI] [PMC free article] [PubMed] [Google Scholar]
- 14.Hylton NM, Blume JD, Bernreuter WK, et al. Locally Advanced Breast Cancer: MR Imaging for Prediction of Response to Neoadjuvant Chemotherapy-Results from ACRIN 6657/I-SPY TRIAL. Radiology. 2012;263(3):663–72. doi: 10.1148/radiol.12110748. [DOI] [PMC free article] [PubMed] [Google Scholar]
- 15.Cho N, Im SA, Park IA, et al. Breast Cancer: Early Prediction of Response to Neoadjuvant Chemotherapy Using Parametric Response Maps for MR Imaging. Radiology. 2014;272(2):385–96. doi: 10.1148/radiol.14131332. [DOI] [PubMed] [Google Scholar]
- 16.Marinovich ML, Sardanelli F, Ciatto S, et al. Early prediction of pathologic response to neoadjuvant therapy in breast cancer: systematic review of the accuracy of MRI. Breast. 2012;21(5):669–77. doi: 10.1016/j.breast.2012.07.006. [DOI] [PubMed] [Google Scholar]
- 17.Prevos R, Smidt M, Tjan-Heijnen V, et al. Pre-treatment differences and early response monitoring of neoadjuvant chemotherapy in breast cancer patients using magnetic resonance imaging: a systematic review. European radiology. 2012;22(12):2607–16. doi: 10.1007/s00330-012-2653-5. [DOI] [PubMed] [Google Scholar]
- 18.Johansen R, Jensen LR, Rydand J, et al. Predicting Survival and Early Clinical Response to Primary Chemotherapy for Patients With Locally Advanced Breast Cancer Using DCE-MRI. J Magn Reson Imaging. 2009;29(6):1300–7. doi: 10.1002/jmri.21778. [DOI] [PubMed] [Google Scholar]
- 19.Ahmed A, Gibbs P, Pickles M, Turnbull L. Texture analysis in assessment and prediction of chemotherapy response in breast cancer. J Magn Reson Imaging. 2013;38(1):89–101. doi: 10.1002/jmri.23971. [DOI] [PubMed] [Google Scholar]
- 20.Gatenby RA, Grove O, Gillies RJ. Quantitative imaging in cancer evolution and ecology. Radiology. 2013;269(1):8–15. doi: 10.1148/radiol.13122697. [DOI] [PMC free article] [PubMed] [Google Scholar]
- 21.O'Connor JPB, Rose CJ, Waterton JC, Carano RAD, Parker GJM, Jackson A. Imaging Intratumor Heterogeneity: Role in Therapy Response, Resistance, and Clinical Outcome. Clin Cancer Res. 2015;21(2):249–57. doi: 10.1158/1078-0432.CCR-14-0990. [DOI] [PMC free article] [PubMed] [Google Scholar]
- 22.Cui Y, Tha KK, Terasaka S, et al. Prognostic Imaging Biomarkers in Glioblastoma: Development and Independent Validation on the Basis of Multiregion and Quantitative Analysis of MR Images. Radiology. 2015:150358. doi: 10.1148/radiol.2015150358. [DOI] [PMC free article] [PubMed] [Google Scholar]
- 23.Hylton NM, Gatsonis CA, Rosen MA, et al. Neoadjuvant Chemotherapy for Breast Cancer: Functional Tumor Volume by MR Imaging Predicts Recurrence-free Survival—Results from the ACRIN 6657/CALGB 150007 I-SPY 1 TRIAL. Radiology. 2015:150013. doi: 10.1148/radiol.2015150013. [DOI] [PMC free article] [PubMed] [Google Scholar]
- 24.Wu J, Gensheimer MF, Dong X, et al. Robust intra-tumor partitioning to identify high-risk subregions in lung cancer: a pilot study. International Journal of Radiation Oncology* Biology* Physics. 2016 doi: 10.1016/j.ijrobp.2016.03.018. [DOI] [PMC free article] [PubMed] [Google Scholar]
- 25.Gillies RJ, Kinahan PE, Hricak H. Radiomics: Images Are More than Pictures, They Are Data. Radiology. 2015:151169. doi: 10.1148/radiol.2015151169. [DOI] [PMC free article] [PubMed] [Google Scholar]
- 26.Caliński T, Harabasz J. A dendrite method for cluster analysis. Communications in Statistics-theory and Methods. 1974;3(1):1–27. [Google Scholar]
- 27.Tibshirani R. Regression shrinkage and selection via the lasso. Journal of the Royal Statistical Society Series B (Methodological) 1996:267–88. [Google Scholar]
- 28.Benjamini Y, Hochberg Y. Controlling the false discovery rate: a practical and powerful approach to multiple testing. Journal of the Royal Statistical Society Series B (Methodological) 1995:289–300. [Google Scholar]
- 29.Vaupel P. Hypoxia and aggressive tumor phenotype: implications for therapy and prognosis. The oncologist. 2008;13(Supplement 3):21–6. doi: 10.1634/theoncologist.13-S3-21. [DOI] [PubMed] [Google Scholar]
- 30.Ashraf AB, Daye D, Gavenonis S, et al. Identification of intrinsic imaging phenotypes for breast cancer tumors: preliminary associations with gene expression profiles. Radiology. 2014;272(2):374–84. doi: 10.1148/radiol.14131375. [DOI] [PMC free article] [PubMed] [Google Scholar]
- 31.Guo W, Li H, Zhu Y, et al. Prediction of clinical phenotypes in invasive breast carcinomas from the integration of radiomics and genomics data. Journal of Medical Imaging. 2015;2(4):041007. doi: 10.1117/1.JMI.2.4.041007. [DOI] [PMC free article] [PubMed] [Google Scholar]
- 32.Zhu Y, Li H, Guo W, et al. Deciphering Genomic Underpinnings of Quantitative MRI-based Radiomic Phenotypes of Invasive Breast Carcinoma. Scientific reports. 2015:5. doi: 10.1038/srep17787. [DOI] [PMC free article] [PubMed]
- 33.Burnside ES, Drukker K, Li H, et al. Using computer-extracted image phenotypes from tumors on breast magnetic resonance imaging to predict breast cancer pathologic stage. Cancer. 2015 doi: 10.1002/cncr.29791. [DOI] [PMC free article] [PubMed] [Google Scholar]
- 34.Agner SC, Rosen MA, Englander S, et al. Computerized image analysis for identifying triple-negative breast cancers and differentiating them from other molecular subtypes of breast cancer on dynamic contrast-enhanced MR images: a feasibility study. Radiology. 2014;272(1):91–9. doi: 10.1148/radiol.14121031. [DOI] [PMC free article] [PubMed] [Google Scholar]
- 35.Wu J, Aguilera T, Shultz D, et al. Early-Stage Non–Small Cell Lung Cancer: Quantitative Imaging Characteristics of FDG-PET/CT Predict Distant Metastasis. Radiology. 2016 doi: 10.1148/radiol.2016151829. in press. [DOI] [PMC free article] [PubMed]
- 36.Chaudhury B, Zhou M, Goldgof DB, et al. Heterogeneity in intratumoral regions with rapid gadolinium washout correlates with estrogen receptor status and nodal metastasis. J Magn Reson Imaging. 2015;42(5):1421–30. doi: 10.1002/jmri.24921. [DOI] [PMC free article] [PubMed] [Google Scholar]
- 37.Rastogi P, Anderson SJ, Bear HD, et al. Preoperative chemotherapy: Updates of National Surgical Adjuvant Breast and Bowel Project Protocols B-18 and B-27. J Clin Oncol. 2008;26(5):778–85. doi: 10.1200/JCO.2007.15.0235. [DOI] [PubMed] [Google Scholar]
- 38.Partridge SC, Vanantwerp RK, Doot RK, et al. Association between serial dynamic contrast-enhanced MRI and dynamic 18F-FDG PET measures in patients undergoing neoadjuvant chemotherapy for locally advanced breast cancer. J Magn Reson Imaging. 2010;32(5):1124–31. doi: 10.1002/jmri.22362. [DOI] [PMC free article] [PubMed] [Google Scholar]
- 39.Tateishi U, Miyake M, Nagaoka T, et al. Neoadjuvant chemotherapy in breast cancer: prediction of pathologic response with PET/CT and dynamic contrast-enhanced MR imaging—prospective assessment. Radiology. 2012;263(1):53–63. doi: 10.1148/radiol.12111177. [DOI] [PubMed] [Google Scholar]